DemographyThe scientific study of population.U.S. Ce.docx
Voong,ChanESRIfinal
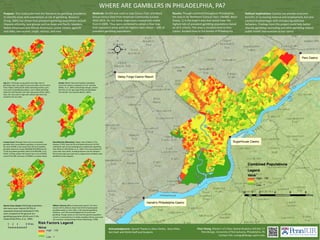
1. WHERE
ARE
GAMBLERS
IN
PHILADELPHIA,
PA?
Chan
Voong, Master’s
of
Urban
Spatial
Analytics
(MUSA)
‘17
PennDesign,
University
of
Pennsylvania,
Philadelphia,
PA
Contact
Info:
voongc@design.upenn.edu
Acknowledgments:
Special
Thanks
to
Dana
Tomlin,
Amy
Hillier,
Ken
Steif,
and
MUSA
Staff
and
Students
Age
(65+):
Although
young
adults
have
high
rates
of
gambling,
adult
men
aged
55
years
and
older
were
found
to
have
a
higher
SOGS
(South
Oakes
Gambling
Screen)
score,
more
years
of
gambling
problems,
and
a
higher
gambling
debt
than
both
females
and
other
age
groups
(Petry,
2001).
Here,
65+
was
used
to
align
with
veteran
data
that
only
existed
for
65
and
older.
Gender (Male):
Men
participated
in
gambling
more
than
women
compared
at
74
vs.
46
times
(Welte,
et
al.,
2004).
Interestingly
though,
women
had
later
on-‐set
age
of
gambling
and
developed
the
disorder
more
quickly
(Ibanez,
2003).
Purpose: This
study
pulls
from
the
literature
on
gambling
prevalence
to
identify
areas
with
populations
at
risk
of
gambling.
Research
(Fong,
2005)
has
shown
that
prevalent
gambling
populations
include
Hispanic
ethnicity,
race
groups
such
as
Asian
and
Pacific
Islanders,
Native
Americans
and
African
Americans,
senior
citizens
aged
65
and
older,
low
income,
single,
veteran,
and
men.
Methods: ArcGIS
was
used
to
map
Census
Tract
and
Block
Group
Census
Data
from
American
Community
Surveys
2010-‐2014.
Six
risk
factor
maps
were
created
and
scaled
from
0-‐100%.
They
were
combined
to
obtain
a
final
map
that
represents
areas
with
the
highest
rates
(Value
=
100)
of
prevalent
gambling
populations.
Results: Though
scattered
throughout
Philadelphia,
the
area
in
far
Northeast
(Census
Tract:
036400,
Block
Group:
1)
is
the
largest
area
that
would
have
the
highest
rate
of
prevalent
gambling
populations
based
on
all
6
criteria.
This
area
is
situated
close
to
Parx
Casino,
located
close
to
the
border
of
Philadelphia.
Political
Implications:
Casinos
can
provide
economic
benefits
of
increasing
revenue
and
employment,
but
also
societal
disadvantages
with
introducing
addictive
behaviors.
Findings
from
this
project
could
help
better
allocate
gambling
counseling
and
other
gambling-‐related
public
health
interventions
across
space.
Race/Ethnicity
(Minorities):
Higher
rates
of
Black
(7.7%),
Hispanic
(7.9%),
Asian
(6.5%)
and
Native
American
(10.5%)
individuals
had
current
pathological
or
problematic
gambling
than
Whites
(1.8%)
(Welte,
et
al.,
2001).
This
map
contains
all
races
other
than
white,
including
Hispanic
and
non-‐Hispanic.
NH-‐minority
data
was
used
since
a
large
portion
of
Blacks
were
identified
as
Non-‐Hispanic.
Income
(Low):
Although
there
were
more
problem
gamblers
than
non-‐problems
gamblers
in
income
levels
less
than
49,999,
it
was
shown
that
28.2%
of
problem
gamblers
had
more
money
($30,000-‐$49,999)
than
the
15.9%
of
problem
gamblers
with
0-‐$14,999
(Afifi,
et
al.,
2010).
In
Philly,
median
HH
income
has
a
min
of
$2499,
max
of
$151406,
and
mean
of
$39841,
as
shown
above.
Marital
Status
(Single):
Pathological
gamblers
who
were
never
married
(26.5%)
or
separated/
divorced/
widowed
(27.5%)
were
compared
to
the
general
non-‐
gambling
population
(20.9%
and
17.4%,
respectively)
(Petry,
et
al.,
2005).
Military
(Veteran,
65+):
A
study
examining
U.S.
Air
Force
recruits
(N=31,104)
has
shown
that
10.4%
of
participants
gambled
weekly
or
more
often,
6.2%
reported
gambling
problems,
and
1.9%
acknowledged
loss
of
control
over
gambling.
Though
values
are
less
than
the
general
population,
concern
is
warranted
due
to
widely
available
military
sponsored
slot
machines
and
gambling
activities
(Steenbergh,
2008).