1.
Tanger Factory Outlets (NYSE: SKT) Mohit Hajarnis & Carter Chen
1
Tanger Factory Outlets owns and operates, or has
part ownership in, 46 outlet malls in 26 states and
Canada, located along highways or near popular
tourist destination. Tanger is the only pure-play
outlet center REIT, and the outlet format offers
unique advantages to tenants and their customers,
and by extension, Tanger’s investors.
Investment Thesis
• Tanger is a well-run business with strong brand
value, superior corporate strategy, and
management.
• Tanger has stewarded capital well in comparison
to its competitors: a low DSCR and debt/equity
ratio give Tanger room to grow using extra debt
without compromising shareholder’s equity.
• Demand for outlet space has increased
dramatically since 2008 because retailers have
come to view outlets as part of their market
segmentation strategy, not just a channel to off-
load extra inventory.
• Tanger’s long-lived leases are locked-in at low
historical rates, but a historical premium of 20%
for renewals and 70%+ premium for re-tenanted
leases will drive revenue through 2018.
• Tanger’s intrinsic value is obscured by
accounting and valuation intricacies.
Recommendation: Long-term Buy
2
Key Drivers
• Outlet sales have grown at 10% CAGR since
2008, and rent has grown at 3.1% CAGR
• Tanger generates revenues across economic
cycles: recessions drive consumers to seek
discounts at outlet stores.
• Tanger’s rents represent ~ 5% of tenant costs
(2Q2014), compared to mall rents, which
represent ~ 12% of tenant costs.
• Tanger benefits from economic moats arising
from barriers to entry and brand value.
Bulls Say
• Tanger is focusing on saturating the US outlet
market while competitors Simon and GGP are
focusing on saving their mall franchises.
• Tanger has maintained 95%+ occupancy for the
past 10 years.
• Tanger has a strong pipeline of ~1.5M square
feet GLA in the next five years, which is already
financed and will require no additional debt.
Bears Say
• Tanager faces threats from e-commerce sites
like Gilt.com, which offers similar discount sales
on luxury goods.
• Discounting luxury merchandise is an
unsustainable business because it damages
brand value and cannibalizes sales.
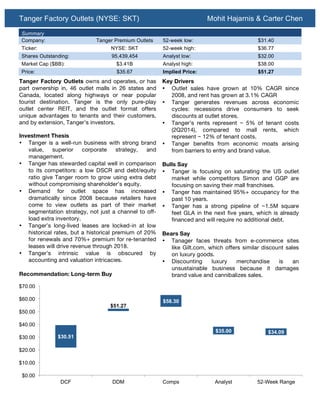
Summary
Company: Tanger Premium Outlets 52-week low: $31.40
Ticker: NYSE: SKT 52-week high: $36.77
Shares Outstanding: 95,439,454 Analyst low: $32.00
Market Cap ($BB): $3.41B Analyst high: $38.00
Price: $35.67 Implied Price: $51.27
$30.51
$51.27
$58.30
$35.00 $34.09
$0.00
$10.00
$20.00
$30.00
$40.00
$50.00
$60.00
$70.00
DCF DDM Comps Analyst 52-Week Range
2.
Tanger Factory Outlets (NYSE: SKT) Mohit Hajarnis & Carter Chen
3
Business Overview & Analysis
Business Model
Tanger generates revenues by collecting base rents,
percentage rents, and expense reimbursement from
its tenants. Base rents represent minimum rent
charged per square foot to tenants. The average
base rental rate has grown at 1.5% between 2012
and 2013, and 7.4% between 2011 and 2012. This is
largely because Tanger does not adjust rents yearly,
but rather provides long-term fixed leases, which are
attractive to established tenants looking to manage
costs. The growth in base rent is reflective of lease
renewals and re-tenanting (footnote for definition): In
2012, 2.1 M sq ft of space was renewed or re-
tenanted, and in 2011, 2.0 M sq ft was renewed or
re-tenanted. The rates Tanger charges on renewed
or re-tenanted leases reflect wider demand for
Outlet mall space and various economic factors. In
2013, average new rent for re-tenanted space was
$30.57, less than the $31.72 new rent in 2012. This
drop is reflective of additional supply in the market
from expansions by Tanger and its competitors.
Tanger also collects percentage rent: a percentage
of tenants’ sales volume above predetermined
levels. As base rents are fixed higher, the
predetermined levels are set higher as well –
reflecting Tanger’s commitment to keeping tenant
costs low. Tanger’s second largest revenue segment
is Expense Reimbursements. Contractually, tenants
are responsible for certain common expenses such
as common area maintenance, insurance, tax,
advertising, and other property management
4
expenses. These expenses are offset by equivalent
property maintenance and some SG&A expenses –
and have no effect on Net Income; if expense
reimbursements increased or decreased, certain
maintenance and SG&A expenses would increase or
decrease equivalently. Nonetheless, the expense
reimbursement strategy helps widen Tanger’s
margins and keep base rents – the most observed
metric – low.
Strategy
Tanger’s strategy is centered on capturing strong
macro fundamentals (see page 4), conservative
business practices and capital stewardship, and
strong property development.
One of Tanger’s strengths as a business is the
constant demand for Outlet stores across economic
cycles and fashion preferences. Despite the sharp
downturn in 2007 – 2009, Tanger continued to grow
its dividend because consumers switched to
shopping at Outlets for discounted brands instead of
department stores. Tanger’s tenants’ ability to deliver
savings for customers drives additional business
during economic turmoil, and provides counter-
cyclical drivers for growth. Additionally, Tanger’s
portfolio is immune to changes in fashion: its largest
tenants are retailers with experience in fashion and
span the fashion spectrum: Gap, Banana Republic,
Old Navy, Tommy Hilfiger, Nike, Nautica, and Polo
Ralph Lauren. Additionally, it has been refreshing its
portfolio with new brands such as H&M, Forever 21,
$0
$5
$10
$15
$20
$25
$30
$35
$0
$50
$100
$150
$200
$250
$300
$350
$400
$450
2004
2005
2006
2007
2008
2009
2010
2011
2012
2013
TTM
$/Sq.Ft.
$MM
SKT Historicals
Total Revenues
FFO
Dividends
Rev per Square Foot
FFO per Square Foot
3.
Tanger Factory Outlets (NYSE: SKT) Mohit Hajarnis & Carter Chen
5
and Under Armour (3Q 2014 Earnings Call).
According to management, as business in a brand
dies down, business in another brand picks up;
according to CEO Steven Tanger, “For every Coach
there is a Michael Kors.”
Tanger is unique amongst competitors Simon and
GGP, which operate malls and outlets under
individual names, because it operates all of its
outlets under the Tanger brand. The brand has
generated value with retailers and consumers, as
demonstrated by its industry leading occupancy
rates and traffic growth. Tanger has maintained
occupancy greater than 98% for the past three
years, because Tanger maintains a strong brand.
Additionally, Tanger has built strong retailer
relationships over its 30+ year history; the typical
Tanger tenant is a large national chain, and stable
over the long term. This insulates Tanger from
bankruptcies and fluctuations in consumer
preferences. Additionally, it eliminates the need for a
provision for doubtful accounts, which competitors
Simon and GGP have needed to account for loses
from tenants going out of business. Tanger’s long-
term leases provide value to tenants through locked-
in rates and managed costs, making them an
attractive partner to retailers. Tanger’s percentage
rentals have also increased over the last three years
– reflective of “higher tenant sales,” and Tanger
brand value with shoppers.
REITs can be a risky investment because capital
mismanagement can wipe out common equity and
suffocate strong revenues with high interest
payments. However, Tanger’s management is
notably conservative, and a strong asset for
shareholders. Tanger focuses on growth solely in the
United States and Canada, seeking “under-served
markets” as sources of future growth, while
competitor Simon has undertaken a joint venture in
China to expand its footprint. While the risk/reward
may be higher for Simon, Tanger’s management has
been dependable in delivering consistent returns to
shareholders. Since its IPO, Tanger has increased its
dividend every single year – even through the
financial crisis. According to Morningstar, Tanger
has developed roughly 10% ROREA for the past 15
years, moving between 7.8% in 2003 to 12.3% in
2002. The highly dependable nature of Tanger’s
management is reflective of its roots: current CEO
Stephen Tanger founded the business alongside his
6
father, Stanley Tanger in 1981, and the company has
the longest history in the outlet business: 33 years.
Stephen Tanger has been in senior management
positions at Tanger since 1986, and was paid 61%,
79%, and 67% of total compensation in restricted
stock units in 2011, 2012, and 2013, respectively –
reflecting a “skin-in-the-game” mentality.
Tanger has consistently grown its property portfolio
by targeting specific markets that would be best
served by an outlet mall. Management considers a
variety of factors in building or acquiring new
properties. The typical market has an average
household income of $65,000, access to major
highways, excellent visibility, or sees at least 5
million visitors a year. The company typically adds
between 600K and 700K square feet every year, and
has expanded consistently over the past five years.
Simultaneously, the company has maintained strong
financial health by reducing Debt/Equity from 5.20X
in 2008 to 1.95X in 2010, and then slowly increasing
it to 2.54X in 2013. The slow, yet consistent,
expansion of Tanger’s portfolio reflects its
commitment to manageable growth without
overextending the balance sheet. The company is
committed to long-term growth: while interest rates
are low and the company can refinance or borrow, it
is investing in new properties and a strong “shadow
pipeline” of properties – promising greater revenues
in the future.
This commitment to strong capital stewardship is
one of Tanger’s defining traits. Tanger owns 44
(including joint ventures) outlet properties, while
Simon owns 66, but Tanger has a superior DSCR
(2.46X vs. 2.12X), and Debt/Equity ratio (2.54X vs.
4.03X). Additionally, ~ 80% of Tanger’s debt is fixed.
Tanger has stewarded capital much better than its
competitors; REITs are troublesome for some
investors because they often issue new shares to
fund projects because they have very little retained
earnings. Tanger has diluted common equity twice in
the past 10 years: July 2011 and August 2009 for a
total of $244.1 M. However, Tanger’s competitors,
Simon and General Growth Properties, have issued
over $350 M in preferred shares to special investors
over the past 10 years, and declared bankruptcy –
wiping out common equity, respectively.
However, this conservative leadership has sacrificed
opportunities for additional return in return for
4.
Tanger Factory Outlets (NYSE: SKT) Mohit Hajarnis & Carter Chen
7
additional risk. Tanger’s focus on North American
expansion has caused it to ignore foreign expansion
into markets like China and the Middle East, where
competitors, like Simon, have opened new outlets.
Tanger has sufficient room in its balance sheet to
raise debt and take on riskier, high-yield projects.
Additionally, by focusing on the business and long-
term growth (a positive, no doubt), the company is
ignoring medium term investors by front-loading
Capital Expenditures and diluting Free Cash Flow.
Although this strategy guarantees bigger dividends
for long-term shareholders, it colors the market’s
perception of the company’s long-term profitability,
leading the market to price the company at a
discount to its peers.
Industry Overview
The modern outlet center first appeared in the early
1970s and outlet stores have been an effective and
unique distribution channel for retailers ever since.
Today, the US is home to 368 outlet centers, housing
~13,000 stores for a total of 78 million square feet of
retail space. The first factory stores—built in the
1930s—were established to unload excess inventory
and damaged goods. The value proposition was
simple: provide a channel to dispose of problem
merchandise that is remote enough from flagship
stores so it does not dilute brand value. That value
proposition still exists today: brands like Nike use
outlets to sell hard-to-move merchandise, i.e. shoes
with flashy colors or abnormal sizes. But the value of
outlet malls has vastly expanded since then. The
central value proposition of the modern outlet center
comes from effective price discrimination. Outlet
centers are simply made and remote enough to
8
avoid patronage from affluent costumers. However,
bargain hunters will make the hike for the discounted
merchandise (the average discount at an outlet store
was 38% in 2012).
Merchandise varies, but effective costumer
segmentation remains the driving force behind
retailers’ selections of offerings. To this effect,
retailers offer a variety of goods in their outlet stores.
These range from items identical to those in their full
price channels, to items specifically made for outlet
stores—Brooks Brothers 346 line is a good example
of this.
The outlet industry continues to grow at a healthy
pace. US outlet center gross leasable area (GLA) has
grown at a 5.3% CAGR over the past 6 years, and
now stands at 86 million square feet. During the
same period, sales per square foot have notched a
4.8% CAGR, growing from $301/sq. ft. in 2008 to
$398/sq. ft. in March of this year. Average rents have
kept pace, growing from $28/sq. ft to $34/sq. ft., a
CAGR of 3.1%.
The unique outlet model makes it somewhat a-
cyclical. When full-price retailers are doing well, they
do not feel the need to cut prices, and hence outlets’
deep discounts are all the more attractive. From the
2Q14 conference call with PVH Corp. CEO Manny
Chirico: “[T]he healthiest environment for the outlet
channel is when regular retail is doing well, because
there’s not a compelling message going on at regular
retail from a promotional point of view.” Outlets’
value proposition for both the consumer and retailer
is at its most robust in good times. However even in
$301
$331
$357
$398
$28
$25
$30
$34
-
10
20
30
40
50
60
70
80
90
$0
$100
$200
$300
$400
$500
2008
2010
2012
2014
SquareFeet(MM)
$/SquareFoot
Growth of the US Outlet Industry
Total US Outlet Center GLA
Sales per Square Foot
Average Rent per Square Foot
5.
Tanger Factory Outlets (NYSE: SKT) Mohit Hajarnis & Carter Chen
9
mean times, outlet centers’ value proposition is still
intact. There is only so much full-price stores are
willing to discount, and hence outlet traffic is steadier
in bad economic times than traffic at full-price
stores.
Industry Risks
Despite robust growth, the outlet industry has its
share of naysayers. Bears’ wariness can be boiled
down to two concerns. 1) Effective price
discrimination is unachievable, and outlet stores
cannibalize sales from full price channels. 2) Outlets
0
dilute brand value. These concerns give rise to
questions about whether outlet malls are a truly
effective and sustainable retail channel, or whether
they inflate sales at the expense of margins and
brand identity.
To address these concerns, We think it is important
to draw a distinction between brands that are
considered luxury (or “accessible luxury”) and brands
that are not. Part of the appeal of a luxury brand, like
Coach, Michael Kors, or Burberry, is its exclusivity.
For the consumers of these brands, there is an
appeal from the sense of luxury that comes from a
high price tag. So discounts on these luxury brands
have the potential to dilute brand value, as they make
these items less exclusive. We believe that this
phenomenon exists. The decline of the Coach brand
over the past few years is evidence of this trend.
However, we believe that brands that are not
traditionally considered luxury—Gap, Banana
Republic, Van Heusen, and other core constituents
of outlet malls—are not subject to this brand dilution.
For the consumer of these items, exclusivity is not a
concern—and so dilution should not be feared for
these brands. And in fact, these luxury brands make
up only a small portion of outlet storefronts—14% by
our calculations.
We also see no evidence of ineffective price
discrimination. Like we mentioned above, outlets are
a complement to full-price retailers, especially when
full price retailers are doing well. Glenn Murphy, CEO
of Gap, Inc. notes during their 2Q14 conference call
“this incredible relationship between the specialty
business and our outlet business.” He goes on to
comment that “The only place that we’re seeing real
estate growing and square footage increasing as in
lifestyle centers after being converted to the power
centers, or being converted to outlet centers.”
Largest Outlet Chains by Store Count in 2014
Dressbarn/Dressbarn Woman 205
Carter’s Outlets 160
Gymboree 156
Tommy Hilfiger 155
Van Heusen 154
Gap Outlet 152
Wilsons Leather Outlet 150
OshKosh B’Gosh Outlet 142
Polo Ralph Lauren Factory Stores 139
Banana Republic Factory Stores 128
Levi’s Outlet 128
Aeropostale Outlet 126
Brooks Brothers Factory Store 125
Children’s Place Outlet 124
Lane Bryant Outlet 118
Izod 117
PacSun 112
Guess? Factory Store 110
Jockey Outlet 110
Calvin Klein 107
Names in Red represent Luxury Brands
% of Total Stores that are Luxury: 14%
Source: Value Retail News
Outlet Stores from a Retailer’s Perspective
Luxury Everyday Upscale Everyday
Regular Consumers Cannibalize Sales Cannibalize Sales Grow Sales
Discount Consumers Grow # of Customers Grow # Customers Grow Sales
6.
Tanger Factory Outlets (NYSE: SKT) Mohit Hajarnis & Carter Chen
1
Key Value Generators
Market Rent and a Growing Portfolio
Tanger’s profitability in the next five years, and
beyond, will be primarily driven by the renewal of
long-lived leases in its portfolio and strong pipeline
of new properties and expansions. The industry
average for outlet center base rent is $33.72 psf
(Value Retail News), but Tanger charges $20.40 psf.
We assert that there are no material differences
between Tanger’s properties and competitors’
properties, but in fact Tanger properties may be
more valuable because the Tanger brand name
drives customer traffic. In Y/E 2013, Tanger received
a 19.3% premium on its renewed leases and a
37.8% premium on re-leased properties. The
discrepancy between Tanger’s base rent and the
market rent suggests that Tanger can capture a
significant premium on renewals – and an even
higher premium on properties that are re-leased
(current tenant leaves and a new tenant leases the
property).
A forward prediction of the revenue increases from
renewed and re-leased properties in Y/E
demonstrates 11.9% projected revenue growth. We
divided total properties up for renewal/re-tenanting
into 25% re-tenanted and 75% renewed, reflective of
the traditional mix. We anticipate that this ratio may
lean more towards re-tenanted properties this year
because of the Coldwater Creek bankruptcy, which
should open additional space. We estimated that all
renewed leases would be charged a 20% premium,
and all re-tenanted / new properties would earn the
market rate for base rent - $33.72. All other revenues
were estimated using Revene/psf ratios and keeping
them fixed over the long term (Additional information
on valuation is available on page 8).
Most beneficial to Tanger’s long-term revenue
growth is its robust pipeline of new and renovated
outlet properties. Over the next three year, Tanger
plans to open 2.5 million square feet (weighted for
ownership). Assuming Tanger receives the market
rent for these properties, average rents for Tanger’s
portfolio should increase, and given the 8-year
average term of its expiring leases this year, these
rates should remain lock in for a considerable period
of time – protecting the company from
macroeconomic retail trends. We used the
company’s estimates for renewals, the historical ratio
of renewal / re-tenanting, and company’s stated
2
portfolio expansions from press releases and
earnings calls. Tanger is growing their portfolio faster
than their historical pace because they were able to
raise debt at low rates between 2010 and 2014, and
spend it on capital expenditures over the next five
years.
Balance Sheet Health
Tanger’s portfolio growth is especially remarkable
because the company has not overextended its
balance sheet to fund growth. Tanger’s DSCR is
2.46X, compared to Simon’s 2.12X and GGP’s 1.13X
DSCRs. The DSCR ratio reflects the company’s
ability to take on additional debt; Tanger can take on
a maximum of $1.9B of new debt, doubling total
debt and (assuming new debt is spent on new
properties at $292 psf), growing the total portfolio by
6.3 million square feet – growing its portfolio by
50%. The same is not true for Tanger’s competitors
because their DSCRs are pushing the limits set in
their debt covenants. Tanger’s ability to take on
Renewal 2014 (E)
Square Feet 838,181
Average Expiring
Rent
$19.38
Average New Rent $23
Premium 20%
Release 2014 (E)
Square Feet 902,819
Average Expiring
Rent
-
Average New Rent $34
Premium -
Total Square Feet* 13,010,000
*Including new properties
Revenue Breakdown
($KK)
2014 (E)
Base Rentals $280,290.12
Percentage Rentals $11,804.31
Expense
reimbursement
$115,046.67
Other Income $11,228.31
Total Income $418,369.43
Base Rentals / Sq Ft $21.50
Percentage Rentals /
Sq Ft
$0.91
Expense
reimbursement / Sq
Ft
$8.83
Other Income / Sq Ft $0.86
7.
Tanger Factory Outlets (NYSE: SKT) Mohit Hajarnis & Carter Chen
3
additional debt and grow the portfolio is an important
component of its value generating process. We can
objectively see the health of Tanger’s balance sheet
from its recent balance sheet activity. Tanger
refinanced its $250M Sr. Loan (I) down from 6.15%
to 3.75% due 2024. These 10-year loans incur a ~
150 bps premium to 10-year US treasuries,
suggesting a low estimated probability of default. A
similar Sr. Loan issued by CBL & Associates for
$300MM in October 2014 was priced at 4.60% - 85
bps above Tanger’s debt.
Risks & Other Considerations
Tanger’s biggest concerns are competition with
malls, other REITs, and online shopping.
At a fundamental level, malls and outlet centers
rarely compete for customers because consumers
go to Outlet malls seeking the deep discounts that
retailers do not provide at malls. However, Tanger
strategically builds properties far from urban centers,
so most customers make a day-trip out to outlet
centers, instead of competing for business with local
malls, and spending more than they do at traditional
malls.
Tanger (SKT) Simon (SPG) GGP
Macerich
(MAC)
CBL Average
$ Rent / Sq Ft $20.40 $42.34 $71.29 $44.51 $42.48 $44.20
Tenant $ Sales / Sq
Ft
$387.00 $582.00 $564.00 $527.25 $356 $483.25
Occupancy Cost % 5.27% 7.27% 12.64% 8.44% 11.93% 9.11%
4
The demand for outlet malls has increased amongst
other investors. However, Tanger believes that it
maintains an economic moat because of its long-
standing partner relationships, which are necessary
for high occupancy properties. However, outlet
developers like Simon and General Growth
Properties, compete with Tanger for prime properties
to build outlet malls, which Tanger cannot protect
against. Moreover, with Simon and GGP’s larger,
albeit less healthy, balance sheets, they can acquire
properties or out-bid Tanger on key properties.
Moreover, the rapid growth of outlet malls in the US
may reduce profitability per property and decrease
the company’s ROREA.
Tanger has faced constant competition from online
shopping, but historical financial results have proven
the company’s resilience to new entrants. However,
the advent of new discount luxury online retailers like
Gilt.com proves problematic for Tanger’s business
model of offering luxury goods at discount prices.
Gilt.com generated $550 M in sales in 2012,
compared to $450 M in 2011
(http://www.bloomberg.com/news/2013-07-31/gilt-
groupe-ceo-seeks-to-prove-flash-sales-are-no-
fad.html), demonstrating a clear demand for the
$5.36
$2.51
$2.85
$4.20
$4.88
$5.03
$8.51
$8.92
$8.43
$9.09
$8.06
$0
$5
$10
$15
$20
$25
$30
$35
$40
Y/E 2008
Y/E 2009
Y/E 2010
Y/E 2011
Y/E 2012
Y/E 2013
2014 (E)
2015 (E)
2016 ( E)
2017 (E)
2018 (E)
Lease Expirations and Projected Premiums
Avg. Premium on New Rents
Industry Average Rent
8.
Tanger Factory Outlets (NYSE: SKT) Mohit Hajarnis & Carter Chen
5
product. However, Gilt.com services a different need
than Tanger outlets. Foremost, Gilt.com is geared
toward younger consumers with high incomes, while
Tanger Outlets are marketed to older, middle-
income Americans. Additionally, Gilt.com seeks to
off-load retailers excess inventory, not provide the
same exposure to new consumers or grow existing
consumers. Finally, retailers view Gilt.com as a
means of reducing inventory risk; by selling the
discounted inventory at, or below, cost, it reduces
the risk that it will be unable to sell the merchandise
eventually. Outlet malls serve an entirely different
need than Gilt.com.
Valuation
To understand the value in Tanger, we modeled
Tanger in two ways: a DCF valuation and a
Discounted Dividend Model. We chose to expand
our valuation by including a DDM because the
tangible cash flows that Tanger’s investors receive
are dividends, while free cash flows are the
hypothetical funds available to investors each year.
Today’s low interest rate environment is providing
opportunities for Tanger to expand its portfolio,
which requires high capital expenditures today.
Those capital expenditures, a cash expense, are
diluting Free Cash Flow, but are not affecting
Adjusted Funds from Operations, the metric which
the company uses to decide dividend payouts.
Historically, the company has paid out roughly 50%
6
to 60% of AFFO, and our model assumed a fixed
payout over the long-term.
Our valuation depended on our projecting the
average rent a new tenant would be charged, as well
as the total square footage in Tanger’s portfolio. We
estimated that the average new rent for 2014 would
be the market rate of $33.72 (via research report)
and would grow at 3% a year. Total square footage
for Tanger’s portfolio was estimated in future years
by taking into account all developing projects Tanger
disclosed, and then adding 700,000 square feet in
2017 and 2018 – in line with historical portfolio
growth. We also took into account the total square
footage renewed each year based on company
estimates in the 10-K. The total square footage was
divided into renewals – which garnered a 20%
premium on expiring rent, and re-tenanting, which
were charged the market rent. All new properties
were charged the average market rent as well. Other
line items were estimated in the following manners:
Percentage rentals: percentage rentals per square
foot (2013) multiplied by square feet for each year.
Expense reimbursements: expense
reimbursements per square foot (2013) multiplied by
square feet for each year.
Other Income: other income per square foot (2013)
multiplied by square feet for each year.
SG&A: SG&A margin was kept constant.
Projections
$KK 2014 (E) 2015 (E) 2016 ( E) 2017 (E) 2018 (E)
Total Revenues $418,369 $475,145 $514,206 $553,698 $598,343
Operating Expenses $137,563 $156,231 $169,074 $182,059 $196,739
D&A $100,455 $108,716 $113,918 $119,313 $124,707
SG&A $44,019 $49,993 $54,102 $58,258 $62,955
Operating Income $136,333 $160,206 $177,112 $194,069 $213,942
Interest Expense $59,373 $59,373 $64,921 $70,675 $70,675
Other Income / GoS $0 $52,004 $0 $0 $52,004
Income before taxes $76,960 $152,837 $112,190 $123,394 $195,271
Equity in earnings of
unconsolidated ventures*
$0 $0 $0 $0 $0
Noncontrolling Income from
Operating Partnership
$0 $0 $0 $0 $0
Net Income $76,960 $152,837 $112,190 $123,394 $195,271
Capital Expenditures $108,133 $116,800 $167,900 $153,300 $153,300
AFFO (Calculated) $18,010.94 $10,001.00 $123,129.59 $160,081.19 $110,592.72
FCF (Calculated) 2014 (E) 2015 (E) 2016 ( E) 2017 (E) 2018 (E)
*Represents earnings in joint ventures - accounted in Total Revenues in this model
9.
Tanger Factory Outlets (NYSE: SKT) Mohit Hajarnis & Carter Chen
7
D&A: D&A per square foot (2013) multiplied by total
square footage for the year.
Interest Expense: Interest expense divided by total
debt (2013), 4.54%, multiplied by total debt for each
year.
Total Debt: Stated asset value dividend by square
feet (2013) multiplied by new square feet not already
financed (2017 – 2018). Debt is raised in the same
year capital expenditures are incurred. Although
CapEx is $292 per square foot, New Debt is roughly
$1,000 per square foot given the cost of land and
carrying value of the finished asset.
Capital Expenditures: Building expenses per square
foot (2013), $292, multiplied by half of total square
footage added in the given year, and in the following
8
year.
Cost of Debt: dividing interest expense by total debt
for the year, 4.54% - kept constant given high
percentage of fixed debt.
Cost of Equity: CAPM. See model for breakdown.
The terminal value is estimated in two ways: using a
terminal growth rate, of 2%, and a growth multiple,
which is the current P/E of 31.57X.
Our DCF output was $21.73 (terminal growth rate)
and $39.28 (terminal multiple). The $39.28 value is
close to the current market price, lending credence
to our assertion that the market believes Tanger is
fairly valued because its DCF models indicate a fair
value near $35 - $37. However, our DDM output was
$50.31 (terminal growth rate) and $52.60 (terminal
Growth Rate Method
Enterprise Value $4,801,340
Debt -
Market Value $4,801,340
Implied Price $50.31
Upside 40.8%
Terminal Dividend Yield Method
Enterprise Value $4,985,953
Debt -
Market Value $4,985,953
Implied Price $52.24
Upside 46.3%
Sensitivity Analysis
Market Return
$50.31 6.0% 6.5% 7.0% 7.5% 8.0%
TerminalGrowth
Rate
1.0% $43.32 $40.59 $38.18 $36.03 $34.11
1.5% $50.15 $46.49 $43.32 $40.55 $38.11
2.0% $59.89 $54.69 $50.31 $46.57 $43.34
2.5% $74.90 $66.85 $60.35 $54.99 $50.49
3.0% $101.04 $86.76 $76.00 $67.60 $60.85
9
dividend yield), which we think is an accurate
representation of Tanger’s intrinsic value. While front-
loading cash expenses when it is easy and cheap to
raise debt is a strong strategy for long-term
investors, it depresses calculated Free Cash Flow,
and thereby underprices the intrinsic value of the
business. The tangible cash flows investors receive
are dividends, and we estimate a 40% - 45% upside.
This valuation is attractive to the 3 – 5 year investor
because it provides the market with sufficient time to
0
move the price closer to intrinsic value, but
nonetheless provide a healthy 2.7% dividend yield
over the next 3 – 5 years, guaranteeing 8.1% to
13.5% return in realized dividends, plus reinvestment
gains. The margin of safety generated by the
dividends is attractive to the conservative investor.
Market Return
$52.24 6.0% 6.5% 7.0% 7.5% 8.0%
SKTYield
2.1% $65.68 $65.01 $64.35 $63.70 $63.06
2.3% $59.01 $58.41 $57.82 $57.24 $56.67
2.6% $53.67 $53.13 $52.60 $52.07 $51.55
2.9% $49.31 $48.82 $48.33 $47.85 $47.37
3.1% $45.67 $45.22 $44.77 $44.32 $43.88
10.
Tanger Factory Outlets (NYSE: SKT) Mohit Hajarnis & Carter Chen
Revenue Breakdown ($KK) Y/E 2011 Y/E 2012 Y/E 2013 1Q 2013 2Q 2013
Base Rentals $207,637 $235,233 $253,402 $66,976 $68,160
Percentage Rentals $9,084 $11,172 $11,251 $2,083 $1,915
Expense reimbursement $89,620 $101,110 $109,654 $31,542 $29,452
Other Income $8,882 $9,482 $10,702 $2,241 $2,749
Total Income $315,223 $356,997 $385,009 $102,842 $102,276
Base Rentals / Sq Ft $18.72 $20.10 $20.40 $5.39 $5.49
Percentage Rentals / Sq Ft $0.82 $0.95 $0.91 $0.17 $0.15
Expense reimbursement / Sq Ft $8.08 $8.64 $8.83 $2.54 $2.37
Other Income / Sq Ft $0.80 $0.81 $0.86 $0.18 $0.22
Real Estate Assets / Debt Y/E 2011 Y/E 2012 Y/E 2013 Maturity Rate
Assets
Land $141,577 $148,002 $230,415
Buildings, Improvements &
Fixtures
$1,434,637 $1,799,350 $2,019,404
Total $1,576,214 $1,947,352 $2,249,819
Accumulated Depreciation $453,145 $582,859 $654,631
Liabilities
Senior notes
Senior notes (1)* $249,490 $249,683 $249,789 Nov '15 6.15%
Senior notes (2) $298,019 $298,350 $298,531 Jun '20 6.13%
Senior notes (3) $245,928 Dec '23 3.88%
Senior exchangeable notes $7,107 Aug '11 3.75%
Mortgages
Atlantic City $56,707 $32,626
November '21
- December
'26
5.14% - 7.65%
Deer Park $148,522 Aug '18 2.80%
Hershey $32,213 $30,963 Aug '15 5.17% - 8.00%
Ocean City $18,825 $18,386 Jan '16 5.24%
Note Payable $9,453 $9,604 Jun '16 1.50%
Unsecured term loan
$250,000 $250,000 Feb '19
LIBOR +
1.60%
Unsecured term note
$7,500 Aug '17
LIBOR +
1.30%
Unsecured lines of credit
$160,000 $178,306 $16,200 Oct '17
LIBOR +
1.00%
Total Debt $714,616 $1,093,537 $1,308,049
Debt Due
Average Cost of Debt 3.95%
Net Working Capital $861,598 $853,815 $941,770
Disclosure: We certify that all work presented is our own, and any external sources are properly
cited. We have disclosed all pertinent information discovered while researching this pitch and also
declare that we find this stock to be an ethical purchase.