2. 2
Table of Contents
Disclaimer...................................................................................................................................................4
Acknowledgements................................................................................................................................5
1.0 BACKGROUND..............................................................................................................................6
1.1 Purpose ............................................................................................................................................7
1.2 Objective of the manufacturing vendors enumeration....................................................8
1.3 Key Research questions ..............................................................................................................8
1.4 Underlying development hypothesis: the causal model...................................................9
2.0 METHODOLOGY, DESIGN AND FRAMEWORK OF ANALYSIS ................................................10
2.1 Methodology and process flow ........................................................................................10
2.2 Data cleaning, validation, capturing and analysis...........................................................12
2.3 Limitations of the study..............................................................................................................12
3.0 DATA ANALYSIS AND RESULTS BY PROVINCE ...........................................................................13
3.1 CENTRAL PROVINCE ...................................................................................................................13
3.1.1 Distribution of vendors by district.....................................................................................13
3.1.2 Distribution of vendors by type of vending ..................................................................14
3.1.3 Conclusion and recommendation on Central Province .........................................15
3.2 COPPERBELT PROVINCE.............................................................................................................16
3.2.1 Distribution of vendors by district.....................................................................................16
3.2.2 Distribution of vendors by type of vending ..................................................................17
3.2.3 Conclusion and recommendation on Copperbelt Province .................................18
3.3 EASTERN PROVINCE ....................................................................................................................19
3.3.1 Distribution of vendors by district.....................................................................................19
3.3.2 Distribution of vendors by type of vending ..................................................................20
3.3.3 Conclusion and recommendation on Eastern Province..........................................20
3.4 LUAPULA PROVINCE ...................................................................................................................22
3.4.1 Distribution of vendors by district.....................................................................................22
3.4.2 Distribution of vendors by type of vending ..................................................................23
3.4.3 Conclusion and recommendation on Luapula Province........................................24
3.5 LUSAKA PROVINCE......................................................................................................................25
3.5.1 Distribution of vendors by district.....................................................................................25
3. 3
3.5.2 Distribution of vendors by type of vending ..................................................................26
3.5.3 Conclusion and recommendation on Lusaka Province ..........................................27
3.6 MUCHINGA PROVINCE..............................................................................................................28
3.6.1 Distribution of vendors by district.....................................................................................28
3.6.2 Distribution of vendors by type of vending ..................................................................29
3.6.3 Conclusion and recommendation on Muchinga Province....................................29
3.7 NORTHERN PROVINCE................................................................................................................30
3.7.1 Distribution of vendors by district.....................................................................................30
3.7.2 Distribution of vendors by type of vending ..................................................................31
3.7.3 Conclusion and recommendation on Northern Province.......................................31
3.8 NORTH-WESTERN PROVINCE.....................................................................................................33
3.8.1 Distribution of vendors by district.....................................................................................33
3.8.2 Distribution of vendors by type of vending ..................................................................34
3.8.3 Conclusion and recommendation on Northwestern Province ..............................35
3.9 SOUTHERN PROVINCE ................................................................................................................36
3.9.1 Distribution of vendors by district.....................................................................................36
3.9.2 Distribution of vendors by type of vending ..................................................................37
3.9.3 Conclusion and recommendation on Southern Province.......................................37
3.10 WESTERN PROVINCE.....................................................................................................................39
3.10.1 Distribution of vendors by district...................................................................................39
3.10.2 Distribution of vendors by type of vending ................................................................40
3.10.3 Conclusion and recommendation on Western Province......................................41
4.0 NATIONAL LEVEL TOTAL COUNT ..................................................................................................43
4.1 Distribution of vendors by Province........................................................................................43
4.2 National distribution of vendors by type of vending ........................................................44
4.3 Conclusion and recommendation on the allocation of industrial yards by district
by province .........................................................................................................................................45
5.0 APPENDICES: ...............................................................................................................................47
5.1 Data collection instrument.......................................................................................................47
4. 4
Disclaimer
This report has been formally edited by the Citizens Economic Empowerment Commission
(CEEC). The designations employed and presentation of material herein contained does
expressly imply the expression of opinion on the part of the Commission. However, the
Commission does not and will not take responsibility for any misuse or misrepresentation of
information contained in the report by third party usage.
5. 5
Acknowledgements
The 2015 light manufacturing street vendors national enumeration is a result of
combined team effort by staff of the Citizens Economic Empowerment
Commission (CEEC) working in collaboration with the United Street Vendors
Foundation (USVEF). The main objective of the study was to conduct a national
enumeration or census of SME type operated light manufacturing business
activities on the streets of all the 103 districts of Zambia. The study was also
meant to capture and document the demographic and socio-economic
characteristics of these street vendors with a view to understanding their
operational environment for effective programming. The study was conducted
in 2014.
Our heartfelt appreciation goes to National and Provincial staff of the
Commission and the United Street Vendors Foundation for bringing this exercise
to conclusion.
We also wish to express special gratitude to the respondents or street vendors for
cooperating with the enumerators by providing very useful information that has
formed the basis for this report. Further, we wish to thank the Director General of
the CEEC, Mr. Likando Mukumbuta for his mentorship support during the
conceptualization of this activity.
It is our sincere hope that all our stakeholders will make effective use of this
report.
6. 6
1.0BACKGROUND
Street and roadside trade is an important economic activity that sustains a
significant percentage of rural and urban dwellers, especially within the
developing countries. The activity falls among the Small and Micro Enterprises
[SME] that form the main thrust for economic development in developing
countries. In Africa, the sector has operated outside the mainstream economic
development, and falls within the informal economic activities. In view of the
difficult economic situation that has faced Africa with reduced external support
and increasing levels of poverty, many countries have began considering the
sector as one of the channels of fostering the private sector’s contribution to
both growth and equity objectives of development.
By 1995, ILO estimates had shown that SMEs accounted for 59 per cent of Sub-
Saharan Africa’s urban labor force [Ondiege, 1995]. Estimates indicate that in
the developing countries 40 to 80 per cent of the urban workforce is in the
informal workforce. Street vendors are the most visible among this workforce,
although their activities, working conditions, relations with authorities, policies
and regulations relating to their operations among others are not well
researched and documented1.
Zambian Government’s Job Creation and Industrialization Strategy emphasizes
the critical role of micro, small and medium enterprises (MSMEs) in Zambia’s
industrial development. Value-adding MSMEs and their value chain networks,
together with agricultural producers, constitute the principle vehicle for creating
at least half of the 1 million decent jobs envisioned to be created in Zambia by
2016.
To fast-track the industrialization process it will be vital to unleash a new era of
rapid development of MSME manufacturing and other value addition
enterprise. It will therefore be essential to improve the participation of
indigenous Zambians in productive industrial enterprise based on a three-
pronged approach:
1. Increase the competitiveness of existing indigenous MSME manufacturers
2. Develop and deploy more indigenous MSME manufacturers
3. Substantially expand their access to markets through preferential
procurement and import substitution strategies
1 Winnie V. Mitullah (2004): A review of street trade in Africa, University of Nairobi Institute for
Development Studies
7. 7
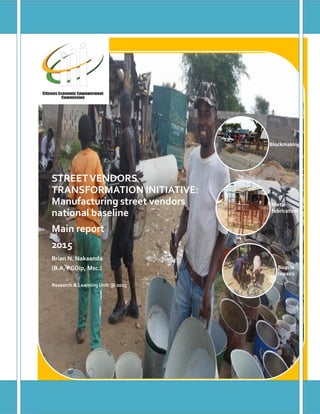
In Zambia today, the most visible existing MSME manufacturers and other value
added service providers come in the form of road-side vendors that include
manufacturers of construction materials (crushed stone, blocks, bricks, pavers,
gates, tank stands, door frames, window frames, grill doors, etc.) and many
other items such buckets, drinking and feeding troughs for livestock, household
furniture, slashes, hoes, spades, rakes, etc.
1.1 Purpose
The purpose of the Street Vendor Transformation Initiative is to develop urban
manufacturing MSMEs in order to accelerate Zambia’s job creation and
industrialization.
In order to facilitate the transformation of existing Street Vendors into more
competitive manufacturers, the Commission will operate a loan facility to
support the development of manufacturing and other value-adding MSMEs with
an emphasis on leveraging “street vendors” into a major vehicle for job creation
and industrialization.
The purpose of the Street Vendor Transformation Initiative is to combine with the
rural value chain development programme so as to re-invigorate urban
manufacturing MSME value chains and accelerate industrialization as to
achieve the following:
1) To realize a paradigm shift characterized by a rapid MSME industrial
transformation in Zambia.
2) To foster industrial development that is led by targeted citizens.
3) By 2018, to create at least 65,000 industrial jobs (40,000 DIRECT jobs and
15,000 INDIRECT jobs)
4) To provide access to finance over the period 2014-2018 to at least 10,000
small and micro entrepreneurs in addition.
5) To cumulatively contribute at least USD 36 million to Zambia’s GDP over
the period 2014-2017, with annual value of generated goods and services
being at least USD 15 million by 2018.
8. 8
6) To cumulatively generate at least ZMW 42 million in VAT for the Treasury
over the period 2014-2018.
1.2 Objective of the manufacturing vendors enumeration
The objective of the assignment was to conduct a national enumeration
of manufacturing street vendors and creation of a comprehensive
database as a basis for design of an empowerment programme for
transformation of street vendors involved in various forms of
manufacturing in the country. This is consistent with the Zambian
Government’s Strategy on Industrialization and Job Creation which seeks
to facilitate the creation of one million jobs over the five year period to
2016.
1.3 Key Research questions
Investigation and data collection was targeted at two levels; the local
authorities and the street vendors.
Local Authorities
Data collection from the Local Authorities focused on the perceptions of local
councils’ towards manufacturing street vending including existing support systems for
vendors and how they relate or interact with these street vendors;
Street Vendors
Data collection from the Street Vendors focused on the following key aspects:
Street vendors' basic demographics.
Business logic and rationale.
Products, volumes of business and their types.
Capacity (skills training) levels.
Market information.
Access to business infrastructure including utilities.
Access to Business Development Support services.
9. 9
Describing the key characteristics of the targeted street vendors would help to
shape the programme implementation design and permit the Commission to
capture the status quo scenario as the basis for evaluating programme impact.
1.4 Underlying development hypothesis: the causal model
It’s the belief of Government that supporting the development of the SMEs’
manufacturing base in the country will contribute to increasing employment
and creating wealth in an inclusive manner thereby leading to more rapid
poverty reduction and socio-economic development in Zambia.
When achieved through competitive economic empowerment of historically
marginalized citizens, a transformation will result; leading to broad-based human
development in Zambia thereby contributing to Increased Broad based
Economic Empowerment of Zambian Citizens
10. 10
2.0 METHODOLOGY, DESIGN AND FRAMEWORK OF ANALYSIS
Scope and Geographical coverage
This exercise was not meant to be a sample survey but a full census2 targeting all
road-side vendors that are involved in all sorts of light manufacturing activities
such as automotive repairs, manufacturing of construction materials (crushed
stone, blocks, bricks, pavers, gates, tank stands, door frames, window frames,
grill doors, etc.) and many other items such as buckets, drinking and feeding
troughs for livestock, household furniture, slashes, hoes, spades, rakes, etc. The
enumeration targeted roadside vendors operating in all the ten provinces and
all 103 districts of the country.
Fig 2.1: Zambia’s Districts and Provinces in national geographical context
Source: Central Statistical Office (CSO) archives
2.1 Methodology and process flow
The following process was used for the main field work
1. The Research and Learning Manager of the Commission endeavored to
ensure that all provincial teams were oriented and were familiar with the
2
A Census is a sum of or total count of both those vendors on site and were interviewed and the absentee vendors
identified but not interviewed
11. 11
objectives of the exercise, the process flow and the data collection
instruments prior to commencement of field work;
2. Each field team comprised two people (the CEEC Provincial Coordinator
or PC and 1 provincial based official from the Street vendors Association).
Each team was led by the CEEC PC and used the Provincial Commission
vehicle for field work;
3. The PCs ensured that their respective Provincial Permanent Secretaries
were briefed and well informed about the planned initiative for
empowerment of street vendors and the objective of the enumeration.
Each PC ensured that the PS had received their letter or communication
from the PS Ministry of Commerce informing them of the exercise. The PC
also explain to the PS the background and rationale behind this initiative
and its expected benefits to the districts and the province;
4. Prior to departure for the field, each team ensured to carry with them
enough copies of the questionnaires and copies of the letters of
introduction for the District Commissioners and Town clerks/Council
Secretaries. On arrival in the districts, each team paid a courtesy call on
the District Commissioners and presented the letters of introduction. The
teams also explained the background and rationale behind this initiative,
the enumeration exercise and expected benefits to the districts and the
province;
5. From the DC’s office, each team proceeded to the Local Authority and
met with the Town clerk/Council Secretary or their representative during
which they conducted the interviews with each of the local authorities.
The local authorities responded to their specific interviews during which
they also gave indications on where the street vendors involved in
manufacturing operated from and could be found.
6. From the council, each field team proceeded to locate the street vendors
and conducted the interviews using pre-designed questionnaires hereto
attached.
7. Upon completion of the exercise, the respective CEEC Provincial
Coordinators then couriered all completed questionnaires with
accompanying summary reports to HQ for consolidation, processing and
analysis.
12. 12
2.2 Data cleaning, validation, capturing and analysis
Both Quantitative and Qualitative statistical methods is applied in data
processing, presentation of results and analysis using SPSS 21 statistical software
and anecdotal information gathered. On this basis, conclusions and
recommendations are made for policy and programme design.
Data editing was done before entry into SPSS. In doing so, physical checks were
done on data captured in the questionnaires and where necessary correction
of errors was done. The exercise further involved assigning of variable codes to
the variables contained in the questionnaire. Standard CSO district and
provincial codes of the Central Statistical Office (CSO) were used and
processed using SPSS software.
2.3 Limitations of the study
The study was jointly undertaken by the CEEC and USVEF. One major limitation
was that the study was conducted during the time of the presidential by-
elections and some vendors thought it was just a political campaign gimmick.
As a result some vendors declined to participate and stayed away. In addition
the study was undertaken during rainy season and some vendors were busy on
their farms and could therefore not be found on site thereby missing out on vital
information from such vendors especially those in rural districts. In mitigating this
limitation, the enumerators endeavored to identify and captured vendors that
were not present on their sites and are included in this enumeration. In dealing
with the political misconceptions, the Commission used the United Street
Vendors officials to sensitize their members prior to and during the enumeration.
The following section provides the summarized results and analysis by province.
13. 13
3.0 DATA ANALYSIS AND RESULTS BY PROVINCE
3.1 CENTRAL PROVINCE
Table 3.1 CENTRAL: Total count of vendors by District
District Name
Frequency Percent Valid Percent Cumulative
Percent
Valid
Chibombo 19 4.6 4.6 4.6
Chisamba 10 2.4 2.4 7.0
Chitambo 13 3.1 3.1 10.1
Itezhi-Tezhi 89 21.4 21.4 31.6
Kabwe 103 24.8 24.8 56.4
Kapiri Mposhi 28 6.7 6.7 63.1
Luano 15 3.6 3.6 66.7
Mkushi 52 12.5 12.5 79.3
Mumbwa 55 13.3 13.3 92.5
Ngabwe 15 3.6 3.6 96.1
Serenje 16 3.9 3.9 100.0
Total 415 100.0 100.0
Based on this enumeration, there are total of 415 street vendors operating
various types of light manufacturing businesses in Central Province.
3.1.1 Distribution of vendors by district
Of the 415 vendors in Central Province, 19 (5%) are in Chibombo district, 10 (2%)
in Chisamba district, 13 (3%) in Chitambo district, 89 (21%) in Itezhi-tezhi district,
103 (25%) in Kabwe district, 28 (7%) in Kapiri Mposhi district, 15 (4%) in Luano
district, 52 (12%) in Mkushi district, 55 (13%) in Mumbwa district, 15 (4%) in
Ngabwe district and 16 (4%) are in Serenje district.
14. 14
Above: CEEC and USVEF officials interacting with tin smith vendors in Itezhi-tezhi district
3.1.2 Distribution of vendors by type of vending
Of the 415 vendors in Central Province, 86 (21%) are engaged in metal
fabrication type of vending activities, 73 (17%) are in wood based or carpentry,
28 (7%) in auto/bicycle mechanics, 46 (11%) in block making, and 182 (44%) are
in various other types of businesses.
5%
2% 3%
21%
25%
7%
4%
12% 13%
4% 4%
0%
5%
10%
15%
20%
25%
30%
Fig 3.1: Percent share of vendors by district
% share of vendors
15. 15
3.1.3 Conclusion and recommendation on Central Province
The study has found out that in Central province, the top three highest districts
with significant volume of light manufacturing street vending activity are Kabwe
with a total count of 103 vendors (25%), Itezhi-tezhi with a count of 89 street
vendors (21%), and Mumbwa district with a count of 55 (13%). Using a threshold
of 35 workshops x 4 or 140 operators per each industrial yard, it is hereby being
recommended that, during phase 1 of the programme, three downsized yards
be located in Kabwe, Itezhi-tezhi and Mumbwa districts (one yard each) relative
to the number of operators.
0%
5%
10%
15%
20%
25%
30%
35%
40%
45%
50%
Fig 3.2: Percent share by type of vending
% share by type of
vending
16. 16
3.2 COPPERBELT PROVINCE
Table 3.2: Total count of vendors by District
District Name
Frequency Percent Valid Percent Cumulative
Percent
Valid
Chililabombwe 28 4.6 4.6 4.6
Chingola 142 23.5 23.5 28.2
Kalulushi 24 4.0 4.0 32.2
Kitwe 246 40.8 40.8 73.0
Luanshya 43 7.1 7.1 80.1
Lufwanyama 4 .7 .7 80.8
Mpongwe 7 1.2 1.2 81.9
Mufulira 43 7.1 7.1 89.1
Ndola 66 10.9 10.9 100.0
Total 603 100.0 100.0
According to this enumeration, there are a total of 603 street vendors operating
various types of light manufacturing businesses on the Copperbelt province.
3.2.1 Distribution of vendors by district
Of the 603 vendors in the Copperbelt province, 28 (5%) are in Chililabombwe
district, 142 (24%) in Chingola district, 246 (40%) in Kitwe district, 24(4%) in
Kalulushi district, 43 (7%) in Luanshya district, 4 (0.7) in Lufwanyama district, 7
(1.2%) in Mpongwe district, 43 (7%) in Mufulira district, and 66 (11%) are in Ndola
district.
17. 17
3.2.2 Distribution of vendors by type of vending
Frequency Percent Valid Percent Cumulative
Percent
Valid
5 .8 .8 .8
Metal fabrication 185 30.6 30.6 31.4
Wood work 233 38.6 38.6 70.0
Mechanics 47 7.7 7.7 77.7
Block making 84 13.9 13.9 91.6
Other 49 8.1 8.1 100.0
Total 603 100.0 100.0
Of the 603 vendors in Copperbelt province, 185 (31%) are engaged in metal
fabrication type of vending activities, 233 (39%) are in wood based or carpentry,
47 (8%) in auto mechanics, 84 (14%) in block making, and 49 (8%) are in various
other types of businesses.
5%
24%
41%
4%
7%
1% 1%
7%
11%
0%
5%
10%
15%
20%
25%
30%
35%
40%
45%
Fig 3.1: Percent share of vendors by district
% share of vendors
18. 18
3.2.3 Conclusion and recommendation on Copperbelt Province
This study has found out that in Copperbelt province, the top three districts with
significant volume of light manufacturing street vending activity are Kitwe with a
total count of 246 (41%), Chingola with a count of 142 street vendors (24%), and
Ndola with a total count of 66 vendors (11%) in order of priority. Using a threshold
of 75 workshops x 4 operators or 300 operators per each industrial yard for big
cities (Lusaka, Ndola and Kitwe) and 35 x 4 operators or 140 operators per each
yard for smaller towns, it is hereby being recommended that, during phase 1 of
the programme, downsized yards be located in Ndola, Kitwe and Chingola
districts. The design of the industrial yards in the province should be mostly
suited for metal fabrication, wood work and block making type of light industrial
activities.
0%
5%
10%
15%
20%
25%
30%
35%
40%
45%
Fig 3.2: Percent share by type of vending
% share by type of
vending
19. 19
3.3 EASTERN PROVINCE
Table 3.1: Total count of vendors by District
Frequency
Not
interviewed
Frequency
interviewed
District
total
Percent Valid Percent Cumulative
Percent
Valid
Chadiza 8 11 19 5.0 5.0 5.0
Chipata 15 74 89 25.0 25.0 30.0
Katete 19 22 41 12.0 12.0 42.0
Lundazi 27 32 59 16.0 16.0 58.0
Mambwe 9 13 22 6.0 6.0 64.0
Nyimba 5 12 17 5.0 5.0 69.0
Petauke 24 34 58 16.0 16.0 85.0
Sinda 15 16 31 9.0 9.0 94.0
Vubwi 12 8 20 6.0 6.0 100.0
Total 134 222 356 100.0 100.0
According to this enumeration, there are total of 356 street vendors operating
various types of light manufacturing businesses in Eastern province. Of these, 222
were interviewed and 134 were not on site and could therefore not be
interviewed.
3.3.1 Distribution of vendors by district
Of the 356 vendors in Eastern province, 19 (5%) are in Chadiza district, 89 (25%) in
Chipata district, 41 (12%) in Katete district, 59 (16%) in Lundazi district, 22 (6%) in
Mambwe district, 17 (5%) in Nyimba district, 58 (16%) in Petauke district, 31 (9%)
in Sinda district, and 20 (6%) are in Vubwi district.
20. 20
3.3.2 Distribution of vendors by type of vending
Of the 356 vendors in Eastern province, 166 (47%) are engaged in metal
fabrication type of vending activities, 131 (37%) are in wood based or carpentry,
10 (3%) in auto mechanics, 9 (2%) in block making, and 40 (11%) are in various
other types especially tin smith.
3.3.3 Conclusion and recommendation on Eastern Province
The study has found out that in Eastern province, the top two districts with
significant volume of light manufacturing street vending activity are Chipata
5%
25%
12%
16%
6% 5%
16%
9%
6%
0%
5%
10%
15%
20%
25%
30%
Fig 3.1: Percent share of vendors by district
% share of vendors
0%
5%
10%
15%
20%
25%
30%
35%
40%
45%
50%
Fig 3.2: Percent share by type of vending
% share by type of
vending
21. 21
with a total count of 89 vendors (25%) and Lundazi with a total count of 59
(16%). Using a threshold of 75 workshops x 4 operators or 300 operators per each
industrial yard for big cities (Lusaka, Ndola and Kitwe) and 35 x 4 operators or
140 operators per each yard for smaller towns, it is hereby being recommended
that, during phase 1 of the programme, downsized yards be located in Chipata
and Lundazi districts relative to their number of operators. The design of the
industrial yards in the province should be mostly suited for metal fabrication and
wood work type of light industrial activities.
22. 22
3.4 LUAPULA PROVINCE
Table 4.1: Total count of vendors by District
District Name
Frequency
not
interviewed
Frequency
interviewed
District
total
Percent Valid Percent Cumulative Percent
Valid
Chembe 9 4 13 5.1 5.1 5.1
Chienge 5 14 19 7.6 7.6 12.7
Chipili 0 3 3 1.1 1.1 13.8
Kawambwa 5 12 17 7.0 7.0 20.8
Lunga 33 35 68 27.0 27.0 47.8
Mansa 13 42 55 22.0 22.0 69.8
Milenge 2 4 6 2.4 2.4 72.2
Mwansabombwe 2 0 2 0.7 0.7 72.9
Mwense 3 9 12 5.0 5.0 77.9
Nchelenge 4 11 15 6.0 6.0 83.9
Samfya 9 32 41 16.0 16.0 100.0
Total 85 166 251 100.0 100.0
Based on this enumeration, there are a total of 251 street vendors operating
various types of light manufacturing businesses in Luapula province. Of these,
166 were interviewed and 85 were not on site and could therefore not be
interviewed.
3.4.1 Distribution of vendors by district
Of the 251 vendors in Luapula province, 13 (5%) are in Chembe district, 19 (8%)
in Chienge district, 3 (1%) in Chipili district, 17 (7%) in Kawambwa district, 68 (27%)
in Lunga district, 55 (22%) in Mansa district, 6 (2%) in Milenge district, 2 (0.7%) in
Mwansabombwe district, 12 (5%) in Mwense district, 15 (6%) in Nchelenge and
41 (16%) are in Samfya district.
23. 23
3.4.2 Distribution of vendors by type of vending
Of the 251 vendors in Luapula province, 23% are engaged in metal fabrication
type of vending activities, 18% are in wood based or carpentry, 0.3% in auto
mechanics, 1.5% in block making, and 21% are in various other types of vending
activities.
5%
8%
1%
7%
27%
22%
2% 1%
5% 6%
16%
0%
5%
10%
15%
20%
25%
30%
Fig 4.1: Percent share of vendors by district
% share of vendors
0%
5%
10%
15%
20%
25%
Fig 4.2: Percent share by type of vending
% share by type of
vending
24. 24
3.4.3 Conclusion and recommendation on Luapula Province
The study has found out that in Luapula province, the highest districts with
significant volume of light manufacturing street vending activity are Mansa with
a total count of 55 vendors (22%), Lunga with a count of 68 street vendors (27%),
and Samfya with a count of 41 (16%). Using a threshold of 75 workshops x 4
operators or 300 operators per each industrial yard for big cities (Lusaka, Ndola
and Kitwe) and 35 x 4 operators or 140 operators per each yard for smaller
towns, it is hereby being recommended that, during phase 1 of the programme,
2 downsized yards each be located in Mansa and Lunga districts relative to their
number of operators. However, Lunga district has potential to pose serious
infrastructural challenges in the implementation of an industrial cluster at the
moment.
Lunga District is an Island consisting of 5 main settlements which can only be
accessed through water channels and Luapula River because it is not on the
main water body; Lake Bangweulu. One must first cross Lake Bangweulu from
Samfya and then get into either the channels of Luapula River to reach the
Island. The furthest Settlement is Nsalushi which is closer to Mpika than Samfya;
the mother district. Therefore, there are no streets where one can possibly find
vendors. Nevertheless, there are uncoordinated economic activities oriented
towards manufacturing/production. The main production activities taking place
though not at commercial level due to lack market are basket weaving, making
of reed mats and pottery. Most of the local people produce the said items
mainly for home use and exchange some with harvested crops mainly rice
which they in turn sell. The raw materials; reeds are readily available and the
local skill are a great potential to lead to an establishment of a basket industry.
However, the major impediments are lack of electricity as well as high
transportation and communication costs. It takes about 3 hours from Samfya to
the first settlement. There is only MTN network on the Island which is quite
intermittent.
It is therefore being recommended that the second but reduced size industrial
yard be placed in Samfya district instead of Lunga due to the infrastructural
challenges mentioned.
25. 25
3.5 LUSAKA PROVINCE
Table 5.1: Total count of vendors by District
Frequency
not
interviewed
Frequency
interviewed
District
total
Percent Valid Percent Cumulative
Percent
Valid
Chilanga 11 17 28 3.5 3.5 3.5
Chirundu 11 21 32 4.0 4.0 7.5
Chongwe 38 87 125 16.0 16.0 23.5
Kafue 15 39 54 7.0 7.0 30.5
Luangwa 5 10 15 2.0 2.0 32.5
Lusaka 74 428 502 63.0 63.0 95.5
Rufunsa 9 27 36 4.4 4.4 99.9
Shibuyunji 9 0 9 1.1 1.1 100.0
Total 172 629 801 100.0 100.0
Based on this enumeration, there are total of 801 street vendors operating
various types of light manufacturing businesses in Lusaka province. Of these, 629
were interviewed and 172 were not on site and could therefore not be
interviewed.
3.5.1 Distribution of vendors by district
Of the 801 vendors in Lusaka province, 28 (3.5%) are in Chilanga district, 32 (4%)
in Chirundu district, 125 (16%) in Chongwe district, 54 (7%) in Kafue district, 15
(2%) in Luangwa district, 502 (63%) in Lusaka district, 36 (4%) in Rufunsa district,
and 9 (1.1%) are in Shibuyunji district.
26. 26
3.5.2 Distribution of vendors by type of vending
Of the 865 vendors in Lusaka province, 38% are engaged in metal fabrication
type of vending activities, 28% are in wood based or carpentry, 0.2% in auto
mechanics, 7% in block making, and 27% are in various other types of vending
activities.
4% 4%
16%
7%
2%
63%
4% 1%
0%
10%
20%
30%
40%
50%
60%
70%
Fig 5.1: Percent share of vendors by district
% share of vendors
0%
5%
10%
15%
20%
25%
30%
35%
40%
Fig 5.2: Percent share by type of vending
% share by type of
vending
27. 27
3.5.3 Conclusion and recommendation on Lusaka Province
The study has found out that in Lusaka province, the top two highest districts with
significant volume of light manufacturing street vending activity are Lusaka with
a total count of 502 vendors (63%) and Chongwe with a count of 125 street
vendors (16%). Using a threshold of 75 workshops x 4 operators or 300 operators
per each industrial yard for big cities (Lusaka, Ndola and Kitwe) and 35 x 4
operators or 140 operators per each yard for smaller towns, it is hereby being
recommended that, during phase 1 of the programme, full sized yards be
located in Lusaka (2 yards) and one downsized yard be located in Chongwe
district. The design of the industrial yards in the province should be mostly suited
for metal fabrication, wood work and various other types of light industrial
activities including stone crushing.
28. 28
3.6 MUCHINGA PROVINCE
Table 6.1: Total count of vendors by District
Frequency Percent Valid Percent Cumulative
Percent
Valid
Chama 65 8.9 8.9 8.9
Chinsali 137 18.7 18.7 27.5
Isoka 50 6.8 6.8 34.3
Mafinga 54 7.4 7.4 41.7
Mpika 160 21.8 21.8 63.5
Nakonde 218 29.7 29.7 93.2
Shiwang'andu 50 6.8 6.8 100.0
Total 734 100.0 100.0
Based on this enumeration, there are total of 734 street vendors operating
various types of light manufacturing businesses in Muchinga province.
3.6.1 Distribution of vendors by district
Of the 734 vendors in Muchinga Province, 65 (9%) are in Chama district, 137
(19%) in Chinsali district, 50 (7%) in Isoka district, 54 (7%) in Mafinga district, 160
(22%) in Mpika district, 218 (30%) in Nakonde district, and 50 (7%) are in
Shiwang’andu district.
9%
19%
7% 7%
22%
30%
7%
0%
5%
10%
15%
20%
25%
30%
35%
Fig 6.1: Percent share of vendors by district
% share of vendors
29. 29
3.6.2 Distribution of vendors by type of vending
Of the 734 vendors in Muchinga, 17% are engaged in metal fabrication type of
vending activities, 26% are in wood based or carpentry, 7% in auto mechanics,
184 (25%) in block making, and 26% are in various other types of vending
activities.
3.6.3 Conclusion and recommendation on Muchinga Province
The study has found out that in Muchinga province, the three highest districts
with significant volume of light manufacturing street vending activity are
Nakonde with a total count of 218 vendors (30%), Mpika district with a count of
160 street vendors (22%), and Chinsali with a count of 137 (19%). Using a
threshold of 75 workshops x 4 operators or 300 operators per each industrial yard
for big cities (Lusaka, Ndola and Kitwe) and 35 x 4 operators or 140 operators per
each yard for smaller towns, it is hereby being recommended that, during phase
1 of the programme, 3 full sized yards be located in Nakonde, Mpika and
Chinsali districts (one yard in each district). The design of the industrial yards in
the province should be mostly suited for metal fabrication, wood work, block
making and other type of light industrial activities.
0%
5%
10%
15%
20%
25%
30%
Fig 6.2: Percent share by type of vending
% share by type of
vending
30. 30
3.7 NORTHERN PROVINCE
Table 7.1: Total count of vendors by District
Frequency Percent Valid Percent Cumulative
Percent
Valid
Chilubi 29 5.4 5.4 5.4
Kaputa 103 19.3 19.3 24.8
Kasama 143 26.8 26.8 51.6
Luwingu 33 6.2 6.2 57.8
Mbala 27 5.1 5.1 62.9
Mporokoso 36 6.8 6.8 69.6
Mpulungu 24 4.5 4.5 74.1
Mungwi 46 8.6 8.6 82.7
Nsama 92 17.3 17.3 100.0
Total 533 100.0 100.0
Based on this enumeration, there are total of 533 street vendors operating
various types of light manufacturing businesses in Northern Province.
3.7.1 Distribution of vendors by district
Of the 533 vendors in Northern Province, 29 (5%) are in Chilubi district, 103 (19%)
in Kaputa district, 143 (27%) in Kasama district, 33 (6%) in Luwingu district, 27 (5%)
in Mbala district, 36 (7%) in Mporokoso, 24 (4%) in Mpulungu district, 46 (9%) in
Mungwi district, and 92 (17%) in Nsama district.
31. 31
3.7.2 Distribution of vendors by type of vending
Of the 533 vendors in Northern Province, 29% are engaged in metal fabrication
type of vending activities, (17%) are in wood based or carpentry, (8%) in auto
mechanics, 5% in block making, and 40% are in various other types of vending
activities.
3.7.3 Conclusion and recommendation on Northern Province
The study has found out that in Northern Province, the two highest districts with
significant volume of light manufacturing street vending activity are Kasama
with a total count of 143 vendors (27%), and Kaputa with a count of 103 street
vendors (19%). Using a threshold of 75 workshops x 4 operators or 300 operators
per each industrial yard for big cities (Lusaka, Ndola and Kitwe) and 35 x 4
operators or 140 operators per each yard for smaller towns, it is hereby being
27%
17%
9%
19%
5% 4% 5%
7% 6%
0%
5%
10%
15%
20%
25%
30%
Fig 7.1: Percent share of vendors by district
% share of vendors
0%
10%
20%
30%
40%
50%
Fig 7.2: Percent share by type of vending
% share by type of
vending
32. 32
recommended that, during phase 1 of the programme, 2 downsized yards be
located in Kasama and Kaputa districts. The design of the industrial yards in the
province should be mostly suited for metal fabrication, wood work and various
other types of light industrial activities.
33. 33
3.8 NORTH-WESTERN PROVINCE
Table 8.1: Total count of vendors by District
Frequency
not
interviewed
Frequency
interviewed
District
total
Percent Valid Percent Cumulative
Percent
Valid
Chavuma 2 24 26 8.0 8.0 8.0
Ikelenge 6 8 14 4.3 4.3 12.3
Kabompo 8 20 28 9.0 9.0 18.5
Kasempa 12 8 20 6.2 6.2 26.5
Manyinga 14 11 25 8.0 8.0 34.5
Mufumbwe 5 29 34 10.5 10.5 45.0
Mwinilunga 5 33 38 12.0 12.0 57.0
Solwezi 27 82 109 34.0 34.0 91.0
Zambezi 9 21 30 9.0 9.0 100.0
Total 88 236 324 100.0 100.0
Based on this enumeration, there are total of 324 street vendors operating
various types of light manufacturing businesses in Northwestern province. Of
these, 236 were interviewed and 88 were not on site and could therefore not be
interviewed.
3.8.1 Distribution of vendors by district
Of the 324 vendors in North-western province, 26 (8%) are in Chavuma district,
14 (4%) in Ikelenge district, 28 (9%) in Kabompo district, 20 (6%) in Kasempa
district, 25 (8%) in Manyinga district, 34 (11%) in Mufumbwe district, 38 (12%) in
Mwinilunga district, 109 (34%) in Solwezi district, and 30 (9%) are in Zambezi
district.
34. 34
3.8.2 Distribution of vendors by type of vending
Of the 324 vendors in North-Western province, (42%) are engaged in metal
fabrication type of vending activities, 34% are in wood based or carpentry, 2% in
auto mechanics, 0.8% in block making, and 20% are in various other types of
vending activities.
8%
4%
9%
6%
8%
11% 12%
34%
9%
0%
5%
10%
15%
20%
25%
30%
35%
40%
Fig 8.1: Percent share of vendors by district
% share of vendors
0%
10%
20%
30%
40%
50%
Fig 8.2: Percent share by type of vending
% share by type of
vending
35. 35
3.8.3 Conclusion and recommendation on Northwestern Province
The study has found out that in Northwestern province, the two highest districts
with significant volume of light manufacturing street vending activity are Solwezi
with a total count of 109 vendors (34%), and Mwinilunga with a count of 38
street vendors (12%). Using a threshold of 75 workshops x 4 operators or 300
operators per each industrial yard for big cities (Lusaka, Ndola and Kitwe) and
35 x 4 operators or 140 operators per each yard for smaller towns, it is hereby
being recommended that, during phase 1 of the programme, downsized yards
be located in Solwezi and Mwinilunga districts relative to their number of
operators. The design of the industrial yards in the province should be mostly
suited for metal fabrication, wood work and other type of light industrial
activities.
36. 36
3.9 SOUTHERN PROVINCE
Table 9.1: Total count of vendors by District
Frequency
not
interviewed
Frequency
interviewed
District
total
Percent Valid Percent Cumulative
Percent
Valid
Chikankata 2 13 15 4.0 4.0 4.0
Choma 0 37 37 11.4 11.4 15.4
Gwembe 2 3 5 .9 .9 16.3
Kalomo 0 19 19 5.8 5.8 22.2
Kazungula 2 4 6 1.2 1.2 23.4
Livingstone 0 112 112 34.5 34.5 57.8
Mazabuka 0 59 59 18.2 18.2 76.0
Monze 4 19 23 5.8 5.8 81.8
Namwala 0 18 18 5.5 5.5 87.4
Pemba 1 6 7 1.8 1.8 89.2
Siavonga 0 11 11 3.4 3.4 92.6
Sinazongwe 3 14 17 4.3 4.3 96.9
Zimba 0 10 10 3.1 3.1 100.0
Total 14 325 339 100.0 100.0
Based on this enumeration, there are total of 339 street vendors operating
various types of light manufacturing businesses in Southern province. Of these,
325 were interviewed and 14 were not on site and could therefore not be
interviewed.
3.9.1 Distribution of vendors by district
Of the 339 vendors in Southern Province, 15 (4%) are in Chikankata district, 37
(11%) in Choma district, 5 (1%) in Gwembe district, 19 (6%) in Kalomo district, 6
(1%) in Kazungula district, 112 (34%) in Livingstone district, 59 (18%) in Mazabuka
district, 23 (6%) in Monze district, and 18 (6%) in Namwala district, 7 (2%) in
Pemba district, 11 (3%) in Siavonga district, 17 (4%) in Sinazongwe district and 10
(3%) are in Zimba district.
37. 37
3.9.2 Distribution of vendors by type of vending
Of the 339 vendors in Southern Province, 38% are engaged in metal fabrication
type of vending activities, 32% are in wood based or carpentry, 7% in auto
mechanics, 1% in block making, and 19% are in various other types of vending
activities.
3.9.3 Conclusion and recommendation on Southern Province
The study has found out that in Southern province, the three highest districts with
significant volume of light manufacturing street vending activity are Livingstone
with a total count of 112 vendors (34%), Mazabuka district with a count of 59
street vendors (18%), and Choma with a count of 37 (11%). Using a threshold of
4%
11%
1%
6%
1%
34%
18%
6% 6%
2% 3% 4% 3%
0%
5%
10%
15%
20%
25%
30%
35%
40%
Fig 9.1: Percent share of vendors by district
% share of vendors
0%
5%
10%
15%
20%
25%
30%
35%
40%
Fig 9.2: Percent share by type of vending
% share by type of
vending
38. 38
75 workshops x 4 operators or 300 operators per each industrial yard for big cities
(Lusaka, Ndola and Kitwe) and 35 x 4 operators or 140 operators per each yard
for smaller towns, it is hereby being recommended that, during phase 1 of the
programme, 3 downsized yards be located one each in Livingstone, Mazabuka
and Choma districts relative to their number of operators. The design of the
industrial yards in the province should be mostly suited for metal fabrication,
wood work and other type of light industrial activities.
39. 39
3.10 WESTERN PROVINCE
Table 10.1: Total count of vendors by District
District Name
Frequency
not
interviewed
Frequency
interviewed
District
total
Percent Valid Percent Cumulative
Percent
Valid
Kalabo 15 18 33 6.0 6.0 6.0
Kaoma 0 37 37 12.4 12.4 18.4
Limulunga 3 6 9 2.0 2.0 20.4
Luampa 0 5 5 1.7 1.7 22.1
Lukulu 2 27 29 9.0 9.0 31.1
Mongu 7 82 89 27.4 27.4 58.5
Mulobezi 0 4 4 1.3 1.3 59.9
Mwandi 0 7 7 2.3 2.3 62.2
Nalolo 2 2 4 .7 .7 62.9
Nkeyema 0 8 8 2.7 2.7 65.6
Senanga 9 48 57 16.1 16.1 81.6
Sesheke 1 38 39 12.7 12.7 94.3
Shangombo 0 10 10 3.3 3.3 97.7
Sikongo 5 2 7 .7 .7 98.3
Sioma 5 5 10 1.7 1.7 100.0
Total 49 299 348 100.0 100.0
Based on this enumeration, there are total of 348 street vendors operating
various types of light manufacturing businesses in Western province. Of these,
299 were interviewed and 49 were not on site and could therefore not be
interviewed.
3.10.1 Distribution of vendors by district
Of the 348 vendors in Western Province, 33 (6%) are in Kalabo district, 37 (12%) in
Kaoma district, 9 (2%) in Limulunga district, 5 (2%) in Luampa district, 29 (9%) in
Lukulu district, 89 (27%) in Mongu district, 4 (1%) in Mulobezi district, 7 (2%) in
Mwandi district, 4 (1%) in Nalolo district, 8 (3%) in Nkeyema district, 57 (16%) in
40. 40
Senanga district, 39 (13%) in Sesheke district, 10 (3%) are in Shangombo district, 7
(1%) in Sikongo, and 10 (2%) are in Sioma district .
3.10.2 Distribution of vendors by type of vending
Of the 348 vendors in Western Province, 26% are engaged in metal fabrication
type of vending activities, 49% are in wood based or carpentry, 7% in auto
mechanics, 7% in block making, and 10% are in various other types of vending
activities.
6%
12%
2% 2%
9%
0%
27%
1% 1% 1%
3%
16%
13%
3%
1% 2%
0%
5%
10%
15%
20%
25%
30%
Kalabo
Kaoma
Limulunga
Luampa
Lukulu
Mitete
Mongu
Mulobezi
Mwandi
Nalolo
Nkeyema
Senanga
Sesheke
Shangombo
Sikongo
Sioma
Fig 10.1: Percent share of vendors by district
% share of vendors
0%
10%
20%
30%
40%
50%
60%
Fig 10.2: Percent share by type of vending
% share by type of
vending
41. 41
3.10.3 Conclusion and recommendation on Western Province
The study has found out that in Western Province, the two highest districts with
significant volume of light manufacturing street vending activity are Mongu with
a total count of 89 vendors (27%), and Senanga district with a count of 57 street
vendors (16%). Using a threshold of 75 workshops x 4 operators or 300 operators
per each industrial yard for big cities (Lusaka, Ndola and Kitwe) and 35 x 4
operators or 140 operators per each yard for smaller towns, it is hereby being
recommended that, during phase 1 of the programme, 2 downsized yards each
be located in Mongu and Senanga districts relative to their number of
operators. The design of the industrial yards in Western Province should be
mostly suited for metal fabrication and wood work type of light industrial
activities.
Above: Modified bender used for making door frames in Nkeyema District
Above: Simple tools used in carpentry during the production of doors, chairs and beds in
Luampa District
42. 42
Above: Burnt red bricks using fire wood, in Lukulu, as this is a likely cause of deforestation with
industrial yards in place SMEs could be using electrical furnace to produce red bricks
Wood is used in the production of badge boats in Kalabo District used for transportation on the
Zambezi River
43. 43
4.0 NATIONAL LEVEL TOTAL COUNT
Table 4.1 National total count of vendors by province
Frequency not
interviewed
Frequency
interviewed
Province total Percent Valid
Percent
Cumulative
Percent
Valid
Central 0 415 415 8.8 8.8 8.8
Copperbelt 0 603 603 12.8 12.8 21.6
Eastern 134 222 356 7.6 7.6 29.2
Luapula 85 166 251 5.3 5.3 34.5
Lusaka 172 629 801 17.0 17.0 51.5
Muchinga 0 734 734 15.6 15.6 67.1
Northern 0 533 533 11.3 11.3 78.4
Northwestern 88 236 324 6.9 6.9 85.3
Southern 14 325 339 7.2 7.2 92.5
Western 49 299 348 7.4 7.4 100.0
Total 542 4162 4704 100.0 100.0
Based on this enumeration, there are total of 4,704 street vendors operating
various types of light manufacturing businesses in Zambia. Of these, 4,162 were
interviewed and 542 were not on site and could therefore not be interviewed.
4.1 Distribution of vendors by Province
Of the 4,704 vendors in Zambia, 415 (8.8%) are in Central Province, 603 (7.4%) in
Copperbelt, 356 (7.6%) in Eastern, 251 (5.3%) in Luapula, 801 (17%) in Lusaka, 734
(15.6%) in Muchinga, 533 (11.3%) in Northern, 324 (6.9%) in Northwestern, 339
(7.2%) in Southern, and 348 (7.4%) are in Western province
44. 44
4.2 National distribution of vendors by type of vending
Of the 4,704 vendors in Zambia, 30% are engaged in metal fabrication type of
vending activities, 29% are in wood based or carpentry, 5% in auto mechanics,
10% in block making, and 24% are in various other types of vending activities.
9%
13%
8%
5%
17%
16%
11%
7% 7% 7%
0%
2%
4%
6%
8%
10%
12%
14%
16%
18%
Fig 4.1: Percent share of vendors by Province
% share of vendors
0%
5%
10%
15%
20%
25%
30%
35%
Fig 4.2: National Percent share by type of vending
% share by type of
vending
45. 45
4.3 Conclusion and recommendation on the allocation of industrial yards by
district by province
The study has found out that in Zambia, the three provinces with highest volume
of light manufacturing street vending activity are Lusaka with a total count of
801 vendors (17%), Muchinga with a count of 734 street vendors (15.6%), and
Copperbelt province with a count of 603 (7.4%). Using a threshold of 75
workshops x 4 operators or 300 operators per each industrial yard for big cities
(Lusaka, Ndola and Kitwe) and 35 x 4 operators or 140 operators per each yard
for smaller towns, it is hereby being recommended that, during phase 1 of the
programme, the 25 proposed industrial yards be distributed as shown in the
table 4.2. While districts meeting the minimum threshold number of operators are
being recommended for full sized yards, those falling short of the threshold are
being recommended for downsized industrial yards. The design of the industrial
yards in Zambia should be mostly suited for metal fabrication, wood work and
various other types of light industrial activities based on the predominant type of
vending.
Table 4.2: Proposed Provincial allocation of industrial yards in phase 1
Province No. Districts
Central 03 1 Kabwe + 1 Itezhi-tezhi + 1 Mumbwa
Copperbelt 03 1 Kitwe + 1 Ndola + 1 Chingola
Eastern 02 1 Chipata + 1 Lundazi
Luapula 02 1 Mansa + 1 Samfya
Lusaka 03 2 Lusaka + 1 Chongwe
Muchinga 03 1 Chinsali + 1 Mpika + 1 Nakonde
Northern 02 1 Kasama + 1 Kaputa
Northwestern 02 1 Solwezi + 1 Mwinilunga
Southern 03 1 Livingstone + 1 Mazabuka + 1 Choma
Western 02 1 Mongu + 1 Senanga
TOTAL 25 In BOLD is the Provincial town
Key observations/recommendations
o It was also observed that most of the SMEs interviewed were not falling in the
category of targeted citizen (Women, Youths and Disabled). Mainly youths and
women were involved in the trading sector as this was perceived as easy and a
quick money spin.
o It was also noted that most of the land available for industrial clusters was vested
in traditional areas especially in the old districts however new districts have land
for such industrial cluster facilities.
46. 46
o Most new districts were not yet connected to the national grid for electricity
supply and most of the SMEs interviewed depended on the use of other forms of
power for their production process.
o There is need for the Commission to engage traditional leaders to advocate for
women participation in the light manufacturing sector in order to break this
historical cultural barrier. In addition, mobile video shows should be documented
to show successful women who are participating in light manufacturing across
the nation as this will entice rural women to get involved in the industrial cluster
initiatives.
o The Commission needs to also engage youths and women that have graduated
from TEVET institutions as most of them were not actively practicing their trade
skills due to lack of capital to establish workshops. In addition, the Commission
should engage TEVETA to provide a database for all the youths and women that
have been trained if we are to see an improved picture of youths and women
involved in the industrial clusters.
o The Local Authorities and Traditional Royal Establishments should also be
engaged to release land for industrial cluster facilities through the partnership
with local authorities in areas were the availability of land might prove a big
challenge.
o Districts not yet connected to the electricity national grid should be lowly
prioritized in the initial phase of the programme.
o The Commission should engage the respective local authorities and request
them to open and maintain up to date registers of street vendors in their
respective districts. Further, the Commission should quickly make formal requests
to the local Authorities for suitable land space for the clusters so that they can
start looking for best sites.
48. 48
APP 5.1 STREET VENDOR’S QUESTIONNAIRE
My/our name(s) is/are
__________________________________________________________
I/We represent the Citizens Economic Empowerment Commission (CEEC) and the United Street
Vendors Foundation (USVF). We have been referred to you as one of the respondents identified
to support the government initiative to do a baseline survey and profile street vendors involved in
various forms of light manufacturing. I/We would like to go through a couple of questions with
you in this effort in an open, voluntary and participatory approach. The information you provide
will be treated with highest confidentiality. Where we record your name and personal details it is
only with your consent and willingness to be included in the national database which the
Commission will be preparing. Your honest and detailed answers will be helpful in informing the
survey about the recommendations that can be made in order to alleviate some of the challenges
that exist in your work as street vendors in manufacturing. Your participation is voluntary. You
are free to withdraw at any stage of the interview and you can tell me if there are any questions
that you do not want to answer so we can skip them. However we look forward to your co-
operation since your views are important.
May I start with the interview: Yes: No:
49. 49
1. District: Province:
2. Business Name:
3. First name
4. Surname
5. Gender Male : Female:
6. Date of birth Date month year
7. National ID # (NRC #)
8. Category of targeted citizen Women: Youths: Disabled: Other:
9. Highest level of education None: Primary: Secondary: Tertiary
10. Are you the head of your Household? Yes No
11. Street or locality of street vending
12. Primary source of monthly income: Current business: Other business(es): Formal
employment: (specify)
13. Business Telephone #
14. Mobile #
15. Email Address
16. Postal or Physical Address (Business)
17. Main line or nature of business: Metal fabrication: Wood work: Mechanics: Block
making: Other: If other please specify
18. Where do you source your raw materials and at what prices?
19. Main products and prices ranked by monthly sales volumes
20. How can you improve the quality of your products and profitability?
21. Who are your major clients: General public: Government: NGOs: Other:
22. Business skills possessed:
23. How acquired? Formal training: Through experience: Other (specify)
24. Additional skills required:
50. 50
25. Where do you get your equipment from?
26. Is the equipment borrowed or rented?
27. Which equipment would you rather use commonly with others for a fee rather than have a loan on your
own?
28. Have you ever accessed loans for your business? Yes No
If so from where, how much and how much repaid so far?
29. Would you need a loan from the CEEC? Yes: No:
If yes, for what purpose?
30. Since when have you been in this type of
manufacturing business?
Date month year
31. What has been your motivation for
operating from current location?
32. What are your difficulties operating from
this location?
33. Will you be willing to rent a workshop in
the new industrial yard?
Yes: No:
Explain your answer:
If yes, how soon can you move Immediately facility is available:
Dependent on market assessment:
Not sure:
34. Where do you think the proposed industrial
yard should be located?
Give reasons for your proposed site
35. Will you need
Water
Electricity
Bank : or ATM:
For what?
36. How do you relate with the local authority? No relationship:
Through paying levies:
Through business association:
Other (specify)