Beltline office calgary ab - 2015 taxation 2014 assessment
•
0 likes•122 views

This document summarizes an analysis of property tax assessments for 136 office buildings in Calgary's Beltline area from 2008-2015. It finds that from 2014-2015: - Assessments for AA, A, B, and C office classes increased 27.6% on average, with the largest increase being 46% for AA class buildings. - Individual building class tax increases ranged from 11.5% for B class to 46% for AA class. - The total non-residential assessment base grew 7% city-wide, compared to a 27.7% increase for Beltline office properties.
Recommended

Recommended
More Related Content
What's hot
Similar to Beltline office calgary ab - 2015 taxation 2014 assessment
Similar to Beltline office calgary ab - 2015 taxation 2014 assessment (20)
Beltline office calgary ab - 2015 taxation 2014 assessment
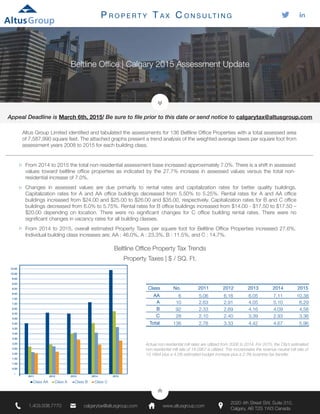
- 1. Appeal Deadline is March 6th, 2015! Be sure to file prior to this date or send notice to calgarytax@altusgroup.com Beltline Office | Calgary 2015 Assessment Update P R O P E R T Y T A X C O N S U LT I N G 1.403.508.7770 calgarytax@altusgroup.com www.altusgroup.com 2020 4th Street SW, Suite 310, Calgary, AB T2S 1W3 Canada Altus Group Limited identified and tabulated the assessments for 136 Beltline Office Properties with a total assessed area of 7,587,990 square feet. The attached graphs present a trend analysis of the weighted average taxes per square foot from assessment years 2008 to 2015 for each building class. Changes in assessed values are due primarily to rental rates and capitalization rates for better quality buildings. Capitalization rates for A and AA office buildings decreased from 5.50% to 5.25%. Rental rates for A and AA office buildings increased from $24.00 and $25.00 to $26.00 and $35.00, respectively. Capitalization rates for B and C office buildings decreased from 6.0% to 5.75%. Rental rates for B office buildings increased from $14.00 ‐ $17.50 to $17.50 – $20.00 depending on location. There were no significant changes for C office building rental rates. There were no significant changes in vacancy rates for all building classes. From 2014 to 2015, overall estimated Property Taxes per square foot for Beltline Office Properties increased 27.6%. Individual building class increases are; AA : 46.0%, A : 23.3%, B : 11.5%, and C : 14.7%. From 2014 to 2015 the total non‐residential assessment base increased approximately 7.0%. There is a shift in assessed values toward beltline office properties as indicated by the 27.7% increase in assessed values versus the total non‐ residential increase of 7.0%. 6.00 5.50 5.00 4.50 4.00 3.50 3.00 2.50 2.00 1.50 1.00 0.50 2011 2012 2013 2014 2015 10.00 9.50 9.00 8.50 8.00 7.50 7.00 6.50 10.50 Class AA Class A Class B Class C 2015 10.38 6.29 4.56 3.36 5.96 2014 7.11 5.10 4.09 2.93 4.67 2013 6.05 4.05 4.16 3.39 4.42 2012 6.16 2.91 2.69 2.40 3.33 2011 5.06 2.63 2.33 2.10 2.78 No. 6 10 92 28 136 Class AA A B C Total Actual non‐residential mill rates are utilized from 2008 to 2014. For 2015, the City’s estimated non‐residential mill rate of 14.0967 is utilized. This incorporates the revenue neutral mill rate of 13.1864 plus a 4.5% estimated budget increase plus a 2.3% business tax transfer. Beltline Office Property Tax Trends Property Taxes | $ / SQ. Ft.