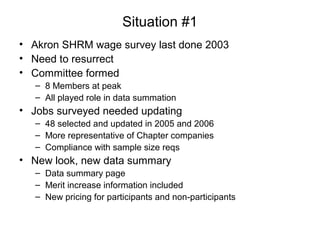
SlideShare a Scribd company logo
1 of 14
Situation #1
• Akron SHRM wage survey last done 2003
• Need to resurrect
• Committee formed
– 8 Members at peak
– All played role in data summation
• Jobs surveyed needed updating
– 48 selected and updated in 2005 and 2006
– More representative of Chapter companies
– Compliance with sample size reqs
• New look, new data summary
– Data summary page
– Merit increase information included
– New pricing for participants and non-participants
Initial raw data input
Keyed in manually by Committee Member, others did data summary
Status Union Staff Size Average Minimum Maximum Incentive
Exempt Union 1 45,100.00$ 43,400.00$ 65,000.00$ 45,100.00$ 3.50%
Exempt Union 1 51,513.00$ 35,040.00$ 54,720.00$ 51,513.00$
Exempt Non-union 5.6 47,112.00$ 39,104.00$ 49,920.00$ 263,827.20$
Exempt Non-union 3 48,963.20$ 38,708.80$ 48,963.20$ 146,889.60$
Exempt Non-union 1 53,000.00$ 40,000.00$ 64,000.00$ 53,000.00$
Exempt Non-union 4 41,200.00$ 34,100.00$ 56,400.00$ 164,800.00$ 10.00%
Exempt Non-union 24 46,000.00$ 38,000.00$ 56,000.00$ 1,104,000.00$ 2.00%
Exempt Non-union 1 45,600.00$ 38,295.00$ 53,649.00$ 45,600.00$
Exempt Non-union 16 44,000.00$ 38,000.00$ 65,000.00$ 704,000.00$
Exempt Non-union 3 36,819.00$ 32,625.00$ 65,000.00$ 110,457.00$
Exempt Non-union 2 46,500.00$ 38,800.00$ 64,800.00$ 93,000.00$ 6.00%
Exempt Non-union 1 45,000.00$ 45,000.00$ 5.00%
Exempt Non-union 6 39,300.00$ 34,650.00$ 57,790.00$ 235,800.00$ 4.00%
Exempt Non-union 9 40,800.00$ 36,129.00$ 63,876.00$ 367,200.00$
Exempt Non-union 1 43,000.00$ 43,000.00$ 3,473,186.80$
# of Orgs
Reporting # FTEs Weighted Ave Average 25th Percentile Median 75th Percentile # of Orgs Ave Minimum Ave Midpoint Ave Maximum
% of Orgs
Paying % of Salary
Non-Exempt 0 0
Exempt 15 78.6 44,188$ 44,927$ 42,100$ 45,100$ 46,806$ 13 37,450$ 48,153$ 58,855$ 40% 5.1%
Overall 15 78.6 44,188$ 44,927$ 42,100$ 45,100$ 46,806$ 13 37,450$ 48,153$ 58,855$ 40% 5.1%
FINANCIAL
This is a staff position that performs the full range of duties in an Accounting function. Applies accounting principles to assist in design, installation and maintenance of general accounting systems to provide records of assets, liabilities, and financial
transactions. Reconciles and adjusts various general ledger accounts and/or bank statements. Compiles, consolidates, and analyzes accounting and finance information for the production of financial statements and reports. May function in any of the
various Accounting functions such as Cost or Operations Accounting, Tax or Auditing.
Accountant
INCENTIVESREPORTED WAGE RATES WAGE RANGE
Pre-publish audit format
48 jobs published with adequate sample size –
Members doing data summary swapped to do audits
# of Orgs
Reporting # FTEs Weighted Ave Average 25th Percentile Median 75th Percentile # of Orgs Ave Minimum Ave Midpoint Ave Maximum
% of Orgs
Paying % of Salary
Non-Exempt 0 0
Exempt 15 78.6 44,188$ 44,927$ 42,100$ 45,100$ 46,806$ 13 37,450$ 48,153$ 58,855$ 40% 5.1%
Overall 15 78.6 44,188$ 44,927$ 42,100$ 45,100$ 46,806$ 13 37,450$ 48,153$ 58,855$ 40% 5.1%
# of Orgs
Reporting # FTEs Weighted Ave Average 25th Percentile Median 75th Percentile # of Orgs Ave Minimum Ave Midpoint Ave Maximum
% of Orgs
Paying % of Salary
Non-Exempt 6 20.5 28,622$ 30,279$ 27,632$ 28,381$ 31,858$ 4 25,592$ 32,046$ 38,500$
Exempt 5 11 29,351$ 29,172$ 26,000$ 28,000$ 33,000$ 4 24,443$ 29,714$ 34,986$
Overall 11 31.5 28,877$ 29,776$ 26,855$ 28,329$ 33,000$ 8 25,017$ 30,880$ 36,743$ 36% 5.4%
Status Union Staff Size Average Minimum Maximum Incentive
# of Orgs
Reporting # FTEs Weighted Ave Average 25th Percentile Median 75th Percentile # of Orgs Ave Minimum Ave Midpoint Ave Maximum
% of Orgs
Paying % of Salary
Non-Exempt 7 14 81,556$ 70,112$ 59,741$ 75,000$ 78,150$ 6 65,520$ 78,256$ 90,992$ 57% 12.1%
Exempt 9 21 81,537$ 70,416$ 57,000$ 69,327$ 90,000$ 9 54,031$ 63,171$ 72,311$
Overall 16 35 81,545$ 68,283$ 56,913$ 70,897$ 82,500$ 9 58,134$ 68,558$ 78,983$ 38% 10.4%
# of Orgs
Reporting # FTEs Weighted Ave Average 25th Percentile Median 75th Percentile # of Orgs Ave Minimum Ave Midpoint Ave Maximum
% of Orgs
Paying % of Salary
Non-Exempt 16 63.4 29,079$ 29,931$ 26,700$ 29,141$ 33,863$ 12 26,238$ 31,464$ 36,690$ 31% 5.5%
Exempt Insufficient Data
Overall 17 65.4 29,087$ 29,896$ 27,000$ 29,338$ 33,592$ 13 26,260$ 31,464$ 36,668$ 29% 5.5%
WAGE RANGE INCENTIVES
INCENTIVES
INCENTIVES
Manages professional level accounting operations and oversees those who estimate expected expenditures and submits to management. Analyzes records of present and past operations, trends and costs, estimated and realized revenues,
administrative commitments, and obligations incurred. Certifies accuracy of operating and financial reports. Develops, installs, and maintains budgeting systems which provide control of expenditures made to carry out activities. Advises upper
management regarding matters such as effective use of resources and methods for preventing capital being frozen.
Accounting Manager
Compiles and prepares customer charges, using purchase orders, shipping manifests, sales tickets, charge slips, etc. Calculates and prepares invoices and bills. Verifies and issues credit memos for returned goods. Posts transactions to accounting
records.
Billing/Accounts Payable Clerk
REPORTED WAGE RATES WAGE RANGE
REPORTED WAGE RATES
FINANCIAL
This is a staff position that performs the full range of duties in an Accounting function. Applies accounting principles to assist in design, installation and maintenance of general accounting systems to provide records of assets, liabilities, and financial
transactions. Reconciles and adjusts various general ledger accounts and/or bank statements. Compiles, consolidates, and analyzes accounting and finance information for the production of financial statements and reports. May function in any of the
various Accounting functions such as Cost or Operations Accounting, Tax or Auditing.
In accordance with standard procedures, performs the full range of basic bookkeeping and clerical accounting duties, electronically or manually, such as reconciling words and numbers, making journal entries, balancing ledgers, tracing account
transactions, making basic mathematical and percentage calculations, and preparing monthly statements.
Accounting Clerk
Accountant
INCENTIVESREPORTED WAGE RATES WAGE RANGE
Sample?
• 2006 Paper copy of Akron SHRM Area
wage survey brought along for viewing
• Also have 2005 version on memory stick
• Pricing was initially $40 for participants,
$80 for non-
Situation #2
• Hourly pay ranges available in 2008
– 1 size fits all
– Midpoint calcs off
– Need to be refreshed/checked
• What about geographical differences?
– 152 locations
– Over 20 states
– 5 jobs
Build initial structure
Position
NDX Prop
Grade
Min Sal Min Hrly Mid Sal Mid Hrly Max Sal Max Hrly
Spread Midpoint Chg Bonus
Warehouse Employee L1 20,800 10.00 25,270 11.90 29,740 14.30 42.98% Branch plan
Truck Driver L2 22,040 10.60 26,930 12.95 31,820 15.30 44.37% 6.6% Branch plan
Customer Service Rep L3 23,600 11.35 29,110 14.00 34,620 16.64 46.69% 8.1% Branch plan
Truck Driver CDL L4 24,960 12.00 31,200 15.00 37,440 18.00 50.00% 7.2% Branch plan
Warehouse Leader L5 27,560 13.25 33,800 16.25 40,040 19.25 45.28% 8.3% Branch plan
Warehouse Employee M1 21,320 10.25 26,360 12.67 31,400 15.10 47.28% Branch plan
Truck Driver M2 24,000 11.54 29,470 14.17 34,940 16.80 45.58% 11.8% Branch plan
Customer Service Rep M3 26,000 12.50 32,000 15.38 38,000 18.27 46.15% 8.6% Branch plan
Truck Driver CDL M4 27,970 13.45 34,470 16.57 40,970 19.70 46.48% 7.7% Branch plan
Warehouse Leader M5 30,050 14.45 37,540 18.05 45,030 21.65 49.85% 8.9% Branch plan
Warehouse Employee H1 23,500 11.30 28,500 13.70 33,500 16.11 42.55% Branch plan
Truck Driver H2 25,800 12.40 31,880 15.33 37,960 18.25 47.13% 11.9% Branch plan
Customer Service Rep H3 28,000 13.46 34,435 16.56 40,870 19.65 45.96% 8.0% Branch plan
Truck Driver CDL H4 31,200 15.00 38,375 18.45 45,550 21.90 45.99% 11.4% Branch plan
Warehouse Leader H5 32,960 15.85 40,865 19.65 48,770 23.45 47.97% 6.5% Branch plan
Geographical groupings
NDX Position
NDX Prop
Grade Min Sal Hrly Mid Sal Hrly Max Sal Hrly Spread Midpoint Chg Bonus
Warehouse Employee L1 20,800 10.00 25,270 12.15 29,740 14.30 42.98% Branch plan
Truck Driver L2 22,040 10.60 26,930 12.95 31,820 15.30 44.37% 6.6% Branch plan
Customer Service Rep L3 23,600 11.35 29,110 14.00 34,620 16.64 46.69% 8.1% Branch plan
Truck Driver CDL L4 24,960 12.00 31,200 15.00 37,440 18.00 50.00% 7.2% Branch plan
Warehouse Leader L5 27,560 13.25 33,800 16.25 40,040 19.25 45.28% 8.3% Branch plan
NDX Position
NDX Prop
Grade Min Sal Hrly Mid Sal Hrly Max Sal Hrly Spread Midpoint Chg Bonus
Warehouse Employee M1 21,320 10.25 26,360 12.67 31,400 15.10 47.28% Branch plan
Truck Driver M2 24,000 11.54 29,470 14.17 34,940 16.80 45.58% 11.8% Branch plan
Customer Service Rep M3 26,000 12.50 32,000 15.38 38,000 18.27 46.15% 8.6% Branch plan
Truck Driver CDL M4 27,970 13.45 34,470 16.57 40,970 19.70 46.48% 7.7% Branch plan
Warehouse Leader M5 30,050 14.45 37,540 18.05 45,030 21.65 49.85% 8.9% Branch plan
NDX Position
NDX Prop
Grade Min Sal Hrly Mid Sal Hrly Max Sal Hrly Spread Midpoint Chg Bonus
Warehouse Employee H1 23,500 11.30 28,500 13.70 33,500 16.11 42.55% Branch plan
Truck Driver H2 25,800 12.40 31,880 15.33 37,960 18.25 47.13% 11.9% Branch plan
Customer Service Rep H3 28,000 13.46 34,435 16.56 40,870 19.65 45.96% 8.0% Branch plan
Truck Driver CDL H4 31,200 15.00 38,375 18.45 45,550 21.90 45.99% 11.4% Branch plan
Warehouse Leader H5 32,960 15.85 40,865 19.65 48,770 23.45 47.97% 6.5% Branch plan
High COL Salary Range
Low COL Salary Range
Medium COL Salary Range
Involve HRL’s – what COL to use?
Southeast Pacific SW Low Ohio Valley S. Central Med
015 Low 002 Low 004 Med 051 Med
075 Low 092 Low 008 Med 069 Med
117 Low 093 Low 031 Med 114 Med
126 Low 097 Low 033 Med 115 Med
128 Low 112 Low 055 Med 651 Med
609 Low Northeast 058 Med Pacific SW Med
620 Low 123 Low 061 Med 021 Med
South 010 Med 065 Med 074 Med
067 Low 014 Med 098 Med 088 Med
106 Low 044 Med 623 Med 096 Med
602 Low 082 Med N/ A Med Northeast
614 Low 083 Med Grt Plains 009 High
Ohio Valley 087 Med 011 Med 012 High
018 Low 095 Med 017 Med 111 High
045 Low 145 Med 025 Med 636 High
079 Low 679 Med 046 Med South High
084 Low Southeast 072 Med 605 High
Grt Plains 042 Med 085 Med Southeast High
036 Low 070 Med 120 Med 610 High
054 Low 071 Med Midw est Med Ohio Valley High
143 Low 080 Med 032 Med 625 High
150 Low 081 Med 038 Med 068 High
Midw est Low 611 Med 048 Med 151 High
648 Low South 057 Med 647 High
S Cent ral Low 030 Med 060 Med Midwest High
049 Low 052 Med 073 Med 125 High
066 Low 091 Med 086 Med 616 High
105 Low 607 Med 094 Med 646 High
134 Low 660 Med 118 Med S Central High
144 Low 155 Med 606 High
154 Low 632 Med 604 High
027 High
Final product –
3 jobs added & # locations reduced by almost 1/3
Recommended Rates 2010/2011
LowRange Standard Range High Range
Min Mid Max Min Mid Max Min Mid Max
Warehouse Person 20,800 10.00 25,270 12.15 29,740 14.30 21,320 10.25 26,360 12.67 31,400 15.10 23,500 11.30 28,500 13.70 33,500 16.11
Truck Driver 22,040 10.60 26,930 12.95 31,820 15.30 24,000 11.54 29,470 14.17 34,940 16.80 25,800 12.40 31,880 15.33 37,960 18.25
Customer Service Rep 23,600 11.35 29,110 14.00 34,620 16.64 26,000 12.50 32,000 15.38 38,000 18.27 28,000 13.46 34,435 16.56 40,870 19.65
Clerk 23,600 11.35 29,110 14.00 34,620 16.64 26,000 12.50 32,000 15.38 38,000 18.27 28,000 13.46 34,435 16.56 40,870 19.65
Truck Driver CDL 24,960 12.00 31,200 15.00 37,440 18.00 27,970 13.45 34,470 16.57 40,970 19.70 31,200 15.00 38,375 18.45 45,550 21.90
Inside Sales Specialist 27,560 13.25 33,800 16.25 40,040 19.25 30,050 14.45 37,540 18.05 45,030 21.65 32,960 15.85 40,865 19.65 48,770 23.45
Warehouse Leader 27,560 13.25 33,800 16.25 40,040 19.25 30,050 14.45 37,540 18.05 45,030 21.65 32,960 15.85 40,865 19.65 48,770 23.45
Customer Service Lead 35,000 16.83 44,000 21.15 53,000 25.48 35,000 16.83 44,000 21.15 53,000 25.48 35,000 16.83 44,000 21.15 53,000 25.48
Assistant Branch Manager
(Exem pt position)
46,000 22.12 57,500 27.64 69,000 33.17 46,000 22.12 57,500 27.64 69,000 33.17 46,000 22.12 57,500 27.64 69,000 33.17
Situation #3
• When do employees take time off?
• Could this be improved from a business
efficiency viewpoint?
• How does this compare to other parts of
the company and the industry?
Initial data pull from Kronos timekeeping reports
Data is in hours, () are # of weeks in month
JAN(4) FEB(4) MAR(4) APR(5) MAY(4) JUN(4) JUL(5) AUG(4) SEP(5) OCT(4) NOV(4) DEC(5) TOTAL(52)
Tot T-O % of Reg 4.9% 7.1% 5.2% 5.1% 5.8% 12.4% 12.0% 7.0% 10.7% 6.1% 20.8% 36.3% 7.7%
Overtime % of Reg 0.7% 1.0% 1.6% 3.7% 5.1% 6.4% 7.2% 6.6% 7.9% 10.4% 10.1% 7.8% 5.9%
Total Time off 2602.25 3611.75 2731.00 3607.25 3378.50 6972.45 8538.00 4188.75 7847.75 3787.35 11395.00 23503.25 56042.30
Overtime 371.50 502.50 832.50 2585.75 2929.25 3591.95 5111.00 3957.25 5787.75 6450.50 5552.75 5051.50 42724.20
Regular 52640.00 51138.00 53027.75 70161.50 57963.25 56258.55 71103.50 60167.75 73231.25 62048.50 54867.00 64735.50 727342.55
55613.75 55252.25 56591.25 76354.50 64271.00 66822.95 84752.50 68313.75 86866.75 72286.35 71814.75 93290.25
Absent 0.00 0.00 0.00 0.00 0.00 0.00 0.00 0.00 0.00 8.00 16.00 95.50 119.50
Absent-Excused 176.00 112.00 8.00 120.00 176.00 32.00 24.00 48.00 416.00 408.00 188.00 240.00 1948.00
Funeral 208.00 80.00 96.00 120.00 123.25 224.00 96.00 80.00 98.50 128.00 40.00 88.00 1381.75
Jury 8.00 0.00 24.00 16.00 0.00 24.00 8.00 0.00 24.00 8.00 8.00 0.00 120.00
Personal Day 507.50 677.50 247.25 224.50 228.25 245.50 233.50 272.25 237.00 255.75 347.25 1115.00 4591.25
Sick Pay 490.50 658.25 362.25 365.50 264.75 210.25 229.00 272.50 470.75 320.35 360.75 5297.75 9302.60
Holiday 0.00 0.00 0.00 0.00 0.00 3096.00 3168.00 0.00 3229.00 0.00 6632.00 9996.00 26121.00
Vacation 1212.25 2084.00 1993.50 2761.25 2586.25 3140.70 4779.50 3516.00 3372.50 2659.25 3803.00 6671.00 38579.20
Other Time off 1390.00 1527.75 737.50 846.00 792.25 3831.75 3758.50 672.75 4475.25 1128.10 7592.00 16832.25 17463.10
Time off by month
0
2000
4000
6000
8000
10000
12000
JAN(4) FEB(4) MAR(4) APR(5) MAY(4) JUN(4) JUL(5) AUG(4) SEP(5) OCT(4) NOV(4) DEC(5)
Hours
Absent-Excused
Funeral
Jury
Personal Day
Sick Pay
Holiday
Vacation
Relationship of Time off to Overtime
Time-Off Actual Hours
0
1,000
2,000
3,000
4,000
5,000
6,000
7,000
8,000
9,000
10,000
JAN(4) FEB(4) MAR(4) APR(5) MAY(4) JUN(4) JUL(5) AUG(4) SEP(5) OCT(4) NOV(4) DEC(5)
Vacation
Other Time off
Total Time off
Overtime
Lending a Hand to Others
• Akron Area Chapter of SHRM
– Member of the Year 2002
– Comp & Benefits Committee Chair (2 yrs)
– Treasurer
– Vice-President & Programming Chair (2 yrs)
– President (2 yrs)
– Past President (current, 2 yrs)
• Ohio SHRM State Council
– Member as Chapter President (2 yrs)
– Diversity Director, Ohio State Council (maximum 3 1-yr terms)
– Certification Director, Ohio State Council (in 2nd
1-yr term)
• Colleges and Other
– U of A Student Chapter – Compensation and HR careers (w/Diane Augsbury,
Jennifer Miller, Laura Bishop)
– U of A Graduate students – Class on compensation surveys & analysis
– KSU Student Chapter – Current Compensation issues (w/Jennifer Miller, Laura
Bishop)
– JCU – Compensation survey methods (w/Laura Bishop)
– Stark Human Resources Association – Chapter meeting on compensation survey
sources and methods (w/Laura Bishop)
– SHRM PHR/SPHR Certification preparation course – Co-facilitated (w/Liz England)

More Related Content

Similar to Rakoci CompSulting samples

How gilt implemented a successful labor management system ops summit 2013
How gilt implemented a successful labor management system ops summit 2013How gilt implemented a successful labor management system ops summit 2013
How gilt implemented a successful labor management system ops summit 2013Steve Johnson
 
Power financials - how we work
Power financials - how we workPower financials - how we work
Power financials - how we workSteve Power
 
Amazon Fresh - Mock Financials
Amazon Fresh - Mock FinancialsAmazon Fresh - Mock Financials
Amazon Fresh - Mock FinancialsHelena Lavieri
 
Budget proposal - create good looking budgets
Budget proposal - create good looking budgetsBudget proposal - create good looking budgets
Budget proposal - create good looking budgetsManan Younas
 
Investment In Business Assets PowerPoint Presentation Slides
Investment In Business Assets PowerPoint Presentation SlidesInvestment In Business Assets PowerPoint Presentation Slides
Investment In Business Assets PowerPoint Presentation SlidesSlideTeam
 
Introduction to Financial modeling
Introduction  to Financial modelingIntroduction  to Financial modeling
Introduction to Financial modelingKevin Crosby
 
Fixed Investment Analysis PowerPoint Presentation Slides
Fixed Investment Analysis PowerPoint Presentation SlidesFixed Investment Analysis PowerPoint Presentation Slides
Fixed Investment Analysis PowerPoint Presentation SlidesSlideTeam
 
Working Capital Modeling PowerPoint Presentation Slides
Working Capital Modeling PowerPoint Presentation Slides Working Capital Modeling PowerPoint Presentation Slides
Working Capital Modeling PowerPoint Presentation Slides SlideTeam
 
Board Preview: What's Next for Director Compensation
Board Preview: What's Next for Director CompensationBoard Preview: What's Next for Director Compensation
Board Preview: What's Next for Director CompensationPearl Meyer
 
Purpose of Assignment This assignment is designed to help studen.docx
Purpose of Assignment This assignment is designed to help studen.docxPurpose of Assignment This assignment is designed to help studen.docx
Purpose of Assignment This assignment is designed to help studen.docxmakdul
 
Di Bacco Brochure Services PowerPoint
Di Bacco Brochure Services PowerPointDi Bacco Brochure Services PowerPoint
Di Bacco Brochure Services PowerPointJoe Mcgough
 
Cost management & management control
Cost management & management controlCost management & management control
Cost management & management controlPercy Poonegar
 
The Finance Perspective: The Business Model for the Subscription Economy
The Finance Perspective: The Business Model for the Subscription EconomyThe Finance Perspective: The Business Model for the Subscription Economy
The Finance Perspective: The Business Model for the Subscription EconomyZuora, Inc.
 
A Guide to Trading System Analysis : แนะนำแนวทางการอ่านผล Backtest เพื่อวิเคร...
A Guide to Trading System Analysis : แนะนำแนวทางการอ่านผล Backtest เพื่อวิเคร...A Guide to Trading System Analysis : แนะนำแนวทางการอ่านผล Backtest เพื่อวิเคร...
A Guide to Trading System Analysis : แนะนำแนวทางการอ่านผล Backtest เพื่อวิเคร...siamquant
 
A Recipe for Financial Success - 3 Steps to Increase Hospitality Sector Profits
A Recipe for Financial Success  - 3 Steps to Increase Hospitality Sector ProfitsA Recipe for Financial Success  - 3 Steps to Increase Hospitality Sector Profits
A Recipe for Financial Success - 3 Steps to Increase Hospitality Sector ProfitsNeil Dockar
 
Profit and Loss, Do You Have a Choice?
Profit and Loss, Do You Have a Choice?Profit and Loss, Do You Have a Choice?
Profit and Loss, Do You Have a Choice?Steven Sunder
 
Understanding The Impact of Sales to Cash Flow & Capital Planning in Micro, S...
Understanding The Impact of Sales to Cash Flow & Capital Planning in Micro, S...Understanding The Impact of Sales to Cash Flow & Capital Planning in Micro, S...
Understanding The Impact of Sales to Cash Flow & Capital Planning in Micro, S...Nino Mayvi Dian
 
Using the Right Metrics to Improve Physician Practice Management
Using the Right Metrics to Improve Physician Practice ManagementUsing the Right Metrics to Improve Physician Practice Management
Using the Right Metrics to Improve Physician Practice ManagementWarren E. Corprew, Jr. MBA CMA CHFP
 
Rpa conference new delhi
Rpa conference new delhiRpa conference new delhi
Rpa conference new delhigaurav
 

Similar to Rakoci CompSulting samples (20)

How gilt implemented a successful labor management system ops summit 2013
How gilt implemented a successful labor management system ops summit 2013How gilt implemented a successful labor management system ops summit 2013
How gilt implemented a successful labor management system ops summit 2013
 
Power financials - how we work
Power financials - how we workPower financials - how we work
Power financials - how we work
 
Amazon Fresh - Mock Financials
Amazon Fresh - Mock FinancialsAmazon Fresh - Mock Financials
Amazon Fresh - Mock Financials
 
Budget proposal - create good looking budgets
Budget proposal - create good looking budgetsBudget proposal - create good looking budgets
Budget proposal - create good looking budgets
 
Investment In Business Assets PowerPoint Presentation Slides
Investment In Business Assets PowerPoint Presentation SlidesInvestment In Business Assets PowerPoint Presentation Slides
Investment In Business Assets PowerPoint Presentation Slides
 
Introduction to Financial modeling
Introduction  to Financial modelingIntroduction  to Financial modeling
Introduction to Financial modeling
 
Fixed Investment Analysis PowerPoint Presentation Slides
Fixed Investment Analysis PowerPoint Presentation SlidesFixed Investment Analysis PowerPoint Presentation Slides
Fixed Investment Analysis PowerPoint Presentation Slides
 
Working Capital Modeling PowerPoint Presentation Slides
Working Capital Modeling PowerPoint Presentation Slides Working Capital Modeling PowerPoint Presentation Slides
Working Capital Modeling PowerPoint Presentation Slides
 
Board Preview: What's Next for Director Compensation
Board Preview: What's Next for Director CompensationBoard Preview: What's Next for Director Compensation
Board Preview: What's Next for Director Compensation
 
Purpose of Assignment This assignment is designed to help studen.docx
Purpose of Assignment This assignment is designed to help studen.docxPurpose of Assignment This assignment is designed to help studen.docx
Purpose of Assignment This assignment is designed to help studen.docx
 
Di Bacco Brochure Services PowerPoint
Di Bacco Brochure Services PowerPointDi Bacco Brochure Services PowerPoint
Di Bacco Brochure Services PowerPoint
 
Cost management & management control
Cost management & management controlCost management & management control
Cost management & management control
 
The Finance Perspective: The Business Model for the Subscription Economy
The Finance Perspective: The Business Model for the Subscription EconomyThe Finance Perspective: The Business Model for the Subscription Economy
The Finance Perspective: The Business Model for the Subscription Economy
 
SCM PROJECT
SCM PROJECTSCM PROJECT
SCM PROJECT
 
A Guide to Trading System Analysis : แนะนำแนวทางการอ่านผล Backtest เพื่อวิเคร...
A Guide to Trading System Analysis : แนะนำแนวทางการอ่านผล Backtest เพื่อวิเคร...A Guide to Trading System Analysis : แนะนำแนวทางการอ่านผล Backtest เพื่อวิเคร...
A Guide to Trading System Analysis : แนะนำแนวทางการอ่านผล Backtest เพื่อวิเคร...
 
A Recipe for Financial Success - 3 Steps to Increase Hospitality Sector Profits
A Recipe for Financial Success  - 3 Steps to Increase Hospitality Sector ProfitsA Recipe for Financial Success  - 3 Steps to Increase Hospitality Sector Profits
A Recipe for Financial Success - 3 Steps to Increase Hospitality Sector Profits
 
Profit and Loss, Do You Have a Choice?
Profit and Loss, Do You Have a Choice?Profit and Loss, Do You Have a Choice?
Profit and Loss, Do You Have a Choice?
 
Understanding The Impact of Sales to Cash Flow & Capital Planning in Micro, S...
Understanding The Impact of Sales to Cash Flow & Capital Planning in Micro, S...Understanding The Impact of Sales to Cash Flow & Capital Planning in Micro, S...
Understanding The Impact of Sales to Cash Flow & Capital Planning in Micro, S...
 
Using the Right Metrics to Improve Physician Practice Management
Using the Right Metrics to Improve Physician Practice ManagementUsing the Right Metrics to Improve Physician Practice Management
Using the Right Metrics to Improve Physician Practice Management
 
Rpa conference new delhi
Rpa conference new delhiRpa conference new delhi
Rpa conference new delhi
 

Rakoci CompSulting samples

  • 1. Situation #1 • Akron SHRM wage survey last done 2003 • Need to resurrect • Committee formed – 8 Members at peak – All played role in data summation • Jobs surveyed needed updating – 48 selected and updated in 2005 and 2006 – More representative of Chapter companies – Compliance with sample size reqs • New look, new data summary – Data summary page – Merit increase information included – New pricing for participants and non-participants
  • 2. Initial raw data input Keyed in manually by Committee Member, others did data summary Status Union Staff Size Average Minimum Maximum Incentive Exempt Union 1 45,100.00$ 43,400.00$ 65,000.00$ 45,100.00$ 3.50% Exempt Union 1 51,513.00$ 35,040.00$ 54,720.00$ 51,513.00$ Exempt Non-union 5.6 47,112.00$ 39,104.00$ 49,920.00$ 263,827.20$ Exempt Non-union 3 48,963.20$ 38,708.80$ 48,963.20$ 146,889.60$ Exempt Non-union 1 53,000.00$ 40,000.00$ 64,000.00$ 53,000.00$ Exempt Non-union 4 41,200.00$ 34,100.00$ 56,400.00$ 164,800.00$ 10.00% Exempt Non-union 24 46,000.00$ 38,000.00$ 56,000.00$ 1,104,000.00$ 2.00% Exempt Non-union 1 45,600.00$ 38,295.00$ 53,649.00$ 45,600.00$ Exempt Non-union 16 44,000.00$ 38,000.00$ 65,000.00$ 704,000.00$ Exempt Non-union 3 36,819.00$ 32,625.00$ 65,000.00$ 110,457.00$ Exempt Non-union 2 46,500.00$ 38,800.00$ 64,800.00$ 93,000.00$ 6.00% Exempt Non-union 1 45,000.00$ 45,000.00$ 5.00% Exempt Non-union 6 39,300.00$ 34,650.00$ 57,790.00$ 235,800.00$ 4.00% Exempt Non-union 9 40,800.00$ 36,129.00$ 63,876.00$ 367,200.00$ Exempt Non-union 1 43,000.00$ 43,000.00$ 3,473,186.80$ # of Orgs Reporting # FTEs Weighted Ave Average 25th Percentile Median 75th Percentile # of Orgs Ave Minimum Ave Midpoint Ave Maximum % of Orgs Paying % of Salary Non-Exempt 0 0 Exempt 15 78.6 44,188$ 44,927$ 42,100$ 45,100$ 46,806$ 13 37,450$ 48,153$ 58,855$ 40% 5.1% Overall 15 78.6 44,188$ 44,927$ 42,100$ 45,100$ 46,806$ 13 37,450$ 48,153$ 58,855$ 40% 5.1% FINANCIAL This is a staff position that performs the full range of duties in an Accounting function. Applies accounting principles to assist in design, installation and maintenance of general accounting systems to provide records of assets, liabilities, and financial transactions. Reconciles and adjusts various general ledger accounts and/or bank statements. Compiles, consolidates, and analyzes accounting and finance information for the production of financial statements and reports. May function in any of the various Accounting functions such as Cost or Operations Accounting, Tax or Auditing. Accountant INCENTIVESREPORTED WAGE RATES WAGE RANGE
  • 3. Pre-publish audit format 48 jobs published with adequate sample size – Members doing data summary swapped to do audits # of Orgs Reporting # FTEs Weighted Ave Average 25th Percentile Median 75th Percentile # of Orgs Ave Minimum Ave Midpoint Ave Maximum % of Orgs Paying % of Salary Non-Exempt 0 0 Exempt 15 78.6 44,188$ 44,927$ 42,100$ 45,100$ 46,806$ 13 37,450$ 48,153$ 58,855$ 40% 5.1% Overall 15 78.6 44,188$ 44,927$ 42,100$ 45,100$ 46,806$ 13 37,450$ 48,153$ 58,855$ 40% 5.1% # of Orgs Reporting # FTEs Weighted Ave Average 25th Percentile Median 75th Percentile # of Orgs Ave Minimum Ave Midpoint Ave Maximum % of Orgs Paying % of Salary Non-Exempt 6 20.5 28,622$ 30,279$ 27,632$ 28,381$ 31,858$ 4 25,592$ 32,046$ 38,500$ Exempt 5 11 29,351$ 29,172$ 26,000$ 28,000$ 33,000$ 4 24,443$ 29,714$ 34,986$ Overall 11 31.5 28,877$ 29,776$ 26,855$ 28,329$ 33,000$ 8 25,017$ 30,880$ 36,743$ 36% 5.4% Status Union Staff Size Average Minimum Maximum Incentive # of Orgs Reporting # FTEs Weighted Ave Average 25th Percentile Median 75th Percentile # of Orgs Ave Minimum Ave Midpoint Ave Maximum % of Orgs Paying % of Salary Non-Exempt 7 14 81,556$ 70,112$ 59,741$ 75,000$ 78,150$ 6 65,520$ 78,256$ 90,992$ 57% 12.1% Exempt 9 21 81,537$ 70,416$ 57,000$ 69,327$ 90,000$ 9 54,031$ 63,171$ 72,311$ Overall 16 35 81,545$ 68,283$ 56,913$ 70,897$ 82,500$ 9 58,134$ 68,558$ 78,983$ 38% 10.4% # of Orgs Reporting # FTEs Weighted Ave Average 25th Percentile Median 75th Percentile # of Orgs Ave Minimum Ave Midpoint Ave Maximum % of Orgs Paying % of Salary Non-Exempt 16 63.4 29,079$ 29,931$ 26,700$ 29,141$ 33,863$ 12 26,238$ 31,464$ 36,690$ 31% 5.5% Exempt Insufficient Data Overall 17 65.4 29,087$ 29,896$ 27,000$ 29,338$ 33,592$ 13 26,260$ 31,464$ 36,668$ 29% 5.5% WAGE RANGE INCENTIVES INCENTIVES INCENTIVES Manages professional level accounting operations and oversees those who estimate expected expenditures and submits to management. Analyzes records of present and past operations, trends and costs, estimated and realized revenues, administrative commitments, and obligations incurred. Certifies accuracy of operating and financial reports. Develops, installs, and maintains budgeting systems which provide control of expenditures made to carry out activities. Advises upper management regarding matters such as effective use of resources and methods for preventing capital being frozen. Accounting Manager Compiles and prepares customer charges, using purchase orders, shipping manifests, sales tickets, charge slips, etc. Calculates and prepares invoices and bills. Verifies and issues credit memos for returned goods. Posts transactions to accounting records. Billing/Accounts Payable Clerk REPORTED WAGE RATES WAGE RANGE REPORTED WAGE RATES WAGE RANGE REPORTED WAGE RATES FINANCIAL This is a staff position that performs the full range of duties in an Accounting function. Applies accounting principles to assist in design, installation and maintenance of general accounting systems to provide records of assets, liabilities, and financial transactions. Reconciles and adjusts various general ledger accounts and/or bank statements. Compiles, consolidates, and analyzes accounting and finance information for the production of financial statements and reports. May function in any of the various Accounting functions such as Cost or Operations Accounting, Tax or Auditing. In accordance with standard procedures, performs the full range of basic bookkeeping and clerical accounting duties, electronically or manually, such as reconciling words and numbers, making journal entries, balancing ledgers, tracing account transactions, making basic mathematical and percentage calculations, and preparing monthly statements. Accounting Clerk Accountant INCENTIVESREPORTED WAGE RATES WAGE RANGE
  • 4. Sample? • 2006 Paper copy of Akron SHRM Area wage survey brought along for viewing • Also have 2005 version on memory stick • Pricing was initially $40 for participants, $80 for non-
  • 5. Situation #2 • Hourly pay ranges available in 2008 – 1 size fits all – Midpoint calcs off – Need to be refreshed/checked • What about geographical differences? – 152 locations – Over 20 states – 5 jobs
  • 6. Build initial structure Position NDX Prop Grade Min Sal Min Hrly Mid Sal Mid Hrly Max Sal Max Hrly Spread Midpoint Chg Bonus Warehouse Employee L1 20,800 10.00 25,270 11.90 29,740 14.30 42.98% Branch plan Truck Driver L2 22,040 10.60 26,930 12.95 31,820 15.30 44.37% 6.6% Branch plan Customer Service Rep L3 23,600 11.35 29,110 14.00 34,620 16.64 46.69% 8.1% Branch plan Truck Driver CDL L4 24,960 12.00 31,200 15.00 37,440 18.00 50.00% 7.2% Branch plan Warehouse Leader L5 27,560 13.25 33,800 16.25 40,040 19.25 45.28% 8.3% Branch plan Warehouse Employee M1 21,320 10.25 26,360 12.67 31,400 15.10 47.28% Branch plan Truck Driver M2 24,000 11.54 29,470 14.17 34,940 16.80 45.58% 11.8% Branch plan Customer Service Rep M3 26,000 12.50 32,000 15.38 38,000 18.27 46.15% 8.6% Branch plan Truck Driver CDL M4 27,970 13.45 34,470 16.57 40,970 19.70 46.48% 7.7% Branch plan Warehouse Leader M5 30,050 14.45 37,540 18.05 45,030 21.65 49.85% 8.9% Branch plan Warehouse Employee H1 23,500 11.30 28,500 13.70 33,500 16.11 42.55% Branch plan Truck Driver H2 25,800 12.40 31,880 15.33 37,960 18.25 47.13% 11.9% Branch plan Customer Service Rep H3 28,000 13.46 34,435 16.56 40,870 19.65 45.96% 8.0% Branch plan Truck Driver CDL H4 31,200 15.00 38,375 18.45 45,550 21.90 45.99% 11.4% Branch plan Warehouse Leader H5 32,960 15.85 40,865 19.65 48,770 23.45 47.97% 6.5% Branch plan
  • 7. Geographical groupings NDX Position NDX Prop Grade Min Sal Hrly Mid Sal Hrly Max Sal Hrly Spread Midpoint Chg Bonus Warehouse Employee L1 20,800 10.00 25,270 12.15 29,740 14.30 42.98% Branch plan Truck Driver L2 22,040 10.60 26,930 12.95 31,820 15.30 44.37% 6.6% Branch plan Customer Service Rep L3 23,600 11.35 29,110 14.00 34,620 16.64 46.69% 8.1% Branch plan Truck Driver CDL L4 24,960 12.00 31,200 15.00 37,440 18.00 50.00% 7.2% Branch plan Warehouse Leader L5 27,560 13.25 33,800 16.25 40,040 19.25 45.28% 8.3% Branch plan NDX Position NDX Prop Grade Min Sal Hrly Mid Sal Hrly Max Sal Hrly Spread Midpoint Chg Bonus Warehouse Employee M1 21,320 10.25 26,360 12.67 31,400 15.10 47.28% Branch plan Truck Driver M2 24,000 11.54 29,470 14.17 34,940 16.80 45.58% 11.8% Branch plan Customer Service Rep M3 26,000 12.50 32,000 15.38 38,000 18.27 46.15% 8.6% Branch plan Truck Driver CDL M4 27,970 13.45 34,470 16.57 40,970 19.70 46.48% 7.7% Branch plan Warehouse Leader M5 30,050 14.45 37,540 18.05 45,030 21.65 49.85% 8.9% Branch plan NDX Position NDX Prop Grade Min Sal Hrly Mid Sal Hrly Max Sal Hrly Spread Midpoint Chg Bonus Warehouse Employee H1 23,500 11.30 28,500 13.70 33,500 16.11 42.55% Branch plan Truck Driver H2 25,800 12.40 31,880 15.33 37,960 18.25 47.13% 11.9% Branch plan Customer Service Rep H3 28,000 13.46 34,435 16.56 40,870 19.65 45.96% 8.0% Branch plan Truck Driver CDL H4 31,200 15.00 38,375 18.45 45,550 21.90 45.99% 11.4% Branch plan Warehouse Leader H5 32,960 15.85 40,865 19.65 48,770 23.45 47.97% 6.5% Branch plan High COL Salary Range Low COL Salary Range Medium COL Salary Range
  • 8. Involve HRL’s – what COL to use? Southeast Pacific SW Low Ohio Valley S. Central Med 015 Low 002 Low 004 Med 051 Med 075 Low 092 Low 008 Med 069 Med 117 Low 093 Low 031 Med 114 Med 126 Low 097 Low 033 Med 115 Med 128 Low 112 Low 055 Med 651 Med 609 Low Northeast 058 Med Pacific SW Med 620 Low 123 Low 061 Med 021 Med South 010 Med 065 Med 074 Med 067 Low 014 Med 098 Med 088 Med 106 Low 044 Med 623 Med 096 Med 602 Low 082 Med N/ A Med Northeast 614 Low 083 Med Grt Plains 009 High Ohio Valley 087 Med 011 Med 012 High 018 Low 095 Med 017 Med 111 High 045 Low 145 Med 025 Med 636 High 079 Low 679 Med 046 Med South High 084 Low Southeast 072 Med 605 High Grt Plains 042 Med 085 Med Southeast High 036 Low 070 Med 120 Med 610 High 054 Low 071 Med Midw est Med Ohio Valley High 143 Low 080 Med 032 Med 625 High 150 Low 081 Med 038 Med 068 High Midw est Low 611 Med 048 Med 151 High 648 Low South 057 Med 647 High S Cent ral Low 030 Med 060 Med Midwest High 049 Low 052 Med 073 Med 125 High 066 Low 091 Med 086 Med 616 High 105 Low 607 Med 094 Med 646 High 134 Low 660 Med 118 Med S Central High 144 Low 155 Med 606 High 154 Low 632 Med 604 High 027 High
  • 9. Final product – 3 jobs added & # locations reduced by almost 1/3 Recommended Rates 2010/2011 LowRange Standard Range High Range Min Mid Max Min Mid Max Min Mid Max Warehouse Person 20,800 10.00 25,270 12.15 29,740 14.30 21,320 10.25 26,360 12.67 31,400 15.10 23,500 11.30 28,500 13.70 33,500 16.11 Truck Driver 22,040 10.60 26,930 12.95 31,820 15.30 24,000 11.54 29,470 14.17 34,940 16.80 25,800 12.40 31,880 15.33 37,960 18.25 Customer Service Rep 23,600 11.35 29,110 14.00 34,620 16.64 26,000 12.50 32,000 15.38 38,000 18.27 28,000 13.46 34,435 16.56 40,870 19.65 Clerk 23,600 11.35 29,110 14.00 34,620 16.64 26,000 12.50 32,000 15.38 38,000 18.27 28,000 13.46 34,435 16.56 40,870 19.65 Truck Driver CDL 24,960 12.00 31,200 15.00 37,440 18.00 27,970 13.45 34,470 16.57 40,970 19.70 31,200 15.00 38,375 18.45 45,550 21.90 Inside Sales Specialist 27,560 13.25 33,800 16.25 40,040 19.25 30,050 14.45 37,540 18.05 45,030 21.65 32,960 15.85 40,865 19.65 48,770 23.45 Warehouse Leader 27,560 13.25 33,800 16.25 40,040 19.25 30,050 14.45 37,540 18.05 45,030 21.65 32,960 15.85 40,865 19.65 48,770 23.45 Customer Service Lead 35,000 16.83 44,000 21.15 53,000 25.48 35,000 16.83 44,000 21.15 53,000 25.48 35,000 16.83 44,000 21.15 53,000 25.48 Assistant Branch Manager (Exem pt position) 46,000 22.12 57,500 27.64 69,000 33.17 46,000 22.12 57,500 27.64 69,000 33.17 46,000 22.12 57,500 27.64 69,000 33.17
  • 10. Situation #3 • When do employees take time off? • Could this be improved from a business efficiency viewpoint? • How does this compare to other parts of the company and the industry?
  • 11. Initial data pull from Kronos timekeeping reports Data is in hours, () are # of weeks in month JAN(4) FEB(4) MAR(4) APR(5) MAY(4) JUN(4) JUL(5) AUG(4) SEP(5) OCT(4) NOV(4) DEC(5) TOTAL(52) Tot T-O % of Reg 4.9% 7.1% 5.2% 5.1% 5.8% 12.4% 12.0% 7.0% 10.7% 6.1% 20.8% 36.3% 7.7% Overtime % of Reg 0.7% 1.0% 1.6% 3.7% 5.1% 6.4% 7.2% 6.6% 7.9% 10.4% 10.1% 7.8% 5.9% Total Time off 2602.25 3611.75 2731.00 3607.25 3378.50 6972.45 8538.00 4188.75 7847.75 3787.35 11395.00 23503.25 56042.30 Overtime 371.50 502.50 832.50 2585.75 2929.25 3591.95 5111.00 3957.25 5787.75 6450.50 5552.75 5051.50 42724.20 Regular 52640.00 51138.00 53027.75 70161.50 57963.25 56258.55 71103.50 60167.75 73231.25 62048.50 54867.00 64735.50 727342.55 55613.75 55252.25 56591.25 76354.50 64271.00 66822.95 84752.50 68313.75 86866.75 72286.35 71814.75 93290.25 Absent 0.00 0.00 0.00 0.00 0.00 0.00 0.00 0.00 0.00 8.00 16.00 95.50 119.50 Absent-Excused 176.00 112.00 8.00 120.00 176.00 32.00 24.00 48.00 416.00 408.00 188.00 240.00 1948.00 Funeral 208.00 80.00 96.00 120.00 123.25 224.00 96.00 80.00 98.50 128.00 40.00 88.00 1381.75 Jury 8.00 0.00 24.00 16.00 0.00 24.00 8.00 0.00 24.00 8.00 8.00 0.00 120.00 Personal Day 507.50 677.50 247.25 224.50 228.25 245.50 233.50 272.25 237.00 255.75 347.25 1115.00 4591.25 Sick Pay 490.50 658.25 362.25 365.50 264.75 210.25 229.00 272.50 470.75 320.35 360.75 5297.75 9302.60 Holiday 0.00 0.00 0.00 0.00 0.00 3096.00 3168.00 0.00 3229.00 0.00 6632.00 9996.00 26121.00 Vacation 1212.25 2084.00 1993.50 2761.25 2586.25 3140.70 4779.50 3516.00 3372.50 2659.25 3803.00 6671.00 38579.20 Other Time off 1390.00 1527.75 737.50 846.00 792.25 3831.75 3758.50 672.75 4475.25 1128.10 7592.00 16832.25 17463.10
  • 12. Time off by month 0 2000 4000 6000 8000 10000 12000 JAN(4) FEB(4) MAR(4) APR(5) MAY(4) JUN(4) JUL(5) AUG(4) SEP(5) OCT(4) NOV(4) DEC(5) Hours Absent-Excused Funeral Jury Personal Day Sick Pay Holiday Vacation
  • 13. Relationship of Time off to Overtime Time-Off Actual Hours 0 1,000 2,000 3,000 4,000 5,000 6,000 7,000 8,000 9,000 10,000 JAN(4) FEB(4) MAR(4) APR(5) MAY(4) JUN(4) JUL(5) AUG(4) SEP(5) OCT(4) NOV(4) DEC(5) Vacation Other Time off Total Time off Overtime
  • 14. Lending a Hand to Others • Akron Area Chapter of SHRM – Member of the Year 2002 – Comp & Benefits Committee Chair (2 yrs) – Treasurer – Vice-President & Programming Chair (2 yrs) – President (2 yrs) – Past President (current, 2 yrs) • Ohio SHRM State Council – Member as Chapter President (2 yrs) – Diversity Director, Ohio State Council (maximum 3 1-yr terms) – Certification Director, Ohio State Council (in 2nd 1-yr term) • Colleges and Other – U of A Student Chapter – Compensation and HR careers (w/Diane Augsbury, Jennifer Miller, Laura Bishop) – U of A Graduate students – Class on compensation surveys & analysis – KSU Student Chapter – Current Compensation issues (w/Jennifer Miller, Laura Bishop) – JCU – Compensation survey methods (w/Laura Bishop) – Stark Human Resources Association – Chapter meeting on compensation survey sources and methods (w/Laura Bishop) – SHRM PHR/SPHR Certification preparation course – Co-facilitated (w/Liz England)