e-bulletin - 001 - Study Looping Nutrition Assessment’s Counseling and Suppor...
DMI Nyanza MCH Evaluation Report
1. DEVELOPMENTMEDIA INTERNATIONAL
Development Media Inter national Associates CIC, not-for -pr ofit Community Inter est Company no. 6069322 (r egister ed in England & Wales), and
Development Media Inter national Ltd, Company no. 5411295 (r egister ed in England & Wales). Register ed Addr ess: 8 Hugo Road, Lo ndon N19 5EU, UK.
DMI Offices: Unit 2, Fir st Floor , White Hor se Yar d, 78 Liver pool Road, London N1 0QD, UK | www.developmentmedia.net
Nyanza Mother and Child Health
Campaign: Evaluation Report
1. Introduction
In January2010, DevelopmentMediaInternational (DMI) was contracted by DFID to carry out a mass media
campaignto improve maternal and child health in Kenya. DMI calculated that the campaign would achieve
the largest reductions in mortality by promoting exclusive breastfeeding, oral rehydration therapy for
diarrhoea, and increased antenatal care (ANC) visits and health facility deliveries.
DMI conductedanintensive,radio-basedcampaignfromNovember2010 to May 2011, focusingprimarilyon
Nyanza Province.
The campaignincludedthe followingmessages:
Exclusive breastfeedingforthe firstsix monthsfollowedbycomplementaryfeeding
Managementof diarrhoeawithcontinuedfeeding, oral rehydrationtreatment,recognitionof
dangersigns and preventionof diarrhoea
A minimumof fourantenatal clinicvisits,earlyattendance and deliverywithaskilledattendant ata
healthfacility
2. Methods
2.1 Design
The study designwasabefore/aftercross-sectional surveydesign.Fieldworkforthe baselinefinishedbefore
the launchof the campaigninNovember2010 and the fieldwork for the endline started after the campaign
had ended in June 2011.
DMI agreed with Kemri/CDC to insert questions into the on-going Kemri/CDC Demographic Surveillance
System (DSS) survey in Nyanza Province. The DSS survey involves interviews with approximately 50,000
householdsthreetimesayear.The DMI questions,involvingasub-setof households,measured knowledge,
intended behaviour and reported behaviour before the campaign (September and October 2010) and
afterwards (May, June and August 2011).
Questions were asked in the style of the Kenya Demographic Health Survey (KDHS) in order to enable
comparisons to be made with provincial-level KDHS data preceding the campaign (from 2008-9). The
questionswere modifiedtoexplicitlymeasure beliefs,knowledge,intentionsandpracticestargeted through
the campaign.
The questions inserted into the DSS are attached in the Appendix.
2. 2
The endline had an extended section on exposure to, and recall of, the radio spots and long-format
programme.Italso askedwomenabout theirintention to access health services after listening to the spot,
and whether they had discussed the spots or messages with family or friends.
The study’smainobjectives wereto:
Monitor changes in indicators of knowledge, intended behaviour and reported behaviour for
breastfeeding, ORT, use of ANC services and women giving birth in a health facility.
Monitorexposure tothe campaignmessages andcampaignformats at endline (May, June & August
2011)
The survey was conducted in Gem, Asembo and Karemo districts, situated northeast of Lake Victoria in
Nyanza Province, western Kenya. The current combined demographic surveillance area of Asembo, Gem,
and Karemoencompasses218,376 people (withpopulations of 61,707, 78,874 and 77,795 respectively). The
number of households is approximately 48,650. The population is culturally homogeneous: over 95% are
members of the Luo tribe, and live through subsistence farming and fishing.
2.2 Sampling strategy
The DSS is administeredtoall households within the study sites. The questionnaire is administered to one
respondentperhousehold,whoactsas the “proxy”for the household.DMIagreed with Kemri/CDC that the
knowledge questions would be administered to all respondents, either male or female. Questions on
behaviour and intended behaviour were only administered to a respondent if she was a woman of
reproductive age (15-49) and had children.
To measure the exposure toDMI campaigns,all womenof reproductive age were askedhow frequently they
listenedtothe radioand whethertheyhadheardany mother and child health programming on the radio in
the last six months. Only respondents who answered “yes” to the latter question were then asked the
questions on exposure to the DMI campaign.
2.3 Fieldwork
The survey consisted of house-to-house interviews by trained staff, conducted on a rolling basis. Data
collection for the baseline started in the second week of September and ended on 5 November 2010
(approximately six weeksof datacollection),prior to the launch of the DMI campaign. For the endline, data
collection commenced directly after the campaign stopped broadcasting in May 2011 and ended in August
2011. DMI trained the DSS interviewers in administering the additional questions during a DSS refresher
training in Siaya. Interviewers were instructed to inform households that KEMRI/CDC was investigating a
number of different health interventions.
2.4 Ethics
The DMI questions were submitted to Kemri/CDC and ethical approval to include these into the DSS was
obtained through both the local and national ethical review boards.
Duringdata collection,the interviewerhadtoseekpermissionof the headof compoundtoparticipate in the
DSS,and afterreceiving signed,informedconsent,the interviewer was able to proceed with the interview.
3. 3
Respondentswereassuredof the confidentialityof the interview andthattheycouldrefuse to participate at
any time during the interview.
2.5 Data Analysis
Kemri/CDCprovidedDMIwitha sub–dataset.Thisconsistedof the DMI questions and background variables
(age, education, ethnicity, marital status and socio-economic status). Data was analysed using SPSS.
Univariate analysiswascarriedoutonthe backgroundcharacteristicsof surveyrespondents at baseline and
endline. Respondentswere categorisedintowealthquintilesbasedon occupationof headof householdand
a composite index measuring ownership of various household items and cattle and other livestock. Chi-
squared tests were conducted to assess if there were significant differences between respondents at
baseline and endline. Univariate analysis was conducted to analyse radio listening rates among women of
reproductive age and whether these respondents had heard anything on maternal and child health on the
radio in the last six months. To assess exposure of the campaign among women of reproductive age,
frequencies were conducted to report on the proportions who could recall DMI slogans or recordings.
Frequencieswere also conducted toassess the recall of campaign messages, as well as the message format
(long radio programmes, radio spots or both) among this population.
To assesscampaignperformance, we alsolookedat the proportion of women who had reported discussing
the radio messageswithanyone,andwhomtheyhaddiscussedthemwith. Inaddition,we assessed rates of
womenof reproductive age whoreportedhaving visitedahealthfacility in the last six months prompted by
exposure to radio programmes or spots.
The analysisonknowledge andbehaviourindicatorswasconducted using UNIANOVA to look at statistically
significantdifferencesbetweenbaseline and endline. The following background variables were controlled
for: marital status,educationlevel,region,socio-economicstatusandhouseholdoccupation.The analysis of
knowledge indicatorswasconductedseparatelyfor males and females. Analysis of trends in the behaviour
and intendedbehaviour indicators was conducted among women of reproductive age 15-49 with children.
To examine whether improvements in knowledge and behaviour between baseline and endline could be
attributedtothe DMI campaign,we analysedsignificantdifferencesbetweenendline indicators of exposed
and non-exposed women. Exposed vs. non-exposed respondents were categorised based on the variable
measuringwhethertheyhadheardDMI slogans.Ideally,we wouldhave beenable to look at dose-response
relationshipsusing the variable measuring how many times respondents had heard spots and long-format
programmes to categorise respondents in to groups of no, low, medium and high campaign exposure.
Unfortunately, due toerrorsin the PDA programming, the data measuring this indicator is unusable. There
was nootherway to do thiseffectivelyandwe therefore needtorelyoncomparisonof trendsin Knowledge,
Attitude and Practice (KAP) among exposed vs. non-exposed.
Significance levels in the tables are denoted with a * for p< 0.05; ** for p< 0.01; and *** for p<0.001; N.S.
stands for not statistically significant.
4. 4
3. Results
3.1 Sample sizes at baseline and endline
In the baseline surveythe knowledge questionswere askedtoany household member regardless of age, as
isthe case for the standard DSS questions. However, due to an error in the PDA programming, the endline
knowledge questionswere only asked to men and women of reproductive age (15-49 years). Therefore, to
ensure that the populations at baseline and endline were comparable, it was necessary to exclude
respondents aged under 15 or over 50 years old from the analysis. As approximately 38% of respondents
answering the knowledge questions in the baseline were over 50, it was necessary to exclude these
respondents from the final analysis (n=13,622). As a result, the sample size for respondents answering
knowledge questions is significantly bigger for the endline (14,902) than for baseline (11,817). The sample
sizes for respondents to behavioural questions were 7,315 at baseline and 10,221 at endline..
3.2 Characteristics of the Survey Population
At both baseline and endline, significantly more respondents lived in Gem district (over 37% of the total
survey population) than in either Asembo or Karemo. The majority of respondents answering knowledge
questions were female (over 63% in both rounds, although the proportion of female respondents for
knowledge questionswassignificantlyhigheratbaseline thanforendline).The mostcommonage group was
25-29 years old, either married or cohabiting. The majority of respondents had been educated to primary
level and were of Luo ethnicity.
5. 5
Table 1: Distribution of background characteristics of respondents
Background
Variables
Knowledge
Questions (Men
and Women) %
Baseline 2010
(N=11817)
Knowledge
Questions (Men
and Women) %
Endline 2011
(N=14902)
Behaviour
Questions
(Women of
Reproductive Age
with children) %
Baseline 2010
(N=7315)
Behaviour
Questions
(Women of
Reproductive Age
with children) %
Endline 2011
(N=10221)
District
Asembo 27.5 34.0 28.3 30.3
Gem 38.5 37.8 39.8 37.5
Karemo 34.9 28.2 31.9 32.1
Gender
Female 70.0 63.0 100 100
Male 30.0 37.0 N/A N/A
Age group
15-19 5.9 7.1 5.5 6.5
20-24 15.6 15.5 17.9 16.8
25-29 18.0 19.6 20.3 20.3
30-34 17.7 17.6 18.9 16.8
35-39 15.0 16.7 16.7 15.5
40-44 14.5 13.1 16.4 12.6
45-49 13.3 10.5 4.3 11.4
Marital Status
Single 11.9 14.0 6.8 8.1
Married/Cohabitating 73.2 73.1 76.5 75.0
Divorced/Separated 2.9 2.6 1.8 1.5
Widowed 12.1 10.4 14.9 15.4
Highest Education
Level
None 3.1 2.1 3.3 3.0
Primary 73.6 74.3 77.0 77.2
Secondary/High 20.4 20.8 17.7 17.9
Post-Secondary /
High
3.1 2.1 0.9 1.1
Ethnic Group
Luo 96.9 97.0 96.6 96.6
Other 3.1 3.0 3.4 3.4
Household Head
Occupation
Farmer 53.6 53.8 53.7 55.2
Other 46.4 46.2 46.3 44.8
Socio-Economic
Status
Lowest 13.0 12.8 12.6 12.8
Second 17.6 18.0 17.6 17.9
Middle 21.7 21.4 22.0 21.3
Fourth 23.9 24.1 23.7 24.3
Highest 24.4 23.7 24.1 23.8
6. 6
64.7% of womenof reproductive age are regularradiolisteners,i.e.theylisten to the radio either every day
or a fewtimesaweek.1
46.2%of womenof reproductive age reportedlisteningto the radio on a daily basis.
Chi-squared tests showed strong evidence of significant differences between the age of respondent and
frequencyof radiolistening(p<0.001),andbetweensocio-economic status and frequency of radio listening
(p<0.001) (please see appendix fordatatables).Youngerwomenwere more likely to listen more frequently
than older women, and the higher the respondent’s socio-economic status, the more likely they were to
listentothe radio more frequently.Thesetrendsare inline with latest figures from the Kenya DHS 2008-09.
Table 2: Radio listenership among women of reproductive
age
N=11194
Everyday 46.2%
A few times a week 18.5%
A few times a month 6.5%
Not at all 27.1%
Don’t know 1.6%
Ramogi FM was by far the most popular radio station among women of reproductive age (71.1% of radio
listeners reported listening to Ramogi FM), followed by Radio Namlolwe (24.7%) and Radio Lake Victoria
(20.9%).
Table 3: Proportions of radio listeners listening to various radio stations
n=7778
KBC 7.9%
Radio Namlolwe 24.7%
Radio Citizen 14.1%
Ramogi FM 71.1%
Radio Lake Victoria (Osienala) 20.9%
Radio Sahara 3.9%
Don’t know 1%
3.3 Exposure to DMI campaign among women of reproductive age
63.7% of regularradiolisteners recalledhearinganythingonmotherandchildhealthon the radio in the last
six months (41.2% of all women of reproductive age). Respondents at endline who recalled hearing any
motherand childhealth(MCH) programmingon the radiointhe last6 monthswere then tested on recall of
DMI campaignslogans,recordingsandmessages.Basedonthese results, 45.7% of regularradiolistenershad
beenexposedto the DMI campaign(29.6% of all womenof reproductive age). The most commonly recalled
format was the long-format programme: 18% of all regular radio listeners recalled the long-format
programme, while 19.4% recalled both the programme and spots.
1
As defined by the BBC and the Demographic Health Surveys, regular radio listeningis listeningto the radio atleast
once a week.
7. 7
Table 4: Proportions of regular radio listeners exposed to the DMI campaign formats
Format recalled n=7243
Radio Programme (Los Kari) 18%
Radio Spots 8.3%
Both Programme and Spots 19.4%
Word of Mouth 0.07%
Not exposed 53.2%
Don’t know 1%
3.4 Recall of messages among women exposed to the DMI campaign
Rates of spontaneous recall were high for a number of messages. For example, 71.5% of respondents
recalledthe message that“Itisimportantto breastfeedexclusively for six months“, and recall of messages
focusing on ante-natal care and health care facility deliveries were also relatively high. 65.3% recalled the
message that “It is important to go for ante-natal care at least four times” and 64.5% recalled the message
that “Husbandsshouldaccompanytheirwivestothe clinicfor ante-natal care anddeliveries”. Despite recall
beinghighestonthe exclusive breastfeeding message, only 27.7% recalled the message that “Babies don’t
needanythingotherthanbreastmilk”.Recall waslowestfor the message to “Continue normal feeding and
fluids when a child has diarrhoea”, at 24.3%.
Table 5: Spontaneous recall of individual messages among women exposed to DMI campaign
Message N=3116
Husbands should accompany their wives to the clinic for ANC and deliveries 64.5%
That it’s important to go for ANC at least4 times 65.3%
It’s important to plan ahead for delivery 49.7%
It’s important to deliver in a health facility 61.7%
It can be dangerous to deliver at home 43.9%
It’s important to breastfeed exclusively for 6 months 71.5%
Babies don’t need anythingbut breastmilk 27.7%
The firstmilk,colostrum,is very good for babies 33.5%
Give lots of fluids/clean water to a child with diarrhoea 41.8%
Continue normal feeding and fluids when a child has diarrhoea 24.3%
8. 8
3.5 Trends in knowledge among the survey population
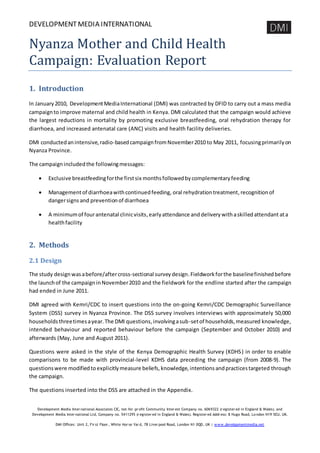
Multivariate analysisshowedsomesignificant improvements in knowledge indicators between the survey
populationsatbaselineandendline,andbetweenexposed and non-exposed women to the DMI campaign.
This is despite the high levels of knowledge at baseline. For knowledge indicators related to exclusive
breastfeeding,the rate of femaleswhoagreedthatnewbornbabiesshould be exclusively breastfed for the
firstsix monthsincreasedfrom65.3% at baseline to83.3% at endline(p<0.001).There wasa similarincrease
for males, 66.2% vs. 90.2% (p<0.001). There was also a significant difference in proportions of exposed vs.
non-exposed women, 90% vs. 84.1% (p<0.001). There was a significant difference in rates of women of
reproductive age being able to recognise the benefits of colostrum, from 88.2% at baseline to 90.7% at
endline (p<0.001).More womenin the exposed group were aware of the benefits of colostrum than in the
unexposed group, although the significance level was borderline (p=0.054).
There were significantimprovements inknowledge indicators around ante natal care between populations
at baseline andendline. Proportions of respondents agreeing to the statement “As soon as a woman finds
out she is pregnant she should seek ante-natal care” increased from 93% to 95.1% for women, and from
92.9% to 95.5% for men (p<0.001). There was also a significant difference between exposed and non-
exposedwomenof reproductive age agreeing to this statement at endline at 94.9% and 93.3% respectively
(p<0.01). The rates of womenwhowere aware that pregnantwomanshouldattenda minimum of four ante
natal care sessions increased from 68.2% at baseline to 76.2% at endline (p<0.001), and there was a
significantdifferenceinawarenessbetweenexposedandunexposed women, 78.7% and 69.3% respectively
(p<0.001).
Regarding trends in knowledge indicators on birth preparedness, there were significant improvements
betweenbaseline andendlinearoundawarenessof the needtoidentify the healthfacilityinadvance, 79.5%
vs. 87.4% for women and 82.9% vs. 86.7% for men, as well as the need to save money for transportation to
health facility 93.3% vs. 97.5% for women (p<0.001) and 94.2% vs. 95.9% for men (p>0.001), and to save
additional money for emergencies, 94.2% vs. 97.8% for women (p<0.001) and 92.8% vs. 96.9% for men
(p>0.001). However, whencomparingtrendsbetweenexposedandnon-exposed, awarenessrateswere only
significantly higher among the exposed group for the indicator regarding the need to identify the health
facility in advance, 90.2% vs. 83.3% (p<0.001).
For the indicators measuring knowledge around treatment of childhood diarrhoea, there were significant
improvementsatbaselineandendline inthe indicatormeasuring awarenessof the importance of continued
feeding of children with diarrhoea. Awareness among women rose from 75.7% at baseline to 78.1% at
endline (p<0.01),andfrom70.9% to 76.7% for men (p<0.001). There wasalsoan improvementinawareness
of the importance of increasing fluid intake, from 91.3% to 94.8% for women and from 88.5% to 93.1% for
men (p<0.001).
9. 9
Table 6: Trends in knowledge indicators at baseline and endline
Female
(N=7726)
Baseline
2010
Female
(N=8573)
Endline
2011
Sig Male
(N=3260)
Baseline
2010
Male
(N=4985)
Endline
2011
Sig Female
Not
exposed
Female
Exposed
Sig
Breastfeeding: % % % % % %
New born babies should
be exclusively breastfed
for the firstsix months
65.3 83.3 *** 66.2 90.2 *** 84.1 90.0 ***
Breast milk with
colostrum(yellowmilk)
improves babies health
and helps fights disease
88.2 90.7 *** N/A
x
92.0 93.3 0.054
Antenatal Care:
As soon as a woman
finds out she is pregnant
she should seek ante
natal care
93.0 95.1 *** 92.9 95.5 *** 93.3 94.9 **
How many ante natal
carevisits should a
woman make when she
is pregnant:
N/A
x
None 1.0 0.5 ** - 0.5 0.4 NS
1-3 8.8 4.7 *** - 6.5 6.3 NS
4+ 68.2 76.2 *** - 69.3 78.7 ***
Don’t Know 22.0 18.6 *** - 23.4 14.6 ***
Delivery:
The following should be
done to prepare for the
birth a child:
Identify in advancethe
health facility where the
baby will be delivered
79.5 87.4 *** 82.9 86.7 *** 83.3 90.2 ***
Save money before
hand for transportation
to reach a health facility
93.3 97.5 *** 94.2 95.9 *** 96.4 96.8 NS
Make all thenecessary
arrangements for home
delivery
65.9 66.9 ns 68.6 65.6 ** 66.7 66.6 NS
Save additional money
for emergencies
94.2 97.8 *** 92.8 96.9 *** 97.6 96.6 *
Diarrhoea:
The following should be
done when a child has
diarrhoea:
Decrease fluid intake 7.1 5.3 *** 7.1 5.3 ** 4.6 6.0 *
Stop food intake 2.8 3.1 ns 2.5 2.7 ns 2.7 3.4 NS
Continue feeding
normal diet
75.7 78.1 ** 70.9 76.7 *** 78.1 73.9 ***
Increasefluid intake 91.3 94.8 *** 88.5 93.1 *** 94.6 93.8 NS
x
= These questions were only asked to women of reproductive age
*= p< 0.05%; ** =p< 0.01%; and *** = p<0.001%; N.S. = not statistically significant.
10. 10
Figure 1: Proportion of survey respondents who believe that newborn babies should be exclusively breastfed for the first six
months
Figure 2: Proportion of women who believe that pregnant women should attend at least four ANC sessions
0
20
40
60
80
100
Female
Male
Females of
reproductive age
(non-exposed vs.
exposed)
65.3
66.2
84.1
83.3 90.2
90
Baseline
Endline
Non-exposed
Exposed
Proportionsof survey respondentswhobelieve that newbornbabiesshouldbe
exclusivelybreastfedforthe first sixmonths
%
0
20
40
60
80
100
Females of
reproductive age Females of
reproductive age -
non-exposed vs.
exposed
68.2
69.3
76.2 78.7
Baseline
Endline
Non-exposed
Exposed
Proportionsof women who believe thatpregnant womenshouldattend at least
four ANC sessions
%
11. 11
Figure 3: Proportion of respondents who believe that it is important to identify in advance the health facility where the baby will
be delivered
3.6 Trends in intended behaviours among the survey population
For the indicatorsmeasuringintended behavioursaroundbreastfeeding,therewasasignificantreduction in
women planning to give their child fluid or food in the first 6 months, from 73.6% at baseline to 46.7% at
endline (p>0.001),and there was a significant difference in intended behaviour for this indicator between
exposed and non-exposed women, at 48.8% vs. 56.4% respectively (p>0.001). There was no significant
difference between the intention to breastfeed their next child at baseline and endline, but there was a
significant difference for the intention to breastfeed their next child between exposed and non-exposed
women 93.3% vs. 90.2% (p<0.05).
There were no significant differences in rates of intended behaviours around ante natal care. There were,
however,improvements inintentiontodelivertheirnextbabyina hospital, at65.4% at baseline vs.71.7% at
endline (p>0.001),anda significantdifference in intention between exposed and non-exposed women, at
72.2% vs. 65.4% (p>0.001). There was alsoa significantreductioninwomenplanning to deliver next baby at
home, from 6.3% at baseline to 2.9% at endline (p>0.001). For indicators measuring intended behaviours
duringthe nextepisode of achild’s diarrhoea,there were significant improvements between baseline and
endline forintentiontocontinue feedingnormal diet:75.1% vs.76.7% (p>0.01), and forintentiontoincrease
foodintake:92.1% vs.96.3% (p>0.001). Aswithknowledge indicators,intendedbehavioural indicators were
high at baseline.
0
20
40
60
80
100
Female
Male
Females of
reproductive age
(non-exposed vs.
exposed)
79.5
82.9 83.3
87.4
86.7 90.2
Baseline
Endline
Proportionsof survey respondentswhobelieve thatit is important to identifyin
advance the healthfacilitywhere the baby will be delivered
% Non-exposed
Exposed
12. 12
Table 7: Targeted intentions among women of reproductive age with children (i) End vs. baseline, and (ii) women
exposed to the campaign vs. women not exposed to the campaign
% Baseline
(N=7315)
% Endline
(N=10221)
Significance % Not
Exposed
(N=4086)
% Exposed
(N=2799)
Significance
Intends to breastfeed
next child
91.2 91.3 NS 90.2 93.3 *
Intends to give child
fluid/food during first 6
months
73.6 46.7 *** 56.4 48.8 ***
Intends to seek
antenatal care
97.3 97.4 NS 97.3 98.1 NS
Intends to deliver in
Hospital 65.4 71.7 *** 65.4 72.2 ***
Health Facility 24.8 24.5 NS 28.5 23.3 *
Home 6.3 2.9 *** 4.5 3.2 0.053
Other 3.4 1.0 *** 1.5 1.3 NS
Continued feeding
normal diet for next
episode of diarrhoea
75.1 76.7 ** 77.3 73.5 **
Increased fluid intake for
next episode of
diarrhoea
92.1 96.3 *** 95.9 96.1 NS
Stop food intake for next
episode of diarrhoea
1.5 1.9 NS 1.6 1.9 NS
*= p< 0.05%; ** =p< 0.01%; and *** = p<0.001%; N.S. = not statistically significant.
Figure 4: Proportion of women of reproductive age who intend to give baby fluid/food during the first six months
0
20
40
60
80
100
Females of reproductive
age Females of reproductive
age: non-exposed vs.
exposed
73.6
56.4
46.7
48.8
Baseline
Endline
Non-exposed
Exposed%
Proportions of women of reproductive age who intend to give baby fluid/food during
the first six months
13. 13
Figure 5: Proportion of women of reproductive age who plan to deliver at hospital
0
20
40
60
80
100
Females of
reproductive age Females of
reproductive age:
non-exposed vs.
exposed
65.4
65.4
71.7 72.2
Baseline
Endline
%
Non-exposed
Exposed
Proportions ofwomen of reproductive age planningto deliverat hospital
14. 14
3.7 Trends in behaviours
Multivariate analysisshowedsomesignificantimprovements in behavioural indicators. For example, 52.6%
reported having made at least four ante-natal care visits for their last pregnancy at baseline compared to
55.9% at endline (p>0.01).The rate among women exposed to the campaign was 57.6% compared to 53.5%
for women not exposed to the campaign (p>0.05). There were also improvements in rates of women
deliveringtheirlastbabyina health facility, at 42.5% vs. 46.1% (p>0.001), and increased fluid intake for last
episode of diarrhoea, at 92.1% vs. 96.3% (p>0.001).
Table 8: Targeted behaviours among women of reproductive age with children (i) End vs. baseline, and (ii)
women exposed to the campaign vs. women not exposed to the campaign
% Baseline
(N=7315)
% Endline
(N=10221)
Significance % Not
Exposed
(N=4086)
% Exposed
(N=2799)
Significance
4+ Antenatal Care
Visits made
52.6 55.9 ** 53.5 57.6 *
Last baby delivered
at health facility /
hospital
42.5 46.1 *** 47.5 46.9 NS
Increased fluid
intake for last
episode of
diarrhoea
92.1 96.3 *** 92.6 94.6 NS
*= p< 0.05%; ** =p< 0.01%; and *** = p<0.001%; N.S. = not statistically significant.
Figure 6: Proportion of women of reproductive age who made 4+ ANC visits during last pregnancy
0
20
40
60
80
100
Females of reproductive age
Females of reproductive age: non-exposed vs. exposed
52.6
53.5
55.9 57.6
Baseline
Endline
Non-exposed
Exposed
Proportionsof women ofreproductive age who made 4+ ANC visitsduring
last pregnancy
15. 15
3.8 Performance of campaign in prompting women to act upon messages
By askingrespondentsif theyhadeitherdiscussedthe campaignwithanyone else,orhadbeen prompted to
visit health centre by the campaign, we were able to assess the campaign’s performance in terms of its
ability to prompt the target audience to take action. This is often a precursor to behaviour change. The
figures in table 9 show that 27.5% of women exposed to the DMI campaign reported having discussed the
spotsor programmeswithsomebodyelse,mostlywiththeirhusband,friendor neighbour. 42.3% of women
exposed to the DMI campaign reported having visited a government health facility in the last 6 months,
35.9% of whom reported that their visit had been prompted by the DMI campaign.
Table 9: Performance of campaign in prompting action - Proportion of women exposed to the DMI campaign
who reported discussing radio spots or programmes with anyone else
n=3131
Yes 27.5%
No/don’t know 72.5%
Who radio spots or programmes were discussed with n=850
Husband 42.2%
Mother or mother-in-law 7.2%
Sister/sister-in-law 11.6%
Friend 40.2%
Neighbour 45.9%
Health worker 3.2%
Don’t know 0.5%
Table 10: Proportion of women exposed to the DMI campaign who visited government health facility in last 6
months
n=3,453
Yes 42.3%
No 57.5%
Don’t know 0.20%
Visit prompted by radio spots or programme n= 1,497
Yes 35.9%
No 63.9%
Don’t know 0.13%
Table 11: Proportion of women exposed to the DMI campaign who had visited government health facility in last
6 months prompted by DMI campaign.
n= 1,497
Yes 35.9%
No 63.9%
Don’t know 0.13%
16. 16
4. Conclusion
The DMI campaign reached 29.6% of all women of reproductive age, and 45.7% of regular female radio
listeners. Amongexposedwomen,there wasgoodrecall of some of the breastfeeding and ante-natal care
messages,butrecall of the diarrhoea-relatedmessages waslower.There issome correlationbetween recall
ratesof messagesandthe corresponding trendsinknowledge,intentionandbehaviourindicators. The most
improved indicators between baseline and endline, and when comparing exposed and non-exposed, are
ante-natal care and exclusive breastfeeding. The results for diarrhoea-related indicators are more
disappointing.
Whilst the results indicate that a good proportion of regular radio listeners (45.7%) were exposed to the
campaign,itwas still significantlylessthanwe had expected,basedonthe resultsof our media analysis. We
were, however, dependent upon broadcasting on Ramogi FMto reach a large part of the target audience.
Ramogi FMis by far the most popular radio station among our target audience (reaching 71.1%). However,
the station increasedthe costof theirairtime tounaffordable levelsjustbefore the campaign started, which
meantthat DMI could onlybroadcaston Ramogi for six weeks at the start and for a month at the end of the
campaign. Los Kari was not broadcast on Ramogi FM. For the majority of the campaign we were therefore
only able toreach listenersof ourotherpartnerstations (RadioNamlolwe,RadioLake Victoria, Radio Sahara
and KBC).None of these stationshave more than 25% listenershipwithin the study population. The success
of anycampaignis directlyrelatedto exposure levels.The loss of airtime on the market leader, Ramogi FM,
therefore meant that the campaign had less impact than would normally be expected.
Significantimprovementscanbe seen betweenbaselineandendline for mostknowledgeindicators,forboth
men and women. For example, the proportion of men who believed that babies should be exclusively
breastfed for the first six months increased from 66.2% to 90.2% (among women this indicator rose from
65.3% to 83.3%).
However, baseline rates for some knowledge indicators were unexpectedly high, leaving little scope for
improvement. Some indicators showed small butstatisticallysignificantimprovements, while in other cases
the differences were not statistically significant.
To helpattribute improvementsinknowledge indicatorstothe DMI campaign, we also compared indicators
between exposed and non-exposed women (at endline). In several cases, especially relating to exclusive
breastfeeding,ante-natalcare and healthcentre deliveries,indicatorsforexposedwomenweresignificantly
higherthanfor non-exposed.Forexample,78.7% of exposedwomenbelievedthat pregnant women should
make at least4 ANCvisits,comparedto69.3% of non-exposed women.Thisimpliesthatthe improvementin
these indicators can be attributed to the DMI campaign. For the diarrhoea treatment indicators, however,
there isno evidence of significantlyhigherknowledgeamongexposedwomen.Infact,fortwo indicators,the
reverse is true, which is difficult to explain.
It is a similar case for the indicators measuring intended and reported behaviour. There has been a
statisticallysignificantimprovementinthe majorityof indicators for intended behaviour between baseline
and endline. Where there have not been improvements, baseline rates were so high that there was very
limitedscope forimprovement:for example, 97.3% of people at baseline intended to seek ante-natal care
during their next pregnancy. When comparing exposed and non-exposed women, there are statistically
17. 17
significantlybetterresultsamongexposedwomenforthe breastfeedingindicators, as well as for half of the
ante-natal care and health centre delivery indicators.
The most important indicator is of course the actual behaviour changes that were achieved. Behavioural
indicatorsare the most difficulttochange,especiallythoserelatedto the utilisation of health services, such
as an ante-natal care visitorgivingbirthina healthfacility.Nevertheless, there were statistically significant
improvementsbetweenbaseline and endline for all indicators measuring reported behaviour. There were
improvementsinratesof women whoreportedhavingmade atleastfourante-natal care visitsfor their last
pregnancy (from 52.6% to 55.9%), delivering their last baby in a health facility (42.5% to. 46.1%) and
increased fluid intake for the last episode of diarrhoea (92.1% to 96.3%). When comparing exposed and
non-exposedwomen,however, there isastatistically significant difference for one indicator only: 57.6% of
exposed women made four or more ante-natal care visits, compared to 53.5% of non-exposed.
In summary, there is clear evidence to suggest that the DMI campaign has improved knowledge, intended
behavioursandreportedbehaviouraroundanumberof indicators. The campaignhas had a lower impact on
indicatorsthan hopedfor,whichis explainedpartlybyhighexistinglevelsof knowledge and behaviour, and
partlyby the withdrawal of affordableairtimeby RadioRamogi.Nonetheless, significantimprovementswere
achieved.
5. Estimatedimpact on childmortality of campaign
We usedthe DMI-LSHTM mathematical modeltoselect the healthtopicsand messageswiththe greatest
impact(andthus the bestvalue formoney).
Figure 7 showsthe model’spredictions astheywere calculatedduringthe campaigndesignphase inearly
2010. These predictionswere basedonthe assumption thatwe could reach83% of the targetpopulation,
giventhe highmediapenetrationrate inNyanzaandthe coverage of our selected broadcastpartners.The
model predicteda9.6% reductioninunder-5mortality, if wereable tocampaignforthree full years,ata
cost of $4.73 per DALY averted byyearthree.We assumeda thirdof thisimpactinthe firstyear of
campaigning,andsopredicted a3.2% reduction inchildmortalityduringthe firstfull yearof campaigning.
Figure 7: The DMI-LSHTM model’s original predictions on DMI's campaign's impact on mortality (from year 3) - based
on predicted media penetration at start of campaign
Total
under-5
deaths
Media
penetration
Total
annual
deaths
averted
(year 3
on)*
%
reduction
in child
mortality
(year 3 on)
Annual
cost of
project
(USD,
years 1-3)
Cost per
DALY
saved,
years 1-2,
discounted
Cost per
DALY
saved, year
3,
discounted
at 3%
Nyanza 35,955 83% 3,458 9.6% $450,000 $23.63 $4.73
These predictionsneededtobe revisedtotake intoaccounta numberof factors. Firstly,the actual media
coverage achievedwas30%,not 83% (forreasonsdiscussedabove),whichreducedthe predicted reduction
on mortalityto5.4%. Secondly,we correctedan errorin the formulapredictingthe impactonneonatal lives,
18. 18
whichreduced the impactonmortality from5.4% to 3.2%. Thirdly,we removedthe impactof increased
coverage of insecticide-treatednets fromthe model calculations2
,reducingourpredictedimpactto2.4%.
Figure 8 showsthe predictedimpactbasedonthree yearsof campaigning,actual mediacoverage achieved
and the assumptions described above.Childmortalitywouldbe reducedby2.4% at a cost per DALY averted
of $18.75 fromyear three of campaigning.
Figure 8: The DMI-LSHTM’s model predictions on DMI's campaign's impact on mortality (from year 3) - based on
actual media penetration achieved
Total
under-5
deaths
Media
penetration
Total
annual
deaths
averted
(year 3
on)*
%
reduction
in child
mortality
(year 3 on)
Annual
cost of
project
(USD,
years 1-3)
Cost per
DALY
saved,
years 1-2,
discounted
Cost per
DALY
saved, year
3,
discounted
at 3%
Nyanza 35,955 30% 872 2.4% $450,000 $93.73 $18.75
Giventhatthe researchpresentedinthisreportdocumentsactual ratherthanpredictedchangesin
behaviour,we are takingadifferentapproachtothe estimate of the actual reductioninchildmortality. We
can inputthe behaviourchange measured 3 4
byour evaluation directly intothe Lancet2003 ChildSurvival
Series’mathematical modelinordertocalculate how manychildren’sliveswere savedoverthe campaign
period,andthe resultantreduction inmortality.The resultscanbe seeninfigure 9. Thismodel estimates
that a total of 1,944 deathswere averted, representinga5.4% reductioninchildmortality,at a cost per
DALY avertedof $8.385
.
2
The original predictions assumed increasedusage of ITNs alongside increaseduptake ofante-natalcare, as pregnant women are
often givenfree ITNs and counsellingon their use during ante-natal care. Upon further reflection, we considered thisto be an
overestimationof our impact upon malaria-relatedchilddeaths, andthus removed it from our calculations, reducing our pre dicted
impact from 3.2% to 2.4%.We continued, however, to assume that our campaignmessages wouldincrease coverage ofthe following
interventions:protectionagainst tetanus toxoid, Intermittent Preventative Treatment (IPT) for malaria inpregnancy, ande mergency
obstetric care. Our LSHTMepidemiologist judgedthese three interventions to be widelyavailable at Nyanza’s health facilities during
the project’s designphase.
3
The behaviour change estimate for exclusive breastfeedingwas based upon the indicator measuring intentionto exclusively
breastfeed a woman’s next baby. The sample size ofwomen currentlybreastfeeding babies aged0-6 months was too small to
measure significant differences betweenratesof exclusive breastfeedingat baseline andendline. To account for the assumed
difference in intendedbehaviour andactual reportedbehaviour, we have estimatedbehaviour change at 50% of intendedbehaviour
change. Thisis consistent withevidence from a large number ofprevious campaigns.
4
For the ante-natal care indicator, the Lancet ChildSurvival 2003 Series uses the indicator “attendance of at least 1 ante natalcare
sessionwitha skilled health provider”. Fromthe DMI campaignevaluation, we onlyhave data for the indicator “attendance of 4 or
more ante natal care sessionwitha skilledhealthprovider”, andhave therefore input the data based onthisindicator. It is possible
that this has ledto an underestimation ofimpact, since it is reasonable to expect better healthoutcomes for a pregnant woman
attending four sessions rather than one session.
5
To be conservative we assumedthat our messages didnot increase the coverage of ITPor protection against tetanus toxoid.
According to the model, includingthese two interventions wouldonlyreduce childmortalitybya further 0.1%. We continuedto
assume that our messages wouldincrease coverage ofemergencyobstetric care, linkedto the reportedincrease in healthfacility
births. Withinthe model, the coverage rate for emergencyobstetric care is derived fromthe coverage rate of healthfacility
deliveries.
19. 19
Figure 9: Estimate of lives saved and resultant reduction in child mortality delivered by the DMI campaign, as
calculated by the Lancet Child Survival Series 2003'smathematical model
Deaths averted by cause
Total
under-5
deaths Diarrhoea Pneumonia Malaria Neonatal
Total
deaths
averted
% reduction
in child
mortality
Cost of
project
Cost per
DALY
Nyanza 35,955 1,265 463 0 216 1,944 5.4% $450,000 $8.38
The numbers of livessavedinfigure 9are no longerpredictions of campaignimpact,butare the resultsof
calculationsinthe Lancet2003 ChildSurvival modelbasedonbehaviourchange measuredbetweenbaseline
and endline.
Of course,these impactfiguresdependonthe assumptionthatthis campaigncausedthe behaviourchanges.
It alsoassumesthatreportedbehaviourreflectsactual behaviourandthatinthe case of breastfeeding,
intendedbehaviourchange isequivalentto50% of actual behaviourchange (see footnote3).
In conclusion,despite the campaignachievinglowerthanexpectedmediapenetration, anddespite the
campaignbeingbroadcastforjust one yearrather thanthe three yearsassumedbythe model,our
calculationsindicate thatalmost2,000 liveswere savedbythe campaignata costof just$8.38 perDALY.
Thisrepresentsahighlycost-effectiveinvestmentbyourfunders,and demonstratesthatmassmedia
campaigns– eveninthe most difficultcircumstances –can be a powerful agentforsavinglives.
20. 20
APPENDIX 1: QUESTIONSFOR ADDITION TO THE DSS
Knowledge Questions:To be administeredto male and female respondentsaged15-45 in the household
interview(September2010, and May 2011)
State whether you agree or disagree with the following statements:
Agree Disagree Not Sure
Q101 New born babies should beexclusively breastfed for the first
six months
1 2 8
Q102 The followingshould bedone when a child has diarrhoea
A - Decrease fluid intake 1 2 8
B - Stop food intake 1 2 8
C - Continue feeding normal diet 1 2 8
D - Increasefluid intake 1 2 8
Q103 As soon as a woman finds out she is pregnantshe should
seek ante natal care
1 2 8
Q104 The followingshould bedone to prepare for the birth a child:
A - Identify in advancethe health facility where the
baby will be delivered
1 2 8
B - Save money before hand for transportation to reach
a health facility
1 2 8
C - Make all thenecessary arrangements for home
delivery
1 2 8
D - Save additional money for emergencies 1 2 8
21. 21
BEHAVIOUR AND INTENTION QUESTIONS: To be administered to women of reproductive age 15-45 (September
2010, and May 2011)
I WILL NOW ASK SOME MORE DETAILS ON YOUR LAST PREGNANCY THAT RESULTED IN A LIVE BIRTH
Ante Natal Care and Deliveries at Health Care Facilities
Q201Where did you give birth to (NAME)? HOSPITAL 1
HEALTH FACILITY 2
HOME 3
OTHER 8
Q202How many times during the pregnancy
did you seek antenatal care?
IF RESPONDENT DID NOT VISIT ANC
ENTER 0
_____________ (enter number ofvisits)
Q203If you were to have another baby where
do you plan to deliver?
DO NOT INTEND TO HAVE
ANOTHER BABY
HOSPITAL
0
1
HEALTH FACILITY 2
HOME 3
OTHER 8
Q204Do you intend to seek ante natal care for
a future pregnancy?
YES 1
NO 2
DON’T KNOW 8
Q205How many ante natal care visits do
you think a woman should make when
she is pregnant? _____________ (enter number ofvisits)
22. 22
Exclusive Breastfeeding
Q206Please tell me if youagree or
disagree withthe following
statement:“Breastmilkwith
colostrum(yellowmilk) improves
a babieshealthandhelpsfight
disease “
Agree Disagree Not Sure
1 2 8
Q207Are you currently breastfeeding
(NAME)?
IF NO SKIP TO Q210
YES 1
NO 2
Q208How many months have you breastfed
(NAME)?
_____________ (enter number ofmonths)
Q209AHave you given (NAME) any other fluids
or foods during this time?
YES 1
NO 2
DON’T KNOW 8
Q209BIf Yes, how old was your baby when you
introduced fluids….
…..food?
_____________ (enter number ofmonths for fluids)
_____________ (enter number ofmonths for food)
Q210Do you plan to breastfeed your next
child?
If No or DK skip to Q213
YES 1
NO 2
DON’T KNOW 8
Q211How many months do you intend to
breastfeed your child?
IF LESS THAN 6 MONTHS SKIP TO
Q207
_____________ (enter number ofmonths)
Q212Will you give your child any other fluids /
food during the first six months of
breastfeeding?
YES 1
NO 2
DON’T KNOW 8
23. 23
Treatment of Diarrhoea
Q213The lasttime (NAME) had diarrhoea
what steps did you take?
Yes No Not Sure
Has not had
diarrhoea
1 2 8
Increase fluid
intake
1 2 8
Stop food
intake
1 2 8
Continue feeding
normal diet
1 2 8
Q214The next time your child (one of your
children) has diarrhoea,whatsteps will
you take?
Yes No Not Sure
Increase fluid
intake
1 2 8
Stop food intake 1 2 8
Continue feeding
normal diet
1 2 8
24. 24
EXPOSURE TO DMI CAMPAIGN (TO BE INSERTED IN DSS MAY 2010)
301 How oftendoyoulistentothe
radio?
SINGLE CHOICE
01: everyday
02: a few times a week
03: a few times a month
04: not at all
98 DK
99 NR
302 Whichof these radiostationsdo
youlistentomost often?
MULTIPLE CHOICE – SHOWLIST
01: Radio Namlolwe
02: Radio Lake Victoria (Osienala)
03: Ramogi FM
04: KBC
05: Radio Sahara
06: Radio Citizen
07: Other(s) ( Please specify)
98 DK
99 NR
302.a Have you heardanythingonthe
radioabout maternal andchild
healthinthe lastsix months?
SINGLE CHOICE
01: Yes – radio program
02: Yes- radio spots
03: Yes; both
04: No
98 DK
99 NR
IF 4, 98
or 99
END
INTERVI
EW
25. 25
303 What have youheard?
(SPONANEOUSRECALL– DO NOT
SHOW LIST)
01: Los Kari, Dak Maber, Ngima Maber
02: Radio spots/shows with quizzes,chances to win prizes
03: Radio show with Jael and Jared
04: Radio drama featuring Min Garang' n Prof, Nya Loka or
Orinda
05: Radio spots with men talking at the bar
06: ORS Okoa
07: Malezi Bora
08: Ya mama ni poa
09: Other ( Please specify) _______________
98 DK
99 NR
IF NO to
01 GO
TO 304,
IF YES
TO 01
TO 05
SKIP TO
305
304 Do yourememberinghearingany
of the followinginthe lastsix
months?(READOUT RESPONSES) 01: Los Kari, Dak Maber, Ngima
Maber
02: Radio spots/shows with quizzes,
chances to win prizes
03: Radio show with Jael and Jared
04: Radio drama featuring Min
Garang' n Prof, Nya Loka or Orinda
05: Radio spots with men talking at
the bar
06: ORS Okoa
07: Malezi Bora
08: Ya mama ni poa
09: Other ( Please specify-------------)
10: None
98 DK
99 NR
If 6, 7, 8,
9, 10, 98
or 99
END
INTERVI
EW
26. 26
305 Where do yourememberhearing
these radio slogans/recordings?
01: Long radio programme
02: Radio spots
03: Both (radio programme and radio spots)
04: Word of mouth
98 DK
99 NR
IF4 skip
308
306 ASKIF 304 = 02 OR 03
How manytimeshave youheard
the short spotswiththisslogan?
Enter the amount _______
98 DK
99 NR
307 ASKIF 304 = 01 OR 03
How manytimeshave youheard
the longradio programme withthis
slogan?
(if Yesto longprogramme)
Enter the amount ______
98 DK
99 NR
308 What are the mainmessagesyou
can recall about these maternal
and childhealthradioprograms
and spots ? (NOTPROMPTED,
MULTIPLE ANSWERSPOSSIBLE)
1. That husbands should accompanytheir
wives to the clinic for ANC and deliveries
2. That it’s importantto go for ANC at least4
times
3. It’s importantto plan ahead for delivery
4. It’s importantto deliver in a health facility
5. It can be dangerous to deliver at home
6. It’s importantto breastfeed exclusively for 6
months
7. Babies don’tneed anything but breastmilk
8. The first milk,colostrum,is very good for
babies
9. Give lots of fluids/clean water to a child with
diarrhoea
10. Continue normal feeding and fluids when a
child has diarrhoea
11. Other ( Please specify) _________
98 DK
99 NR ______
27. 27
309 Have you talked to anyone about ANY
of the radio programmes or spots you
heard?
01 Yes
02 No
98 DK 99 NR
IF 2 SKIP
TO 311
310 To whom have you talked to about
these programmes or spots?
(MULTIPLE RESPONSE POSSIBLE)
01: Husband
02 : Mother in law/mother
03 : Sister in law/sister
04 : Neighbour
05 : Friend
06 : Health Worker
07 : Other ( Please specify) _______________
98 DK
99 NR
311 ASK ALL
In the past 6 months, have you visited a
governmenthealth facility?
01: Yes
02: No
98 DK
99 NR
.312 ASK ONLY IF ANSWERED Q5
Was your visit prompted by one of
these radio programmes or spots?
01: Yes
02: No
98 DK
99 NR
28. 28
APPENDIX 2: RADIO LISTENING RATES
Table 1: Radio listening rates among women of reproductive age (15-49 years) by age group
n= 10,053 Everyday Few times a
week
Few times a
month
Not at all Don’t know
15-19 46% 17.2% 7.7% 26% 3.1%
20-24 49.8% 18.4% 5.2% 25.5% 1.1%
25-29 48.7% 18% 5.7% 26.3% 1.3%
30-34 45.5% 19.3% 7.5% 26.2% 1.4%
35-39 45.5% 18.3% 7.1% 27.1% 2.1%
40-44 45% 18.1% 6.9% 28% 2.1%
45-49 41.6% 20% 5% 31.6% 1.9%
Total 46.4% 18.5% 6.3% 27.1% 1.7%
Table 2: Radio listening rates among women of reproductive age (15-49 years) by socio-economic status
N=9,471 Everyday Few times a
week
Few times a
month
Not at all Don’t know
Socio-Economic
Status
Lowest 31.9% 17.1% 6.8% 42.1% 2.1%
Second 39% 19% 7.6% 32.6% 1.9%
Middle 46.5% 17.9% 6.9% 27.1% 1.6%
Fourth 50.2% 19.6% 6.3% 22.5% 1.6%
Highest 55.7% 19% 4.7% 19.2% 1.4%
Total 46.4% 18.6% 6.3% 27% 1.7%