GDP
•Download as DOCX, PDF•
0 likes•483 views

GDP of various country and his growth rate chat

Recommended
More Related Content
What's hot
What's hot (20)
Viewers also liked
Viewers also liked (20)
Similar to GDP
Similar to GDP (20)
Recently uploaded
Recently uploaded (20)
GDP
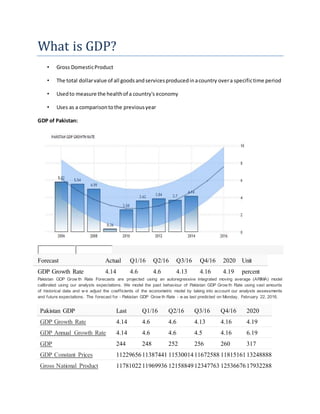
- 1. What is GDP? • Gross DomesticProduct • The total dollarvalue of all goodsandservicesproducedinacountry overa specifictime period • Usedto measure the healthof a country's economy • Uses as a comparisontothe previousyear GDP of Pakistan: Forecast Actual Q1/16 Q2/16 Q3/16 Q4/16 2020 Unit GDP Growth Rate 4.14 4.6 4.6 4.13 4.16 4.19 percent Pakistan GDP Grow th Rate Forecasts are projected using an autoregressive integrated moving average (ARIMA) model calibrated using our analysts expectations. We model the past behaviour of Pakistan GDP Grow th Rate using vast amounts of historical data and w e adjust the coefficients of the econometric model by taking into account our analysts assessments and future expectations. The forecast for - Pakistan GDP Grow th Rate - w as last predicted on Monday, February 22, 2016. Pakistan GDP Last Q1/16 Q2/16 Q3/16 Q4/16 2020 GDP Growth Rate 4.14 4.6 4.6 4.13 4.16 4.19 GDP Annual Growth Rate 4.14 4.6 4.6 4.5 4.16 6.19 GDP 244 248 252 256 260 317 GDP Constant Prices 1122965611387441 1153001411672588 1181516113248888 Gross National Product 1178102211969936 1215884912347763 1253667617932288
- 2. Pakistan GDP Last Q1/16 Q2/16 Q3/16 Q4/16 2020 Gross Fixed Capital Formation 1503731 1479371 1500553 1521734 1542916 1298133 GDP per capita 819 815 826 836 846 980 GDP per capita PPP 4619 4613 4646 4678 4711 5290 GDP From Agriculture 2222337 2222798 2238337 2253876 2269414 2504801 GDP From Construction 259271 255476 253075 250673 248272 244693 GDP From Manufacturing 1412453 1415188 1423253 1431318 1439383 1542113 GDP From Mining 311095 308606 304413 300219 296026 287723 GDP From Services 6261314 6295761 6354294 6412827 6471360 7397192 GDP From Transport 1421737 1435697 1449843 1463989 1478135 1744882 Bangladesh GDP Growth Rate 1994-2016 | Data | Chart | The Gross Domestic Product (GDP) in Bangladesh expanded 6.12 percent in 2014 fromthe previous year. GDP Growth Rate in Bangladesh averaged 5.61 percent from1994 until 2014, reaching an all time high of 6.63 percent in 2006 and a record low of 4.08 percent in 1994. GDP Growth Rate in Bangladesh is reported by the Bangladesh Bank. 1Y5Y10YMAX Export Data API Access
- 3. China GDP Annual Growth Rate 1989-2016 | Data | Chart | The Chinese economy grew an annual 6.8 percent in the fourth quarter of 2015, slightly down from6.9 percent in the previous quarter and the weakest since the first quarter of 2009. The figure was in line with market expectations as strength in servicesandconsumption offset weaker manufacturing and exports. For full year of 2015, GDP expanded by 6.9 percent,lowerthan 7.3 percent in 2014 and the weakest growth in 25 years.The governmenttargeted the economy to expand at around 7.0 percent for the year. GDP Annual Growth Rate in China averaged 9.88 percent from 1989 until 2015, reaching an alltime high of 15.40 percent in the first quarter of 1993 and a record low of 3.80 percent in the fourth quarter of 1990. GDP Annual Growth Rate in China is reported by the National Bureau of Statistics of China. 1Y5Y10YMAX Export Data API Access Actual Previous Highest Lowest Dates Unit Frequency 6.80 6.90 15.40 3.80 1989 - 2015 percent Quarterly India GDP Annual Growth Rate 1951-2016 | Data | Chart | Calendar The Indian economy expanded 7.3 percent year-on-year in the last three months of 2015, slowing froman upwardly revised 7.7 percent growthin the previousquarterbut in line with market expectations. The manufacturing sector surged 12.6 percent while farm output shrank1percent.GDP AnnualGrowth Rate in India averaged 6.04 percent from1951 until 2015, reaching an alltime high of 11.40 percent in the first quarterof2010 and a record low of -5.20 percent in the fourth quarter of 1979. GDP Annual Growth Rate in India is reported by the Ministry of Statistics and Programme Implementation (MOSPI)
- 4. Export Data API Access Actual Previous Highest Lowest Dates Unit Frequency 7.30 7.40 11.40 -5.20 1951 - 2015 percent Quarterly NSA, 2011-12 Prices Sri Lanka GDP Growth Rate 2003-2016 | Data | Chart The Gross Domestic Product (GDP) in Sri Lanka expanded 4.82 percent in the third quarter of 2015 over the same period in the previous year. GDP Growth Rate in Sri Lanka averaged 6.22 percent from 2003 until 2015, reaching an all time high of 16.12 percent in the first quarter of 2012 and a record low of 0.48 percent in the fourth quarter of 2013. GDP Growth Rate in Sri Lanka is reported by the Department of Census and Statistics - Sri Lanka. Actual Previous Highest Lowest Dates Unit Frequency 4.82 6.01 16.12 0.48 2003 - 2015 percent Quarterly Australia GDP Annual Growth Rate 1960-2016 | Data | Chart | Calendar The Gross Domestic Product (GDP) in Australia expanded2.50 percent in the third quarter of 2015 over the same quarter of the previous year. GDP Annual Growth Rate in Australia averaged 3.49 percent from1960 until 2015, reaching an all time high of 9 percent in the first quarter of 1967 and a record low of -3.40 percent in the second quarter of 1983. GDP Annual Growth Rate in Australia is reported by the Australian Bureau of Statistics. Export Data API Access
- 5. Actual Previous Highest Lowest Dates Unit Frequency 2.50 2.00 9.00 -3.40 1960 - 2015 percent Quarterly Malaysia GDP GrowthRate 2000-2016 | Data | Chart | Calendar | The Gross Domestic Product (GDP) in Malaysia expanded 1.50 percent in the fourth quarter of 2015 over the previous quarter,accelerating froma 0.7 percent rise in the previous period. GDP Growth Rate in Malaysia averaged 1.29 percent from 2000 until 2015, reaching an all time high of 5.90 percent in the third quarter of 2009 and a record low of -7.60 percent in the first quarter of 2009. GDP Growth Rate in Malaysia is reported by the Department of Statistics Malaysia. API Access Actual Previous Highest Lowest Dates Unit Frequency 1.50 0.70 5.90 -7.60 2000 - 2015 percent Quarterly South Korea GDP GrowthRate 1970-2016 | Data | Chart| Calendar The South Korean economy advanced 0.6percent on quarterin the the three months to December of 2015, easing froma 1.3 percent expansion in the previous period while staying slightly below market expectations, first estimates showed. Household consumption and government expenditure were the main drivers of growth while construction investment contracted sharply. GDP Growth Rate in South Korea averaged 1.68 percent from1970 until 2015, reaching an all time high of 6.80 percent in the first quarter of 1988 and a record low of -7 percent in the first quarter of 1998. GDP Growth Rate in South Korea is reported by the The Bank of Korea
- 6. Export Data API Access Actual Previous Highest Lowest Dates Unit Frequency 0.60 1.30 6.80 -7.00 1970 - 2015 percent Quarterly United Kingdom GDP Growth Rate 1955-2016 | Data | Chart | Calendar The British economy advanced 0.5 percent on quarter in the last three months of 2015, accelerating froma 0.4 percent growth in the previous periodand in line with market expectations, preliminary estimates showed. Considering full 2015, the GDP grew 2.2 percent, lower than 2.9 percent in 2014. GDP Growth Rate in the United Kingdom averaged 0.61 percent from 1955 until 2015, reaching an all time high of 5 percent in the first quarter of 1973 and a record low of -2.70 percent in the first quarter of 1974. GDP Growth Rate in the United Kingdom is reported by the Office for National Statistics.
- 7. Export Data API Access Actual Previous Highest Lowest Dates Unit Frequency 0.50 0.40 5.00 -2.70 1955 - 2015 percent Quarterly United States GDP GrowthRate 1947-2016 | Data | Chart | Calendar The US economy expanded an annualized 0.7 percent on quarter in the last three months of 2015, lower than a 2 percent expansion in the previous period and slightly below market expectations of 0.8 percent, according to the advanced estimate released by the BureauofEconomic Analysis. The increase in real GDP in the fourth quarter primarily reflected positive contributions from personal consumption expenditures (PCE), residential fixed investment, and federal government spending that were partly offset by negative contributions fromprivate inventory investment, exports, and nonresidentialfixed investment.Imports,which are a subtraction in the calculation of GDP, increased. GDP Growth Rate in the United States averaged 3.24 percent from 1947 until 2015, reaching an all time high of 16.90 percent in the first quarter of 1950 and a record low of -10 percent in the first quarter of 1958. GDP Growth Rate in the United States is reported by the U.S. Bureau of Economic Analysis.
- 8. Export Data API Access Actual Previous Highest Lowest Dates Unit Frequency 0.70 2.00 16.90 -10.00 1947 - 2015 percent Quarterly