A Water Conservation Handbook for Idaho and Eastern Washington
10.1.1.129.7394
1. 1
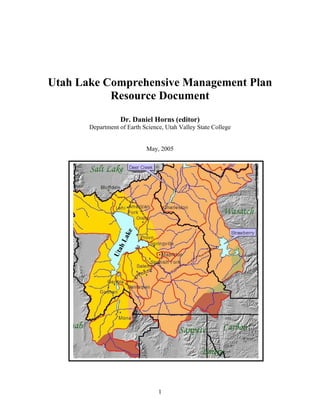
Utah Lake Comprehensive Management Plan
Resource Document
Dr. Daniel Horns (editor)
Department of Earth Science, Utah Valley State College
May, 2005
UtahLake
UtahLake
2. 2
Table of Contents
Table of Contents............................................................................................................................ 2
List of Figures................................................................................................................................. 4
1.0 Purpose and Scope.............................................................................................................. 5
2.0 Executive Summary (Daniel Horns and Sam Rushforth; Utah Valley State College)....... 5
3.0 Geographic Setting and Physical Characteristics (Ben Erickson and Daniel Horns; Utah
Valley State College).......................................................................................................... 8
3.1 Introduction and Physical Characteristics....................................................................... 8
3.3 Sediments within Utah Lake......................................................................................... 13
3.3.1 Composition of Sediment in Utah Lake.................................................................... 14
3.3.2 Rate of Sediment Accumulation............................................................................... 16
4.0 Hydrology of Utah Lake (Cami Litchford, Jim Callison, and Daniel Horns; Utah Valley
State College).................................................................................................................... 17
4.1 Inflow............................................................................................................................ 18
4.1.1 Precipitation.............................................................................................................. 18
4.1.2 Surface Flow (Streams and Wastewater Treatment Plants)...................................... 18
4.1.3 Groundwater and Springs ......................................................................................... 23
4.1.4 History of Human Impact on Utah Lake’s Inflow.................................................... 23
4.2 Outflow ......................................................................................................................... 25
4.2.1 Surface Water............................................................................................................ 25
4.2.2 Evaporation............................................................................................................... 25
4.2.3 History of Human Impact on Utah Lake’s Outflow ................................................. 25
4.3 Lake Levels................................................................................................................... 26
5.0 Water Quality (W. John Calder, Katherine Klauzer, Eddy Cadet, Jim Callison, Daniel
Horns; Utah Valley State College) ................................................................................... 29
5.1 Water Quality of Tributaries......................................................................................... 29
5.2 Water Quality of Groundwater and Springs ................................................................. 32
5.3 Lake Water Quality....................................................................................................... 32
5.3.1 Phosphorous in Utah Lake........................................................................................ 36
5.3.2 Total Dissolved Solids (TDS) in Utah Lake............................................................. 38
5.3.3. Eutrophic Condition.................................................................................................. 42
5.3.4 Turbidity ................................................................................................................... 42
5.4 Nonpoint Sources of Pollution in the Utah Lake Drainage .......................................... 43
5.4.1 Introduction to Nonpoint Source Pollution............................................................... 43
5.4.2 Agricultural NPS’s in the Utah Lake Drainage Basin .............................................. 43
5.4.3 Sediment from NPS’s in the Utah Lake Drainage Basin.......................................... 43
5.4.4 NPS’s Associated with Urbanization in the Utah Lake Drainage Basin .................. 44
5.5 Water-Related Planning Efforts in the Utah Lake Basin (Katherine Klauzer, Eddy
Cadet, Daniel Horns) ................................................................................................................ 45
5.5.1 Utah’s Programs for Nonpoint Source Regulation................................................... 45
5.5.2 Implications of the Federal Clean Water Act for Nonpoint Source Pollution.......... 46
5.5.3 The TMDL Process................................................................................................... 46
6.0 Commercial and Cultural Activities (Darwin Demming, Emily Bartlett, Shayne
Galloway, Daniel Horns; Utah Valley State College) ...................................................... 48
6.1 Mining Activities within and near Utah Lake............................................................... 48
3. 3
6.1.1 Large Mines .............................................................................................................. 48
6.1.2 Small Mines .............................................................................................................. 49
6.1.3 Hydrocarbon Potential .............................................................................................. 49
6.2 Recreation ..................................................................................................................... 51
6.2.1 Recreation History .................................................................................................... 51
6.2.2 Estimates of Recreation Use Numbers on Utah Lake............................................... 54
6.2.3 Utah Lake Recreation Decline.................................................................................. 57
6.2.4 Perceptions of Utah Lake.......................................................................................... 59
6.2.5 Current Recreational Activities on Utah Lake.......................................................... 60
6.2.6 Future of Recreation on Utah Lake........................................................................... 62
6.3 Cultural Facilities near Utah Lake................................................................................ 62
7.0 Biology of Utah Lake (Donna Barnes, Catherine Stephen, Zach Peterson, Sam Rushforth;
Utah Valley State College) ............................................................................................... 68
7.1 Phytoplankton of Utah Lake......................................................................................... 69
7.1.1 Influencing Factors ................................................................................................... 69
7.1.2 Method of Studies..................................................................................................... 70
7.1.3 Phytoplankton Division and Orders.......................................................................... 70
7.2 Macroinvertebrates and Zooplankton of Utah Lake ..................................................... 71
7.2.1 Zooplankton of Utah Lake........................................................................................ 72
7.2.2 Other Macroinvertebrates of Utah Lake ................................................................... 74
7.3 Birds of Utah Lake........................................................................................................ 75
7.3.1 Habitat loss and species decline................................................................................ 75
7.3.2 Bird Populations........................................................................................................ 76
7.4 Fishes of Utah Lake ...................................................................................................... 78
7.4.1 Biology of Utah Lake Fishes .................................................................................... 79
7.4.2 Game Fish................................................................................................................. 79
7.5 Mammals of Utah Lake ................................................................................................ 82
7.5.1 Insectivores ............................................................................................................... 83
7.5.2 Bats ........................................................................................................................... 83
7.5.3 Rabbits ...................................................................................................................... 84
7.5.4 Rodents ..................................................................................................................... 85
7.5.5 Carnivores................................................................................................................. 87
7.5.6 Hoofed Mammals...................................................................................................... 89
7.6 Utah Lake Wetlands, Flora and Fauna.......................................................................... 89
7.6.1 Pond Weed Community............................................................................................ 90
7.6.2 Bulrush Cattail Marsh............................................................................................... 91
7.6.3 Spikerush-Bulrush Meadow...................................................................................... 91
7.6.4 Grass-Rush-Sedge Meadow...................................................................................... 92
7.6.5 Lowland Woody Community ................................................................................... 92
7.6.6 Saline Terrestrial Community................................................................................... 92
7.6.7 Annual Herbaceous Community............................................................................... 93
7.7 Special Designations..................................................................................................... 93
7.8 Threatened and Endangered Species ............................................................................ 98
References................................................................................................................................... 102
4. 4
List of Figures
3.1 - Utah Lake and its drainage basin…………………………………….. Page 9
3.2 – Utah Lake bathymetry……………………………………………….. Page 10
3.3 – Major features of Utah Lake………………………............................ Page 11
3.4 – Concentrations of Calcite within the lake-bottom sediments……….. Page 15
4.1 – Utah Lake tributaries………………………………………………... Page 20
4.2 – Utah Lake stage, 1930 through middle 2004……………………........Page 28
5.1 – Utah Lake TDS concentration VS stage …………………………….. Page 39
6.1 – Location of Mining sites near Utah Lake………………………….... Page 50
Chart 1 – Recreation Use Count for Utah Lake State Park………………... Page 56
Chart 2 – Recreation Use by Category and Season………………………... Page 58
6.2 – Archaeological sites along the shore of Utah Lake ……………..…....Page 64
6.3 – Isolated finds along the shore of Utah Lake ……………..…......….... Page 65
List of Tables
4.1 – Yearly inflow to Utah Lake………………………………………….. Page 21
4.2 – Tributary flow data for 1979 water year……………………………...Page 21
4.3 – Stream flow data for the major Utah Lake tributaries………………...Page 22
4.4 – Significant diversions from Utah Lake tributaries…………………....Page 27
5.1 – Water quality data for Utah Lake tributaries………………………… Page 30
5.2 – Tributary average TDS concentrations and total loads……………… Page 31
5.3 – Tributary average phosphorous concentrations and total load………. Page 31
5.4 – Average Utah Lake water quality data………………………………..Page 34-35
5.5 – Total phosphorous concentrations from several stations……………. Page 37
5.6 – TDS values for several stations in Utah Lake……………………….. Page 40-41
6.1 – Resort History on Utah Lake………………………………………. Page 53
6.2 – Recreation use counts for Utah Lake State Park……………………. Page 55
6.3 – Percentage of Recreation use by activity and Season………………. Page 55
6.4 – Archaeological sites identified by Janetski (2004) ………………… Page 66
6.5 - Isolated finds described in Janetski (2004) ………………………..… Page 67
7.1 - Bird counts in the Goshen Bay Important Bird Area……………..… Page 96
7.2 - Bird counts in the Provo Bay Important Bird Area……………..… Page 97
7.3 – Habitats utilized for foraging and nesting………………………..… Page 101
5. 5
1.0 Purpose and Scope
This report was written at the request of the Utah Division of Forestry, Fire, and State
Lands. The report is intended to present a summary of the current conditions of Utah Lake,
including the composition of sediments being deposited in the lake, the rate of deposition of the
sediments, the hydrology of the lake (including estimates of net inflows and outflows), the
quality of water in the lake, factors in the drainage basin that may effect the water quality, the
flora and fauna of the lake (including associated wetlands), special biological designations within
and adjacent to the lake, threatened and endangered species that depend on the lake, human use
of the lake (including, if applicable, recreation, industry, agriculture, and mining), and local
planning and zoning that may affect the lake. This information came from reviews of published
literature and available unpublished reports and from interviews with knowledgeable individuals.
This report includes no original research.
2.0 Executive Summary (Daniel Horns and Sam Rushforth; Utah Valley State College)
Utah Lake, the largest fresh water lake in the United States west of the Mississippi, is
located in the midst of an arid land (Heckmann and Merritt, 1981; Sowby and Berg Consultants,
and others, 1999). As such, the lake plays a crucial role as a source of irrigation water, a
recreation destination, a biological habitat, and as an aesthetic component of Utah Valley. Rapid
urbanization around the lake has the potential to impact each one of these roles. Potential
impacts include degraded water quality and degraded habitat quality. Despite the lake’s
important economic and biological roles and the potential threats to these roles, there have been
few published studies of the lake. A series of geological, hydrological, and biological studies,
mainly during the 1970’s, culminated in the publication in 1981 of the Utah Lake Monograph
(Great Basin Naturalist Memoirs, Number 5, Brigham Young University). Since that time, most
studies of the lake have been written as reports for governmental agencies (e.g., Sowby and Berg
Consultants, and others, 1999; Central Utah Water Conservancy District, 2004a, b, c, d), or have
been conducted by local individuals and not yet published up at all (e.g., Merritt, 2004a, b, c, and
d; Miller, oral communication, 2004).
Utah Lake occupies the lowest portions of Utah Valley, a sediment-filled basin near the
eastern edge of the Basin and Range physiographic province (Jackson and Stevens, 1981). The
sediments that fill the basin were eroded from the nearby mountains and deposited in lakes,
6. 6
floodplains, and stream channels within Utah Valley. Between about 25,000 and 10,000 years
ago, the basin was occupied by Lake Bonneville (Curry and others, 1984). Sediments deposited
within Lake Bonneville created a very flat lake bottom. As a result of climate change, the level
of Lake Bonneville dropped, resulting in the present-day Utah Lake and Great Salt Lake.
Because the Lake Bonneville sediments produced such a flat base of Utah Valley, Utah Lake is
remarkably shallow. At average water levels, the average depth of the lake is just 9.2 feet
(Brimhall and Merritt, 1981). During drought years, the average depth is even shallower.
Sediment being deposited within Utah Lake primarily consists of calcium carbonate, with
lesser amounts of quartz and clay (Brimhall and Merritt, 1981). The rate of sedimentation over
the past several thousand years is estimated at about 1 mm/yr, though the rate since settlers first
arrived appears to be about twice as fast (Brimhall and Merritt, 1981). Due to frequent re-
suspension of bottom sediment by wave action, there is no sharp sediment/water interface at the
bottom of the lake (Merritt, personal communication, 2004). Instead, the lake bottom is
characterized by a layer of sediment/water ooze and a general downward decrease in water
content within the sediment. The re-suspended sediment, along with algae blooms, results in
very turbid water in Utah Lake much of the year. This turbidity has a major impact on peoples’
perception of the aesthetic quality of the lake (Fuhriman and others, 1981).
Utah Lake receives 69% of its total inflow from surface inflow (Merritt, 2004a). This
water enters the lake through 52 identified sources (Fuhriman and others, 1981). The remaining
water enters by way of precipitation and groundwater inflow. About 50% of the water that
enters Utah Lake leaves by way of evaporation (Merritt, 2004a) – a relatively high amount for a
fresh water lake. The remaining water leaves through the Jordan River.
Due to the high rate of evaporation, the total dissolved solids (TDS) content of Utah Lake
is relatively high (generally between about 500 mg/L and 1,000 mg/L) (e.g., Fuhriman and
others, 1981; Central Utah Water Conservancy District, 2004a). Major ions include calcium,
magnesium, sodium, bicarbonate, chloride, and sulfate. Sources of these dissolved ions include
tributary streams flowing into the lake and lake-bottom mineral springs.
The Utah Department of Environmental Quality, Division of Water Quality has
established Utah Lake’s beneficial use categories as secondary recreational contact (Class 2B),
warm water fishery (3B), wildlife and aquatic organisms in their food chain (Class 3D), and
agricultural uses including irrigations and stock watering (Class 4) (Utah Department of
7. 7
Environmental Quality, undated). Concentrations of phosphorous in Utah Lake impair its use as
a warm water fishery, and TDS concentrations impair its use for irrigation and stock watering
(Sowby and Berg Consultants and others, 1999).
Utah Lake is an important recreational resource for the Utah County region. Recreational
visitors to the lake have declined in recent years, due in large part to (1) the perception that the
lake is polluted, and (2) a drought-induced decline in lake level that has affected boating.
Biologically, Utah Lake is unusual for a number of reasons, as summarized below.
First, the lake has an overall high diversity of biological organisms. Phytoplankton
species are especially diverse.
Second, even though the lake is biologically diverse, by late summer and early fall
months, the diversity diminishes greatly. Again, this is especially the case with phytoplankton
though other species likewise decrease in diversity. Phytoplankton species often diminish in
number of species to a very few with huge absolute numbers of two or three species.
Third, from studies of core samples, it can be hypothesized that the lake has contained
most of the same species present today into the prehistoric past. Some variation in this
interpretation exists, but it is likely that the lake has always been high in nutrient levels and
likely has had somewhat elevated TDS.
Fourth, in contraindication to the third point above, the fish fauna has changed
dramatically in Utah Lake across the past 150 years. A native trout species, the Bonneville
cutthroat trout, dominated the lake when European settlers came to this part of Utah. That
species was over-fished and its spawning grounds disturbed so that it is now extinct in the lake.
Many fish species have been introduced into the lake in the past century. Early reasons
were to replenish the important source of protein that was lost with the native trout. Later reasons
were to attempt to restore and/or create a game fishery. While such attempts have had mixed
success, the fish fauna of the lake is currently dominated by non-native fish, many with qualities
not desirable to local fishers.
Utah Lake in many ways is a unique, beautiful ecosystem with high potential for
recreation and enjoyment. An educational campaign on Utah Lake is long overdue. Likewise,
more studies of the system are necessary in order to protect and enhance the ecosystem.
8. 8
3.0 Geographic Setting and Physical Characteristics (Ben Erickson and Daniel Horns;
Utah Valley State College)
3.1 Introduction and Physical Characteristics
Utah Lake is one of Utah County’s most endearing geographic icons. The lake is used as
a resource for water, recreation, and food and it serves as a unique ecosystem for many natural
and imported organisms. It is located within the semi enclosed basin of Utah Valley (Figure
3.1). The lake covers more than 150 square miles (95,000 acres), or about 25% of Utah Valley.
Utah Lake contains over 1100 x 106
m3
(870,000 ac-ft) of water and it is very shallow, with an
average depth of just 9.2 feet (2.8 m) and a maximum depth of about 12 feet (3.6 m) (Jackson
and Stevens, 1981; Merritt, 2004) (Figure 3.2). Major features within and near Utah Lake are
shown in Figure 3.3.
Utah Valley is at the eastern edge of the Basin and Range province, which extends from
the Wasatch Range in the east to the Sierra Nevada in the west. The Basin and Range is
characterized by alternating north-south trending mountain ranges and intervening sediment-
filled basins. Many of these basins are internally drained, and thus contain terminal lakes. Utah
Lake is considered a semi-terminal lake in the sense that only about half of the water that enters
the lake leaves by surface flow. The remainder leaves by way of evaporation (Merritt, 2004b;
Fuhriman and others, 1981). Utah Lake’s location in a broad sediment filled basin, and its status
as a semi-terminal lake, has significant impact on the lake’s water quality and on the
characteristics of the lake bottom and lake shore. These, in turn have implications for the lake’s
role as a water resource, biological habitat, and recreation destination, as is discussed in more
detail below.
12. 12
3.2 Geologic Setting
Over the past 70 million years Utah Valley has experienced a variety of geologic cycles
(Jackson and Stevens, 1981). The cause for the majority of the activity is the motion of tectonic
plates. The collision of the North American plate with other plates to the west caused uplift
faulting and folding prior to about 30 million years ago. This activity formed the ancestral
Wasatch mountain range and the other ranges in the Rocky Mountains.
Approximately 30 million years ago, relative plate movement changed, and western
North America began to be pulled apart rather than compressed (Brimhall and Merritt, 1981).
When the crust stretched, the previously uplifted mountains were broken apart, creating gaps and
forming a series of basins and fault-bounded ranges. This geologic province of alternating
mountains and valleys is termed the Basin and Range province. The Basin and Range extends
from the Wasatch Mountains, which is the eastern most edge, to the Sierra Nevada Mountain
range in the west (Jackson and Stevens, 1981). Over time, precipitation eroded the exposed rock
within the mountains. Streams carried the eroded material into the basins where it was
deposited, filling the basins with up to 10,000 feet or more of sediments (Curry and others,
1984).
For at least the past 15 million years, Utah Valley and other basins of northern Utah have
been collecting water and sediment through precipitation and runoff from the local mountains.
However, during the last ice age, between 30,000 and 130,000 years ago, there was a major
change to the northern Utah region. Volcanic activity in southern Idaho changed the path of the
Bear River, which had previously flowed into the Snake River drainage, causing it to flow
instead into northern Utah (Curry and others, 1984). As a result of the change in the Bear
River’s course, and due to climate change associated with emergence from the ice age, Lake
Bonneville began to form in northern Utah 23,000 to 25,000 years ago. Lake Bonneville covered
an area of 20,000 square miles of western Utah (Hunt and others, 1953). The vast lake stretched
north and south from Red Rock Pass, southern Idaho, to southwestern Utah and east and west
from the Wasatch Range to near the Utah/Nevada border (Bissell, 1963).
The greatest lake level elevation, of 5090 feet, was achieved about 16,000 years ago
(Curry and others, 1984). Today this level is known as the Bonneville level. Wave action and
other activities formed the Bonneville shoreline features seen along the mountain benches.
Natural dams were containing this high level of water. However, some of these dams consisted
13. 13
of lose and unstable gravel, sand and clay. Between 14,000 and 15,000 years ago, a catastrophic
failure of one of these natural dams in Red Rock Pass, Idaho released water from Lake
Bonneville into the Snake River, causing the level of the lake to drop 350 feet (Curry and others,
1984). About 13,000 to 14,000 years ago, the lake’s water level reached stability at an elevation
of 4740 feet, with the outflow of the water passing through Red Rock Pass. This level is referred
to as the Provo level. The Provo level was maintained until the conclusion of the ice age when
the water level began to decline. Between 10,000 and 11,000 years ago, the level stood at 4250
feet in elevation, constituting the Gilbert level. Over the past 10,000 years the water level in
Lake Bonneville continued to decline. The Great Salt Lake and Utah Lake are remnants of Lake
Bonneville (Curry and others, 1984).
Utah Valley is bound on the east by the Provo segment of the Wasatch fault (Black and
others, 2001; Utah Geological Survey, 2002). Earthquakes on this segment of the Wasatch fault
produce as much as 7 feet (3.3 meters) of offset, with an average recurrence interval of about
2,400 years. The most recent event was about 650 years ago. A large earthquake on the
Wasatch fault would likely result in eastward tilting of the floor of Utah Valley (Eldredge, 1996).
Such tilting would cause the lake to flood eastward, inundating land along the east shore of the
lake.
There is a series of faults that run north-south beneath Utah Lake, identified by seismic
exploration of the lake bottom (Brimhall and Merritt, 1981). Though these faults are poorly
understood, they appear to have been active in the past 15,000 years with an average slip rate of
<0.1 mm/yr to about 0.4 mm/yr fault (Black and others, 2001; Utah Geological Survey, 2002).
3.3 Sediments within Utah Lake
When it rains or snows, the precipitated water makes its way down from the mountains
through streams. As water travels, it erodes through rock and sediment, taking the eroded pieces
along with the flow. Water can also chemically dissolve some types of minerals. Streams
flowing from mountains into valleys thus transport a load of solid (or detrital) sediment as well
as a load of dissolved (or chemical) sediment. The composition of the detrital and chemical
sediment carried by a stream is influenced by the composition of the rock through which the
stream flowed.
As a stream reaches a lake and slows down, it deposits the largest particles of detrital
sediment at the mouth of the stream. This deposition forms structures known as deltas. Wave
14. 14
action can move the sediment along the shoreline, creating sandbars and beaches (Bingham,
1975). Chemical sediment and very fine-grained suspended detrital sediment travel further into
the lake and may eventually be deposited from the water onto the lake bottom. Bioorganic
material, such as plankton shells, may also be deposited on the lake bottom (Sonerholm, 1974).
3.3.1 Composition of Sediment in Utah Lake
In the 1970s, several studies were done on Utah Lake to determine what type of sediment
had been deposited in the lake (Bushman, 1980). The dominant sediment type, composing 60%
of the total lake-bottom sediment, is calcium carbonate (CaCO3, or the common mineral calcite).
This calcite is not in its pure form; it contains traces of magnesium, strontium and other
impurities. This calcite was dissolved from the limestone layers of the nearby mountains, and it
reflects the abundance of limestone in the Utah Lake drainage basin. High concentrations of
calcite sediment are found throughout the central part of the lake, with highest concentrations in
the north and the south parts of the lake (Figure 3.4) (Sonerholm, 1974).
There are several ways by which the calcite is deposited on the lake bottom. Some
calcite is transported to the lake in the form of fine particulate matter suspended in the water.
This particulate matter then settles out in the quiet lake water. The majority of the calcite
transported to the lake is in the form of dissolved calcium and bicarbonate ions. Evaporation
from the lake can cause the remaining lake water to become saturated with calcium and
bicarbonate, resulting in precipitation of calcite from the water. Lastly, some of the calcite
comes from algae and other microorganisms in the lake. According to Merritt (2004c), outflow
through the Jordan River carries away only 42% of the dissolved calcium and 50% of the
dissolved bicarbonate ions that enter the lake. The remainder of the dissolved calcium and
bicarbonate precipitate as calcite within the lake.
After calcite, the second most abundant mineral found in the Utah Lake sediment
is quartz and other silica forms. Quartz comprises almost 30% of the mineral sediments in the
lake (overall mean value of cores = 27%). General trends in quartz sedimentation tend to be
opposite of carbonate sediments. Lower concentrations are found in the center of the lake and
greater concentrations are found near the shore. This trend is due to the near-shore deposition of
minerals from major rivers and vigorous wave action (Brimhall and Merritt, 1981).
The third most abundant mineral is clay (illite and montmorillonite, at a size less than
1/256 mm). The clays are distributed in the river deltas and in areas where the currents have
16. 16
carried them to deeper parts of the lake (Brimhall and Merritt, 1981). Insoluble calcium in the
form of hydrated calcium sulfate (gypsum) is found in small amounts. A trace of iron is present
and is thought to be in the form of ferric oxide (hematite) or hydrated iron oxide (goethite)
(Sonerholm, 1974).
3.3.2 Rate of Sediment Accumulation
To determine the rate at which the sediments accumulate in Utah Lake, it is necessary to
determine the age of deposition of sediment that is found at various depths beneath the lake
bottom (Brimhall and Merritt, 1981). With an average depth of 9.2 feet, Utah Lake is very
shallow. When strong winds cross over Utah Lake, large waves form and stir the lake bottom
(Brimhall and Merritt, 1981). This frequent wave action reaching the shallow lake bottom
causes sediment to remain suspended within the water, producing a lake bottom composed of
soft ooze (Brimhall and Merritt, 1981). Therefore, there generally is no distinct boundary
between water and sediment at the bottom of Utah Lake. Furthermore, wave action causes
mixing of the top layers of sediment (perhaps up to a foot deep). Due to these conditions of the
near-surface sediments in Utah Lake, it is difficult to determine when any one layer of sediment
beneath the lake was deposited. It is correspondingly difficult to determine rates of
sedimentation relative to deeper lakes. Still, several researchers have attempted to measure the
rate of sedimentation in Utah Lake, and these studies have resulted in a wide range of estimated
sedimentation rates. Some of those studies are summarized below.
Brimhall (1972) used core samples to estimate that the rate of sedimentation from 1935 to
1965 was, on average, 3.3 cm per year. This led Brimhall (1972) to speculate that the lake would
become a mud flat within 75 years of his study. Brimhall later discounted this study himself.
Brimhall and Merritt (1981) suggest that Brimhall’s (1972) estimated sedimentation rate was
more than 10 times too high, due to errors in estimating ages of specific layers of sediment.
In 1975, 17 shallow core samples were taken from throughout the lake. Core lengths
ranged from 30 cm to 120 cm. Analyses of these cores resulted in estimated sedimentation rates
of 1 mm/yr to 5 mm/yr over the past few hundred years (Brimhall and Merritt, 1981).
Analysis of seismic profiling was used to estimate the longer-term sedimentation rate
(Brimhall and Merritt, 1981). The seismic profiling identified persistent sediment layers at
depths ranging from 26 feet to 49 feet (8 to 15 meters). Stratigraphic considerations indicate that
17. 17
the layer was deposited in Lake Bonneville about 10,000 years ago. If this age assignment is
correct, it implies an average sedimentation rate of between 0.8 mm/yr and 1.5 mm/yr over the
past 10,000 years.
Lastly, Bushman (1980) estimated sedimentation rates by examining pollen in a 5-meter
core sample taken in 1972 from the southern part of Utah Lake. Counting pollen from sections
of the core, Bushman (1980) decided that the best pollen to follow would be Taraxacum
officinale (common dandelion). The dandelion was introduced to Utah Valley in 1849 and can
be found growing along the shores of Utah Lake and throughout the valley. While it is unknown
when the dandelion became abundant enough to be a significant part of the lake sediment, the
first appearance of dandelion pollen in the lake sediments can be used to estimate a minimum
rate of sedimentation since 1849. The pollen first appears in the core at a depth of 170 cm. If
170 cm of sediment accumulated since 1849, the sedimentation rate from 1849 to 1972 would be
1.38 cm per year (Bushman, 1980).
Ignoring the results of Brimhall (1972) (which he discounted himself in Brimall and
Merritt (1981)), sedimentation rates estimated in the above studies range from about 1mm/yr
(over the past 10,000 years (Brimhall and Merritt, 1981)), to 1 mm/yr to 5 mm/yr (over the past
several hundred years (Brimhall and Merritt, 1981)), to as high as 1.38 cm/yr (from 1849 through
1972 (Bushman, 1980)). The result of Bushman (1980) is clearly not consistent with the other
studies. Since Bushman’s (1980) study relied on shallower sediments than the others, it is most
likely to be influenced by errors associated with sediment mixing and with the uncertainty of the
age of deposition of any particular layer of sediment in Utah Lake. Most people familiar with
Utah Lake consider the best estimate for the long-term sedimentation rate in Utah Lake to be
about 1 mm/yr, with a possible increase over the past 150 years to about 2 mm/yr (Brimhall and
Merritt, 1981). The lake and river sediments beneath Utah Lake may extend to a depth as great
as 10,000 feet (Price and Conroy, 1988; Utah Lake Study Committee, 2004).
4.0 Hydrology of Utah Lake (Cami Litchford, Jim Callison, and Daniel Horns; Utah
Valley State College)
As mentioned above, Utah Lake functions as a semi-terminal lake. Water flows into the
lake from streams, canals, and groundwater. About half of the water leaves by way of the Jordan
River (which flows to Great Salt Lake) and half by evaporation. The hydrology of the basin has
been altered by canals that divert water from the tributary streams and by the inflow from
18. 18
wastewater treatment plants. Due to the generally high rate of evaporation, the lake level varies
greatly with long-term trends in weather.
4.1 Inflow
Sources of inflow to Utah Lake include precipitation, lake-bottom mineralized thermal
springs, lake-bottom freshwater springs, diffuse groundwater inflow, and surface tributaries.
Contributions from each of these sources, estimated by Merritt (2004a) are listed in Table 4.1.
Each of these sources is discussed in more detail below.
4.1.1 Precipitation
Even though direct precipitation to the lake is not the main source for the lake’s inflow, it
still plays a significant role to the total inflow of the lake. Estimates of precipitation are
complicated by the fact that precipitation varies considerably from place to place across the lake.
Most weather stations are located along the east side of the lake, where precipitation is likely
enhanced by storms moving northwest-to-southeast across the lake (Miller and Merritt, oral
communication, 2004). Even along the east shore the amount of precipitation is variable. For
example, near the Geneva Steel Plant the average annual precipitation is approximately nine
inches (23cm) per year, whereas further south along the lake near Santaquin the average annual
precipitation is about 18 inches (45.7cm) per year. Taking these complicating factors into
account, Merritt (2004a) estimates that the lake receives about 96,000 acre-feet per year from
precipitation. This accounts for about 15% of the total inflow. Jackson and Stevens (1981) state
that about 60% of the precipitation comes between late winter and early spring, with March
usually being the wettest month.
4.1.2 Surface Flow (Streams and Wastewater Treatment Plants)
Of all the sources that provide water to Utah Lake, surface flows (including natural streams and
flows from wastewater treatment plants) are the largest contributors. Merritt (2004a) states that
Utah Lake receives 69% of its total inflow from surface inflow. This water enters the lake
through many sources. Fuhriman and others (1981) identified a total of 52 inflow sources.
These tributaries are shown on Figure 4.1. Total annual flows for the year 1979 from 46 of these
tributaries are shown on Table 4.2. As can be seen on Table 4.2, the three largest tributaries
(Provo River, Hobble Creek, and Spanish Fork River) accounted for over 50% of the total
19. 19
surface water inflow to Utah Lake. The Provo River alone accounted for over 25% of the
inflow.
Boyd and Cassel (2005) also estimated flows for the major Utah Lake tributaries. These
more recent estimates are presented in Table 4.3. These flow rates agree broadly with those of
Fuhriman and others (1981). The differences between Tables 4.2 and 4.3 likely have two
sources. First, variations in precipitation produce variations in flow rates of the tributaries.
Second, there is some inevitable error in any flow rate estimate. Determining the flow of
tributaries into Utah Lake is complicated by the numerous changes that have been made to those
tributaries. For example, the upper Spanish Fork River receives a substantial amount of water
from the tunnels that run under the mountains to Strawberry Reservoir. On the other hand, the
lower Spanish Fork River has numerous diversions for irrigation. Some of the irrigation water is
lost to evaporation and an unknown amount of irrigation water eventually reaches Utah Lake
through groundwater flow. The flow rate estimates in Tables 4.2 and 4.2 should thus be taken
as broad estimates, and are not likely to match the true flow in any given year.
20. 20
Figure 4.1 – Utah Lake tributaries. Numbers correspond with station numbers in
Table 4.2. Modified from Fuhriman and others (1981)
21. 21
Source
Average inflow
(acre-feet/yr)
Percentage of
total inflow
Precipitation 96,000 15
Flow from waste water treatment plants 43,000 7
Surface tributaries (excluding treatment plants) 391,000 62
Freshwater springs and diffuse groundwater flow 77,000 12
Mineralized springs 26,000 4
Total 633,000
Table 4.1 – Yearly inflow to Utah Lake, based on average annual estimates for the period 1930
through 2003. Modified from Merritt (2004a)
Station
Flow
(acre-feet) Station
Flow
(acre-feet) Station
Flow
(acre-feet)
UT 1 & 2 452 UT 18 16,637 UT 38 4,800
UT 4 274 UT 20 26,459 UT 39 17,256
UT 5 959 UT 23 113 UT 41 3,828
UT 6 1,323 UT 25 669 UT 42 17,394
UT 7 1,284 UT 26 6,164 UT 43 6,484
UT 8 5,060 UT 27 14,200 UT 44 (Hobble Creek) 52,983
UT 9 14,296 UT 28 1,175 UT 45 2,763
UT 10 950 UT 29 (Provo Riv.) 124,293 UT 46 2,296
UT 11 2,027 UT 31 1,570 UT 47 9,054
UT 12 783 UT 32 871 UT 48 (Span. Fk Riv.) 54,378
UT 13 1,190 UT 33 481 UT 48a 743
UT 14 1,432 UT 34 5,141 UT 49 485
UT 15 2,246 UT 35 1,214 UT 50 2,863
UT 16 1,545 UT 36 1,352 UT 51 22,005
UT 17 2,640 UT 37 1,432 UT 52 5,467
TOTAL 441,031
Table 4.2 – Tributary flow data for 1979 water year (October 1, 1978 through September 31,
1979). Modified from Fuhriman and others, 1981. See Figure 4.1 for locations of tributaries.
22. 22
Tributary Average Annual flow (acre-feet/year)
Provo River 137,858
Spanish Fork River 67,308
Benjamin Slough 33,786
Mill Race 26,414
Geneva Steel Drain 18,358
Hobble Creek 15,727
Steel Mill Drain 15,654
Powell Slough 15,251
Geneva Cannery Drain 15,136
Mill Pond 11,701
Dry Creek 10,224
Other 56,522
Total 426,939
Table 4.3 – Stream flow data for the major Utah Lake tributaries. Modified from Boyd and
Cassel (2005).
23. 23
4.1.3 Groundwater and Springs
Groundwater is another significant source of inflow to Utah Lake. Groundwater enters
the lake through three types of flow: freshwater springs, diffuse fresh seeps, and mineralized
springs (Brimhall and Merritt, 1981; Fuhriman and others, 1981). Most of these sources of
groundwater inflow are concentrated in a north-south trending band that occupies much of the
eastern half of the lake, from Bird Island to American Fork. The reasons for this concentration
are: (1) the principal recharge zone for the Utah Valley basin-fill aquifer is on the east side of the
valley (enhancing groundwater flow into the east side of the lake), and (2) some of the springs
may be localized along lake-bottom faults (Brimhall and Merritt, 1981; Baskin and others, 1994).
Due to the inaccessibility of lake-bottom springs and seeps, it is difficult (if not
impossible) to measure the exact amount of groundwater flow to the lake. Fuhriman and others
(1981) estimated groundwater flow into the lake by conducting a salt balance analysis
(comparing the concentrations of key dissolved ions in surface tributaries, fresh water spring,
mineralized springs, and lake water) to estimate the net groundwater inflow. The method
resulted in an estimate of 114,000 acre-feet/year of total groundwater inflow. Merritt (2004a)
used refinements of the methods to estimate that freshwater springs and diffuse groundwater
flow account for about 77,000 acre-feet/year of flow to the lake (12% of total inflow), and
mineral springs account for 26,000 acre-feet/year of flow to the lake (4% of total inflow).
Baskin and others (1994) studied the springs and wells in the Lincoln Point-Bird Island
area. This study concluded that the flows from the springs in the Lincoln Point-Bird Island area
are probably controlled by fractures that are the result of faulting. Most of the springs in this
area are aligned along a northwest trend, at an altitude of about 4,488 feet, and they are located
near inferred faults or in areas that are adjacent to faults. The material that the springs flow
through includes fractured conglomerate, tufa, and travertine. The chemistry of the spring water
is likely influenced by the composition of the rock through which the water flows.
4.1.4 History of Human Impact on Utah Lake’s Inflow
Jackson and Stephens (1981) state that until fairly recently, human impact has been fairly
insignificant on Utah Lake’s inflow. In the past, various cultures mainly used the lake and its
tributaries as sources of food-- primarily fish. Most of these cultures were nomadic, so their
impact on the lake was very small. The earliest written account of people considering the use of
24. 24
water from Utah Lake as an agricultural resource was written in September, 1776, by the
Dominguez and Velez de Escalante expedition. These explorers were greatly impressed by the
good planting soil, and springs that contained “good water” in this area, and they immediately
saw the agricultural potential of the land that was located near the lake. As they reached the
Spanish Fork River, the Dominguez and Velez de Escalante expedition mentioned that enough
irrigation water could easily be diverted to support two large towns
According to Jackson and Stephens (1981) the inflow sources of Utah Lake were
basically left undisturbed until the mid 1800’s when the Mormon pioneers began to colonize the
land. Once people began to settle in the valley, the streams that flowed into the lake began to be
used for agricultural purposes. Various streams and rivers were diverted to support the small
colonies. The most significant early impact to the lake’s surface water inflow occurred when the
city of Provo was founded in the year 1849. Hyatt and others (1969) mention that “all the towns
except Orem were located originally alongside or near streams that flow into the valley from the
Wasatch Mountains. . .” Many of the settlers diverted water from the Provo River, Battle Creek,
American Fork River, and other tributaries and streams to cultivate their crops. In 1850, Provo
City built two canals, the Turner Ditch and the East Union Ditch, to irrigate fields.
As the population in the region began to increase, the streams were being diverted higher
and higher upstream. By the year 1869, one-third of all of the ditches that existed in 1920 had
already been built, and five major canals had been built by the Provo River company to divert the
water to nearby crops. By this time, the American Fork River had four major canals that had
been constructed. Canals had been built to divert water from the other nearby rivers as well.
Large dams were constructed to divert water to communities that were located at higher
elevations away from Utah Lake; many of these were located on the Provo River. Fishing,
which was once a major use of Utah Lake, began to decline as water diversions interfered with
spawning in the rivers.
The population in the area grew fairly slowly until after the 1940’s. By 1969, 14
reservoirs had been constructed on the River. The most recent of these was the Deer Creek
Reservoir, which was completed in 1941. Because of all the diversions that have been made,
many of the smaller streams that enter Utah Lake are now completely dry in the late summer
months.
25. 25
There have been many diversions of Utah Lake’s inflow sources. Table 4.4 (based on
Hyatt and others, 1969) lists a few of the significant diversions (inflow and outflow) that have
occurred in the past 150 years.
4.2 Outflow
4.2.1 Surface Water
The Jordan River, located on the north end of Utah Lake, is Utah Lake’s only surface
water outlet. It carries the water from Utah Lake into the Great Salt Lake. The average outflow
in the Jordan River is about 338,000 acre-feet/year (Merritt, 2004a). This represents
approximately half (51 % to 53%) of the lake’s inflow. The average estimated residence time of
water flowing through Utah Lake is about two and a half years (Merritt 2004a).
4.2.2 Evaporation
Because it is difficult to determine the evaporation pan coefficient everywhere on the
Utah Lake, the exact rate of evaporation from Utah Lake is not known (e.g., Fuhriman and
others, 1981). It is clear that the rate of evaporation is relatively high, given the lake’s semi-arid
climate, large surface area, and shallow average depth (which allows the entire lake to warm up
during the summer). After several decades of work, Fuhriman and others (1981) and Merritt
(2004a and 2004c) estimate that evaporation accounts for about 47% to 49% of the lake’s total
outflow.
4.2.3 History of Human Impact on Utah Lake’s Outflow
In 1872, a low dam was constructed at Utah Lake’s outlet to improve the lake’s
function as a storage reservoir (Hyatt and others, 1969). Soon after the dam’s construction,
there arose conflicts between landowners, whose property was being flooded, and the water
users. To remedy this problem, a compromise lake level was established in the year 1885. In
this compromise, the two conflicting parties agreed to adjust the lake level to 4,489.34 feet above
sea level. As a result of more litigation in the early 1980’s, the compromise elevation was
changed by order of the court to 4,489.045 feet above sea level (K. Kappe, oral communication,
2005). There are thus two Utah Lake “compromise” elevations commonly referred to: the 1885
elevation of 4,489.34 and the 1985 elevation of 4,489.045. Utah Lake elevation measurements
given in relation to the “compromise elevation” refer to the 1885 elevation from 1884 through
1984 and refer to the 1985 elevation thereafter.
26. 26
Jackson and Stephens (1981) state that pumping stations extracting water from the lake have
been built and used in the past, but were abandoned due to fluctuations of the lake’s level. On
many occasions the lake level was so low that the pumps were useless. Hyatt and others (1969)
mention that in the year 1902, a pumping plant was constructed so that the lake could be lowered
when needed. Throughout the decades, the pumping plant was modified and enlarged on several
occasions. In 1969, the pumping plant’s capacity was approximately 1,050 cubic feet per second
and the lake’s level could be lowered 8-10 feet below the its “compromise level”.
4.3 Lake Levels
Despite construction of a dam intended to maintain the level of Utah Lake at the
compromise elevation of 4,489.34 feet, the lake’s level varies considerably, depending on
precipitation and evaporation. Figure 4.2 shows variations in the level of Utah Lake from 1930
through mid 2004. Note that the elevation of the lake surface has varied from a low of 4,477 feet
in October 1935 (12 feet below compromise level), to a high of 4,494 feet in June 1984 (5 feet
above compromise level). The lake level has thus varied by 17 feet over the past 100 years.
Considering the gentle slope of the lake bottom, a variation of 17 feet in lake surface elevation
should result in a migration of the lake shoreline of several tens or even hundreds of feet. These
variations in lake level, and corresponding variations in lake shoreline position, must be
considered in planning developments along the lake shore.
27. 27
Table 4.4 – Significant diversions from Utah Lake tributaries, through 1958 (from Hyatt and
others, 1969)
Date Event
1851 Water diverted from Spanish Fork River to Irrigate land
1852 First water company organized
1856 Water diverted from Summit Creek, but creek became inadequate for
irrigation
1852 A diversion dam is built on Salt Creek
1859 Irrigation is initiated in Heber Valley. The ditches are later enlarged to
canals, and canal companies are organized
1872 Utah Lake is developed as a storage reservoir. A low dam is placed across
the lake’s outlet to Jordan River
1884 Ditches and canals are built in Kamas Valley.
1885 Agreement fixed compromise of lake’s water level to 4,489.34 feet above
sea level.
1891 Ontario Tunnel is constructed
1895 Mt. Nebo Land and Irrigation Company formed to construct Mt. Nebo
Dam on Currant Creek. The settlers forced to leave a few times from the
reservoir drying up.
1902 Pumping plan is developed so that the lake can be lowered 8-10 feet below
compromise level
1905 Mt Nebo Land and Irrigation Company is changed to Utah Lake Land,
Water, and Power Company
1906 Strawberry Valley project begins. Project diverts water from Uinta Basin
to Bonneville Basin
1909-1915 Mosida Irrigation Company is organized. By 1915 water had receded to a
point beyond the pump intake, and project was abandoned.
1910 14 small reservoirs are built at the headwaters of the Provo River.
1928-1931 Weber River project- built Weber-Provo Diversion canal, which delivers
water to the Provo River near Woodland, Utah
1938-1941 Deer Creek Reservoir is built for power production, irrigation and
municipal purposes
1952 Salt Lake Aqueduct completed to take water from Utah Lake drainage area
to the Salt Lake basin.
1953 Duchesne Tunnel built- diverts water from Duchesne River’s North Fork
to Provo
1958 American Fork-Dry Creek watershed was constructed
28. 28
Figure 4.2 – Utah Lake stage, 1930 through middle 2004. Modified from Merritt (2004c).
1930 1940 1950 1960 1970 1980 1990 2000 2010
Beginning of Water Year
4470
4475
4480
4485
4490
4495
4500
LakeStage(ft)
Compromise Lake Level
29. 29
5.0 Water Quality (W. John Calder, Katherine Klauzer, Eddy Cadet, Jim Callison,
Daniel Horns; Utah Valley State College)
The quality of water in Utah Lake is influenced by the quality of water in the various
inflows (tributary streams, wastewater treatment plants, and groundwater), by the rate of
evaporation, and by the re-suspension of lake-bottom sediments. Utah Lake is naturally turbid,
slightly saline, and biologically productive (eutrophic) Merritt (2004b). While there is a
common perception that the Utah Lake is polluted, the water quality and overall characteristics
of the lake probably haven’t changed much since its birth as Lake Bonneville last receded about
ten thousand years ago (Merritt, 2004b)
5.1 Water Quality of Tributaries
Fuhriman and others (1981) published a report on the water quality of Utah Lake based
on data collected through the 1970’s. These data are summarized in Table 5.1. In general, the
most common reported cation is calcium, and the most common anion is bicarbonate. These
values reflect the abundance of limestone in the drainage basin. The major tributaries, in
general, have relatively low concentrations of most parameters. For example, the Provo River
has an average TDS of 277 mg/L, Hobble Creek has an average TDS of 326 mg/l, and Spanish
Fork River has an average TDS of 552 mg/l, while the average TDS from all tributaries is 570
mg/L.
Of particular interest is the Provo River, due to its high total inflow. The Provo River
contributes about 25% to 30% of the total inflow to Utah Lake, while only carrying 14% of the
TDS, averaging 277 mg/l a year. The only chemical that the Provo River carries in a relatively
high amount is calcium at 105 mg/l.
The Central Utah Water Conservancy District (2004a) includes data on the water quality
of the tributaries based on samples collected from 1990-1999. The TDS data from Central Utah
Water Conservancy District (2004a) are summarized in Table 5.2 and the phosphorous data are
summarized in Table 5.3. Significant in these data is the fact that wastewater treatment plants
contribute 77% of the phosphorous, while accounting for less than 10% of the inflow. The
phosphorous load to Utah Lake is significant because phosphorous is an important nutrient
contributing to the eutrophic condition of the lake (see Section 5.3 Lake Water Quality, below).
30. 30
Total dissolved solids Calcium Magnesium Sodium
Station Ave High Low Ave High Low Ave High Low Ave High Low
UT 9 428 472 373 71 81 56 35 40 20 23 40 17
UT 13 339 398 259 72 85 53 25 30 18 20 36 7
UT 18 551 626 478 89 99 76 40 45 32 32 41 26
UT 29* 277 327 227 105 607 52 15 19 11 11 13 9
UT 34 399 453 364 124 500 76 21 23 19 20 58 14
UT 38 495 890 356 81 100 69 20 26 12 28 33 22
UT 42 758 1065 670 114 137 17 42 54 38 43 78 31
UT 43 586 654 438 100 111 83 34 44 29 36 58 22
UT 44* 326 460 259 69 88 44 18 34 10 25 114 8
UT 45 809 1150 496 79 98 43 49 68 34 95 135 44
UT 47 933 1086 778 77 87 55 47 54 34 154 186 122
UT 48* 552 906 437 74 85 60 34 55 26 78 182 41
UT 51 982 1405 825 81 102 65 70 86 56 144 211 94
TDS ave. 570 Calcium ave. 88 Mag. ave. 34 Sodium ave. 53
Bicarbonate Chloride Sulfate Nitrate
Station Ave High Low Ave High Low Ave High Low Ave High Low
UT 9 300 453 202 23 31 16 91 103 78 1 2 0
UT 13 245 293 191 13 17 8 79 104 54 2 6 1
UT 18 343 383 277 37 48 29 108 128 90 2 3 1
UT 29* 194 220 172 16 24 10 49 57 41 0 1 0
UT 34 274 314 186 24 30 19 59 68 54 1 2 1
UT 38 300 474 265 34 42 29 55 73 50 3 11 1
UT 42 272 286 249 45 63 36 287 338 248 1 1 0
UT 43 282 361 208 51 80 25 137 172 97 1 2 0
UT 44* 222 314 158 18 31 5 55 146 15 1 1 0
UT 45 429 558 295 83 138 26 163 305 87 2 4 1
UT 47 497 567 410 116 129 95 177 248 144 3 4 2
UT 48* 327 462 290 67 121 38 116 221 72 0 1 0
UT 51 480 561 416 135 215 85 216 343 132 1 2 1
Bicarb. ave. 317 Chloride ave. 51 Sulfate ave. 120 Nitrate ave. 1
Table 5.1 - Water quality data for Utah Lake tributaries for the period 1970 - 1973, based on data
in Fuhriman and others (1981). See Figure 4.1 for locations of tributaries. Major tributaries are
marked with *. Tributary 29 is the Provo River, tributary 44 is Hobble Creek, and tributary 48 is
the Spanish Fork River.
31. 31
Inflow Source Average Annual
Inflow (acre-feet)
TDS
Concentration
(mg/L)
Combined
Load
(tons/year)
% of
Total
Load
Provo River 124,721 276 49,225 14
Spanish Fork River 91,581 481 62,992 19
Hobble Creek 20,332 293 8,519 3
WWTP Discharges 52,591 600 45,123 13
Other Inflows 269,023 450 173,116 51
TOTAL 558,248 338,975
Table 5.2 - Tributary average TDS concentrations and total loads to Utah Lake for 1990 – 1999
(based on Central Utah Water Conservancy District (2004a)).
Inflow Source Average Annual
Inflow (acre-feet)
Phosphorous
Concentration
(mg/L)
Combined
Load
(tons/year)
% of
Total
Load
Provo River 124,721 0.06 11 4
Spanish Fork River 91,581 0.09 12 4
Hobble Creek 20,332 0.04 1 1
WWTP Discharges 52591 3 225.6 77
Other Inflows 269,023 0.11 42 14
TOTAL 558,248 292
Table 5.3 - Tributary average phosphorous concentrations and total loads to Utah Lake for 1990 –
1999 (based on Central Utah Water Conservancy District (2004a)).
32. 32
Eight municipal sewage treatment plants release water to the Utah Lake basin (Utah
Board of Water Resources, 1997). These wastewater treatment plants have long been recognized
as significant contributors of phosphorous to Utah Lake (e.g., Fuhriman and others, 1981), and
plant operators have made efforts to reduce phosphorous discharges. From the early 1990’s
through the early 2000’s (which includes the period of sampling represented in Table 5.3),
treatment plants in Utah Valley reduced phosphorous discharges by 16% to 63% (Boyd and
Cassel, 2005). This effort is apparently reflected in the fact that phosphorous concentrations in
the Provo River, Hobble Creek, and Spanish Fork River decreased by about 50% from the early
1980’s through the mid 1990’s.
5.2 Water Quality of Groundwater and Springs
The groundwater sources flowing into Utah Lake can be divided into those that
contribute fresh water and those that contribute relatively mineralized water (Fuhriman and
others, 1981; Merritt, 2004a). For example, Baskin and others (1994) analyzed water from 21
springs in the Lincoln Point-Bird Island area and found that TDS concentrations ranged from
7,932 mg/l down to 444 mg/l. The major dissolved ions were sodium, potassium, chlorine, and
fluorine. Merritt (2004a) estimates that fresh groundwater contributes about 7.4% of the total
dissolved solids load to Utah Lake. Mineral groundwater, which contributes only 4.1% of the
total water flow into Utah Lake, contributes 27.6% of the TDS load to the lake.
5.3 Lake Water Quality
While many local residents assume that the lake is polluted (Fuhriman and others, 1981),
the water quality has not degraded much (if at all) since the region was first settled. The
perception that the lake is polluted likely comes from the color and turbidity of the lake water
(Fuhriman and others, 1981; Sowby and Berg Consultants and others, 1999). The lake’s color
and turbidity result largely from sediments being stirred up by wave action, as well as from the
presence of planktonic algae (Sowby and Berg Consultants and others, 1999).
Table 5.4 summarizes water quality data for Utah Lake water presented in Fuhriman and
others (1981). The values shown in Table 5.4 are averages of data collected between 1968 and
1976 (with a few exceptions in which data were collected over only part of this period).
Locations of the data collection points are shown on Figure 3.3. Three of the data collection
points are in the main body of the lake, one is in Goshen Bay, and two are in Provo Bay. The
33. 33
data in Table 5.4 highlight the variability of water quality in Utah Lake. Many of the parameters
(sodium, chloride, sulfate, TDS) show distinct seasonal trends, with concentrations varying by as
much as 20% or more at some sampling sites over the course of a year. Also, water in Provo
Bay has lower concentrations of many of the parameters than the water in Goshen Bay or the
main body of the lake. This latter observation may reflect the relatively high rate of freshwater
inflow to Provo Bay. According to many of the researchers familiar with Utah Lake, water
quality in the lake is highly variable over time, and the lake appears to be fairly well mixed
during periods of normal wind conditions (e.g., A.W. Miller, oral communication, 2004; L.B.
Merritt, oral communication, 2004).
Since Utah Lake is not a direct source of drinking water, USEPA standards for culinary
water quality do not apply. Instead, water quality standards for Utah Lake are determined by the
lake’s beneficial use categories as determined by the Utah Department of Environmental Quality,
Division of Water Quality (DWQ). The DWQ has established Utah Lake’s beneficial use
categories as secondary recreational contact (Class 2B), warm water fishery (Class 3B), wildlife
and aquatic organisms in their food chain (Class 3D), and agricultural uses including irrigations
and stock watering (Class 4) (Utah Department of Environmental Quality, undated).
Concentrations of phosphorous in Utah Lake impair its use as a warm water fishery, and TDS
concentrations impair its use for irrigation and stock watering (Sowby and Berg Consultants and
others, 1999). The sections below present more detailed information on Utah Lake’s
phosphorous and TDS concentrations, as well as information on the lake’s high turbidity and
eutrophic conditions.
35. 35
Table 5.4 continued
Total Dissolved solids – mg/l
Station Mar Apr May Jun Jul Aug Sep Oct Nov Dec
UL11 794 955 894 923 913 913 922 918 893 856
UL13 880 887 854 924 934 915 889 943 891 938
UL15 1073 840 964 969 925 935 925 925 937 941
GB 2b
-- 965 -- -- 948 -- 1145 -- 890 --
GB 2c
-- -- -- 2260 2009 2269 -- -- -- --
PB11 751 762 808 -- 906 870 898 890 872 835
PB 2 586 532 -- 584 529 525 563 575 627 --
Calcium – mg/l
Station Mar Apr May Jun Jul Aug Sep Oct Nov Dec
UL11 49 53 58 59 54 46 40 49 51 48
UL13 50 44 58 58 51 46 41 43 42 50
UL15 50 50 62 59 51 48 41 40 44 49
GB 2 -- 56 -- -- 58 45 42 -- 49 --
PB11 -- 54 68 -- 55 45 40 49 49 --
PB 2 -- 63 90 -- 56 96 39 96 83 --
Magnesium – mg/l
Station Mar Apr May Jun Jul Aug Sep Oct Nov Dec
UL11 52 51 54 53 54 55 59 58 54 51
UL13 52 49 54 53 54 57 56 58 55 56
UL15 59 48 58 56 57 58 58 58 56 57
GB 2 -- 54 -- -- 71 64 55 -- 57 --
PB11 -- 45 54 -- 48 58 55 57 58 60
PB 2 -- 30 32 -- 36 30 43 26 40 --
Table 5.4 - Average Utah Lake Water Quality Data from Fuhriman and others (1981).
Locations of data collection points shown in Figure 3.3. Values are averages of all data
available to Fuhriman and others (1981) from 1968 through May 1976 (except for b
– based on
1975 and 1976 data, and c
– based on 1970 data). This was generally a wet period, with lake
levels somewhat higher than long-term average. During lower water level periods, there is
less mixing between Goshen and Provo Bays and the main lake; hence, Goshen Bay would
have higher mineral levels and Provo Bay lower levels (Fuhriman and others, 1981).
36. 36
5.3.1 Phosphorous in Utah Lake
Phosphorous concentrations in Utah Lake are a concern because phosphorous is a key
nutrient for algae. While phosphorous is not toxic at concentrations found in Utah Lake, too
much phosphorous can over-stimulate algae growth. Such algae blooms may deplete oxygen,
increase turbidity (which limits photosynthesis), and choke out other aquatic life (Boyd and
Cassel, 2005).
Utah Lake receives about 300 million grams of phosphate per year, with most of this
(about 75%) coming from wastewater treatment plants (Merritt, 2004a). Table 5.5 presents total
phosphorous concentrations for several stations in the east-central part of Utah Lake from 1990
through 1999. Included in this table are the highest value recorded at each sample site, the
lowest value recorded, and the average value. The water quality standard for total phosphorous
for beneficial uses 2B (secondary recreational contact) and 3B (warm water fishery) is 0.025
mg/L. Based on the data in Table 5.5, it appears that the water of Utah Lake generally exceeds
this value by about a factor of 2 to 5. Boyd and Cassel (2005) point out that phosphorous levels
in Utah Lake have generally been decreasing since the mid 1990’s, largely in response to
decreased phosphorous outputs from wastewater treatment plants. If all the contributions from
the wastewater plants were removed, phosphorous concentrations would drop by about 77%.
However, other sources of phosphorous are high enough that the lake would still likely be
impaired by phosphorous for much of each year for beneficial uses 2B and 3B (based on the
numbers presented in Table 5.3 and 5.5).
37. 37
Station Station Description Max. TP
Conc. (mg/L)
Min. TP
Conc. (mg/L)
Average TP
Conc. (mg/L)
491734 E of Provo Boat
Harbor, 6 miles N of
Lincoln Beach
0.36 0.05 0.13
491739 4 miles W of Provo
Airport 4 miles N of
Lincoln Point
0.21 0.04 0.07
491740 1.5 mile NW of Provo
Boat Harbor
0.12 0.08 0.10
491777 Provo Bay outside
entrance to Provo Bay
0.84 0.05 0.17
491770 2.5 miles NE of Lincoln
Point
0.25 0.04 0.09
491771 1 miles NE of Lincoln
Point
0.17 0.04 0.08
Table 5.5 - Total phosphorous concentrations from several stations in the east-central part of
Utah Lake. Based on data collected from 1990 through 1999. Modified from Central Utah
Water Conservancy District (2004a).
38. 38
5.3.2 Total Dissolved Solids (TDS) in Utah Lake
The water quality standard for TDS for beneficial uses 4 (agricultural uses including
irrigations and stock watering) is 1,200 mg/L. The TDS data presented in Table 5.4 generally do
not exceed this value. These data, however, were collected during a relatively wet period. As
shown in Figure 5.1, TDS concentrations in Utah Lake are highly variable depending on
precipitation and lake level. The simulated TDS values are based on modeling by Merritt
(2004a). Figure 5.1 shows that measured and modeled TDS values were above or near the water
quality standard over the past few years, as well as during low water periods in the 1990’s,
1960’s, 1940’s, and 1930’s.
TDS data from the 1990’s, reported in Central Utah Water Conservancy District (2004a),
are summarized in Table 5.6. Many of the values in Table 5.6 exceed the water quality standard.
Table 5.6 illustrates the variability of TDS concentrations over time. For example, TDS values
measured at station 491731 range from 700 mg/L to 1022 mg/L, and values at station 491777
range from 682 mg/L to 1214 mg/L. Data from Goshen Bay and Provo Bay were very close
together, having a difference of only about 100 mg/l. Merritt and Miller (personal
communication, 2004) expressed that under typical wind conditions, Utah Lake is generally
fairly mixed. During periods of low mixing (low wind or ice cover) Goshen Bay and the area
around Saratoga Springs may have relatively high TDS due to the inflow of mineralized spring
water.
39. 39
Figure 5.1 - Utah Lake TDS concentration VS stage. Simulated TDS indicated by the solid lower
line, measured TDS indicated by the circles. Modified from Merritt (2004c).
0
500
1000
1500
2000
2500
3000
1930 1940 1950 1960 1970 1980 1990 2000 2010
Beginning of Water Year
TDSConcentration(mg/L)
4440
4450
4460
4470
4480
4490
LakeStage(ft)
Lake Stage
Simulated TDS
Measured TDS
40. 40
Table 5.6
Sample
Date
Station ID
Number
Monitoring Station Description Region of
Lake
Measured TDS
(mg/L)
8/14/1990 491730 300 feet offshore from Geneva
Steel
Main body 1240
8/14/1990 491724 1 mile SE of Pelican Point Main body 1262
7/2/1993 491731 0.5 mile W of Geneva Discharge
site
Main body 816
7/15/1994 491731 0.5 mile W of Geneva Discharge
site
Main body 1022
7/26/1995 491731 0.5 mile W of Geneva Discharge
site
Main body 872
9/27/1995 491731 0.5 mile W of Geneva Discharge
site
Main body 924
7/15/1997 491731 0.5 mile W of Geneva Discharge
site
Main body 760
9/11/1997 491731 0.5 mile W of Geneva Discharge
site
Main body 806
7/6/1999 491731 0.5 mile W of Geneva Discharge
site
Main body 700
8/19/1999 491731 0.5 mile W of Geneva Discharge
site
Main body 720
8/14/1990 491732 0.5 mile W of Geneva Discharge
site
Main body 1248
7/15/1997 491732 0.5 mile W of Geneva Discharge
site
Main body 758
9/11/1997 491732 0.5 mile W of Geneva Discharge
site
Main body 800
8/19/1999 491732 0.5 mile W of Geneva Discharge
site
Main body 714
8/14/1990 491733 5 miles NNW of Lincoln Beach,
1 mile offshore
Main body 1288
8/14/1990 491734 E of Provo Boat Harbor, 6 miles
N of Lincoln Beach
Main body 1292
8/14/1990 491737 4 miles N of Pelican Point 5 miles
West of Geneva
Main body 1238
8/14/1990 491738 0.5 mile S of American Fork Boat
Harbor
Main body 1254
8/14/1990 491739 4 miles W of Provo Airport 4
miles N of Lincoln Point
Main body 1262
8/14/1990 491740 1.5 mile NW of Provo Boat
Harbor
Main body 1224
8/14/1990 491741 1 mile NE of Pelican Point Main body 1244
41. 41
Table 5.6 continued
8/14/1990 491750 3 miles WNW of Lincoln Beach Main body 1246
8/14/1990 491751 4 miles E of Saratoga Springs Main body 1248
8/14/1990 491752 2 miles E of Saratoga Springs Main body 1262
8/14/1990 491770 2.5 miles NE of Lincoln Point Main body 1284
8/14/1990 491771 1 miles NE of Lincoln Point Main body 1278
8/14/1990 491762 Goshen Bay midway off main
point on east shore
Goshen Bay 1330
7/6/1999 491762 Goshen Bay midway off main
point on east shore
Goshen Bay 716
8/14/1990 491777 Provo Bay outside entrance to
Provo Bay
Provo Bay 1214
7/6/1999 491777 Provo Bay outside entrance to
Provo Bay
Provo Bay 682
Table 5.6 – TDS values for several stations in Utah Lake. From Central Utah Water
Conservancy District (2004a).
42. 42
5.3.3. Eutrophic Condition
The concentrations of nutrients in Utah Lake (especially phosphorous and nitrogen) are
high enough for the lake to be considered highly eutrophic (Fuhriman and others, 1981; Merritt
and Miller, 1981; Merritt, 2004d). Observations of actual algae growth, however, indicate that
functionally the lake is only moderately eutrophic (Merritt, 2004d). This indicates that Utah Lake
contains phosphorous and nitrogen far in excess of what is needed to sustain the lake’s biological
productivity, and that algae growth is limited by some factor other than available nutrients. Even
substantial reductions in nutrient loading would likely result in little or no change in algae
growth (Merritt and Miller, 1981). For example, Fuhriman and others (1981) suggest that even if
there was no discharge of phosphorous from waste water treatment plants, the lake would still be
eutrophic.
5.3.4 Turbidity
The high turbidity of Utah Lake water is the major factor contributing to the lake’s
“polluted” image (Fuhriman and others, 1981). Furthermore, the turbidity severely limits the
depth to which photosynthesis may take place in the lake. The turbidity is likely a limiting factor
in the biological productivity of the lake (Fuhriman and others, 1981). Turbidity therefore has
major influence on the public perception of the lake and the ecosystem in the lake. The main
cause of the turbidity is generally thought to be re-suspension of bottom sediments by wave
action (e.g., Fuhriman and others, 1981; Merritt, 2004b). Understanding the cause of high
turbidity in Utah Lake therefore requires an understanding of wave action in the lake (e.g., the
minimum wave size required to re-suspend sediments from all or most of the lake bottom, the
wind conditions necessary to produce those waves, etc.). Despite the apparent importance of
wave action in affecting the water quality in Utah Lake, there have been no specific studies of
waves in the lake (L. B. Merritt, oral communication, 2004; A. W. Miller, oral communication,
2004; Naylor, 2004).
43. 43
5.4 Nonpoint Sources of Pollution in the Utah Lake Drainage
5.4.1 Introduction to Nonpoint Source Pollution
According to EPA (2003a), nonpoint Source Pollution (NPS) is pollution that enters an
area from many diffuse sources. NPS pollution is caused by rainfall or snowmelt moving over
and through the ground. As the runoff moves, it picks up and carries away natural and human-
made pollutants, finally depositing them into lakes, rivers, wetlands, costal waters, and even
underground sources of drinking water.
5.4.2 Agricultural NPS’s in the Utah Lake Drainage Basin
According to the most recent National Water Quality Inventory conducted by the EPA
(EPA 2003b), agricultural NPS pollution is the leading source of water quality impacts to
surveyed rivers and lakes. Agricultural activities that cause NPS pollution include confined
animal facilities, grazing, plowing, pesticide spraying, irrigation, fertilization, planting, and
harvesting. The major agricultural NPS pollutants that result from the activities are sediment,
nutrients, pathogens, pesticides, and salts. Agricultural activities also can damage habitat and
stream channels.
Several agricultural/livestock areas surround Utah Lake. For example, Sowby and Berg
Consultants and others (1999) list 24 dairy farms and thirty-seven feedlots were located within
the watershed for Utah Lake. According to EPA (2003b) by confining animals to areas or
lots, farmers and ranchers can efficiently feed and maintain livestock. But these confined
areas become major sources of animal waste. Runoff from poorly managed facilities can carry
pathogens (bacteria and viruses), nutrients, and oxygen-demanding substances that create
water quality problems. When plants are over-fertilized or animal waste is not managed
properly, the nutrients found in these substances are able to enter the local water system and may
eventually be deposited into Utah Lake. Managing the fertilizers used for agriculture as well as
properly storing animal waste can prevent seepage of containments into the watershed that feeds
Utah Lake.
5.4.3 Sediment from NPS’s in the Utah Lake Drainage Basin
Agricultural activities and urbanization increase the amount sediment carried by fluvial
systems into Utah Lake. According to Sowby and Berg Consultants and others (1999),
44. 44
sedimentation is a particular problem due to the fact that farmland around Utah Lake must be
irrigated. Water piped from Strawberry Reservoir through Spanish Fork River sometimes
exceeds the system’s ability to carry water, making erosion quite extensive. Some of this
imported water has been re-routed for the time being to relieve this stress while still providing
the water that is needed to irrigate farmland. It is estimated that Diamond Fork feeds Spanish
Fork River with an approximate 26,500 tons of sediment a year (Sowby and Berg Consultants
and others, 1999). According to EPA (2003b), excessive sedimentation clouds the water, which
reduces the amount of sunlight reaching aquatic plants; covers fish spawning areas and food
supplies; and clogs the gills of fish. In addition, other pollutants like phosphorus, pathogens, and
heavy metals are often attached to the soil particles and may be carried to Utah Lake along with
the sediment.
To manage sediment, farmers and ranchers “can reduce erosion and sedimentation 20%
to 90% by applying management measures to control the volume and flow rate of runoff water,
keep soil in place, and reduce soil transport” (EPA, 2003b).
5.4.4 NPS’s Associated with Urbanization in the Utah Lake Drainage Basin
Prior to extensive urbanization in the Utah Lake drainage basin, there was more
vegetation and less ground was covered by buildings and paved roads. Due to the increased area
of buildings and roads, less rainfall and snowmelt seeps into the ground and there is an increased
runoff flowing into the tributaries. This water drains into the lake more quickly, carrying
chemicals such as oil, gas, antifreeze, road salt, and brake fluid off roads and directly into surface
water (EPA 2004a). The increased runoff erodes stream banks, damages stream side
vegetation, and widens stream channels. This will result in lower stream water depths during
non-storm periods, higher than normal water levels during wet weather periods, increased
sediment loads, and higher water temperatures.
The population of Utah County in 1994 (during which a major study of Utah Lake was
conducted) was reported as 290,990. (Sowby and Berg Consultants and others, 1999, pg. 2.5).
As of July 2002, Utah County’s population was reported as 398,056. (Utah County Online,
2002a). Projections estimate that by 2010, population will rise to 503,039 (Utah County Online,
2002b), increasing pollutants and construction-site problems. EPA Region 8 policies include
maintaining the volume of runoff at pre-development levels by using structural controls and
pollution prevention strategies for new developing areas (EPA, 2004a). Informing the public as
45. 45
a whole is also a vital part of reducing NPS into Utah Lake. Residential areas can increase
vegetation, allowing water to drain properly instead of directly heading for Utah Lake.
5.5 Water-Related Planning Efforts in the Utah Lake Basin (Katherine Klauzer, Eddy
Cadet, Daniel Horns)
Virtually all lands in the watershed drain to Utah Lake. As a result, it receives many
different types of contaminants, whose sources can be identified (point source pollution) as well
as those pollutants whose sources cannot be pinpointed as easily (nonpoint source pollutants).
Point and nonpoint sources of contaminants, including, urban and industrial activities,
wastewater treatment plants, stormwater discharges, commercial activities, and runoff from
agriculture, have had damaging effects on the quality of ground and surface water resources in
the area. For instance, excessive nutrient levels may have contributed to eutrophication in Utah
Lake. The major contaminants that affect the use of streams by aquatic life are suspended
sediments, nutrients, and metals. Under these conditions, surface water bodies often fall short of
meeting federal standards for surface water quality.
To address the problems caused by the various land-use activities in the area, the Utah
Division of Water Quality (DWQ) has assessed and classified the beneficial uses of most of the
water bodies in the basin. Utah Lake has been designated by DWQ as (Class 2B), which protects
the lake for secondary contact recreation, such as boating, wading, or similar uses; (Class 3B)
protects the water body for warm water species of game fish and other warm water aquatic life,
including the necessary aquatic organisms in their food chain; and (Class 3D) which protects it
for waterfowl, shore birds, and other-water oriented wildlife not included in Classes 3A, 3B, or
3C (Boyd and Cassel, 2005).
5.5.1 Utah’s Programs for Nonpoint Source Regulation
According to EPA (2004b), Utah is one of only a few states in the nation where
management and implementation of the Nonpoint Source Program is shared and coordinated
through two state agencies: Utah Department of Environmental Quality (UDEQ) and the Utah
Department of Agriculture and Food (UDAF). These agencies have a fully-developed and
operational watershed approach that has been in effect for about a decade, including intensive
basin assessments, prioritization and targeting, extensive stakeholder involvement, and strategic
46. 46
rotational monitoring. Key elements of the approach include information, education and
training, research and demonstrations; prioritization of watersheds; assessment of animal feed
operations; and a well-defined timeline including permitting goals and objectives, compliance
milestones and permit development. Utah holds an annual NPS Conference at different locations
5.5.2 Implications of the Federal Clean Water Act for Nonpoint Source Pollution
Congress enacted Section 319 of the Clean Water Act in 1987, establishing a national
program to control nonpoint sources of water pollution (EPA 2004c). The nonpoint source
program is entirely non-regulatory at the Federal level; States may use regulatory approaches,
but are not required to do so. In the absence of regulatory authority, EPA's most significant
means of implementing an effective national nonpoint source program is the grants program to
states. Projects that have received funding from Section 319 grants have ranged from
information and educational programs to the demonstration of innovative technologies and
watershed-based approaches to solving water quality problems. With the help of Section 319
grants, States have been able to address site- and watershed-specific water quality problems as
well as to initiate and maintain State-wide nonpoint source programs.
5.5.3 The TMDL Process
Because of the potential for impairment, Utah Lake has been identified as a priority target
for the state’s water quality improvement effort. Recent monitoring activities conducted by
DWQ reveal that Utah Lake has exceeded state water quality criteria for Total Dissolved Solids
(TDS), and total phosphorus (TP) (Utah Division of Water Quality, 2000). For this reason, Utah
Lake is listed on the state’s 303(d) list of non-supporting waters for these constituents (Utah
Division of Water Quality, 2000). The listing of the lake on the 303(d) requires that a Total
Maximum Daily Load (TMDL) study be completed. The purpose of the TMDL study is to
address the pollutants of concern in the watershed through analysis of sampling data collected
and other resources (such as wastewater release permits) at specified times during the year. This
is accomplished in several steps: Once the water body is identified, the State determines the
source (s) of the water quality problem and allocates responsibility for controlling the pollution.
The State then determines the reduction in pollutant loading necessary for that water body in
order to meet water quality standards.
47. 47
These processes may take several years to complete. Currently, existing data are not
considered adequate to reach a definite conclusion. The recent report on the TMDL study for
Utah Lake has recommended the continuation of the study (Boyd and Cassel, 2005). They also
suggested that additional sampling be done, although supplementary data is not expected to
change existing results significantly.
48. 48
6.0 Commercial and Cultural Activities (Darwin Demming, Emily Bartlett, Shayne
Galloway, Daniel Horns; Utah Valley State College)
The population of Utah County in 1994 (during which a major study of Utah Lake was
conducted) was reported as 290,990. (Sowby and Berg Consultants and others, 1999, pg. 2.5).
As of July 2002, Utah County’s population was reported as 398,056. (Utah County Online,
2002a). Projections estimate that by 2010, population will rise to 503,039 (Utah County Online,
2002b),
6.1 Mining Activities within and near Utah Lake
Information on mine permits provides an understanding of what kind of minerals are
available near Utah Lake. Mine permits are split into large and small permits and are classified
by property name, operator, and product. Both large and small mine sites are located on the west
side of Utah Lake (Bon and Wakefield, 1999) (Figure 6.1).
6.1.1 Large Mines
Large mine permits operated by Interstate Brick Company excavate clay for bricks. Sites
include Powell and Jim Gay (Bon and Wakefield, 1999 a and b). Interstate Brick has excavated
high quality clay from the Jim Gay and Powell mines since the 1950’s. The Powell mine is
estimated to have enough reserves to produce clay for another 10 years. The Jim Gay could
potentially produce for many more years. Housing development has grown rapidly on the west
side of the lake and could potentially impede product extraction in the future (J. Huit, oral
communication, 2004).
Interpace Industries, Inc. mines clay and shale for brick at a site called Clinton. The mine
is approximately 100 years old and still produces a high quality and quantity of material. The
company estimates the mine has about 20 years of production left before it becomes
economically inefficient (A. Hancock, 2004).
Pelican Point Rock Product Company (formerly Larsen Limestone Company) mines
limestone and dolomite at the site Pelican Point. Their product is mainly used for construction,
flue gas desulphurization in coal-fired power plants, and steelmaking. A small amount of
limestone and dolomite was also crushed to a fine powder and marketed as “rock dust” to the
coal mining industry (Gloyn and Bon, 2002).
49. 49
Valley Asphalt Co. mined sand and gravel mainly for construction at the site near Lehi
(Bon and Wakefield, 1999). The company has been out of business for over two years because
of bankruptcy due to some legal issues (Hester, 2001).
6.1.2 Small Mines
The Interstate Brick Company mines clay at small mine sites at Black Shale Mine and
Snow White (Bon and Wakefield, 1999).
Cedarstrom Calcite Company mines calcite used mostly for a calcium supplement for
chicken feed and sometimes for livestock. The mine has been in use since the 1920’s and no
limit has been estimated for the amount of calcite still available (P. Pugh, 2004).
6.1.3 Hydrocarbon Potential
According to Morgan (2005), there is a very minor potential for petroleum reserves
beneath Utah Lake. While there is some potential that petroleum exists within Tertiary and
Paleozoic sediments buried deep beneath the lake, there has only been one significant petroleum
exploration well drilled in Utah Valley. The well was drilled to a depth of 12,995 feet east by
Payson by Gulf Oil. The well bottomed out in Miocene deposits, never encountering Paleozoic
sediments or significant petroleum (Price and Conroy, 1988; Morgan, 2005).
51. 51
6.2 Recreation
Utah Lake has a long history of recreation and tourism that have been recently impacted
by public perceptions of the lake. This summary relies on available data and anecdotal literature
compiled from public records. A complete understanding of the current and projected use of the
resources requires collection of additional data from resource users, neighbors, and state, local
and associated businesses. Found here is a summary of the history of recreation and its decline
on Utah Lake, as well as data compiled by Utah State Parks on the use within the state park
portion of the lake.
6.2.1 Recreation History
Utah Lake, the largest freshwater lake west of the Mississippi, has been an important
source of recreation throughout the years, (Jackson and Stevens, 1981). In the mid 1800’s
Mormon settlers began using Utah Lake as a means of survival. Not too long after settling in the
area Utah Lake became a source of recreation and leisure; in fact, Anglo settlers ranked
recreation as the lake’s third most important use (Clean Lakes Program Application for Utah
Lake).
Toward the late 1800’s many recreational and leisure activities on and near the lake
began to develop (Carter, 2002). These activities included boat racing, horse races, waterskiing,
ferry rides across the lake, swimming, bonfires, fishing, dancing and live music, community
events, picnics, duck hunting, and opening of resorts (Carter, 2002). Boat racing started in the
1890’s, but because of the shallowness of the water the races were soon called off. In 1938,
however, races started again with Memorial Day boat racing. People came from all over the
nation to participate. This was a spectacular event among residents. These races lasted well into
the1970’s. Commenting on these races, Bill Loy, Jr., fourth generation Utah Lake commercial
fisherman says “Boat races, that was the big thing. There were more boat racers in Utah County
[than in any other county] in the United States. It had every class imaginable. What they call
skip jacks about 12 feet long…all the way up to unlimited hydroplanes” (Carter, 2002).
Horse racing was another exciting event. People from miles away came to enjoy the
thrill of a great race. Cabins provided a nice place for visitors to stay. Bonfires, wildlife
watching and other community events gave residents and others visiting the ability to soak in the
52. 52
atmosphere of the lake without having to spend money (Carter, 2002). In the summer activities
such as water skiing were enjoyed by many. Originally they used what they called surf boards,
(Carter, 2002) (comparable to a wakeboard), to glide on behind the boat. Ferry rides across the
lake were great for all ages to go and enjoy a beautiful day on the lake. Likewise dancing
combined with live orchestras or bands provided an attraction for young and old alike, (Carter,
2002). Utah Lake became a great place for a date or a nice social night out. Throughout the year
swimming was enjoyed. Since Saratoga resort had its natural hot springs to heat their pools
year-round, it became very popular. Resorts provided swimsuit rentals and a fun atmosphere,
most provided slides and diving boards (Carter, 2002).
The most popular of the Utah Lake resorts from the mid-1800’s through the mid 1900’s
included Saratoga resort, Geneva resort, Garden City resort, Provo Lake resort, and Provona
Beach resort (Table 6.1). Saratoga resort, as previously mentioned, was known for its naturally
heated water from near by hot springs providing swimming year round. Amenities of the resort
included swimming, dancing, boating, fishing, and a café service. Saratoga adopted waterslides,
thrill rides, and even a Ferris wheel. Today the Ferris wheel and carnival rides are gone, but
remains of the old resort can be found.
Saratoga Springs is now a lakeside community. Geneva resort, located where Lindon boat
harbor is today, included boating, picnicking, dancing, a hotel and a saloon. Wealthy families
rented cabins and spent their vacations here, says Caleb Warnock, reporter for the Daily Herald.
Garden City resort provided visitors with swimsuits to rent, bath houses, opera house bands,
dancing, horse racing, and ferry rides. Provo Lake resort was the same as Garden City resort,
just under new ownership. Provona Beach resort was known for its fun, clean, family
environment. Picnicking, bathhouses, swing sets, and plane rides were available (Carter, 2002).
53. 53
Resort Name Dates of Operation Available activities
Saratoga Springs 1860’s – 1972 ca. Baths, swimming pools, pavilions
for dancing, picnicking.
Walker-Chessman 1870’s – early 1900’s Hotel, restaurant, boat rental
Woodbury park 1880–1888 Summer cottage, bath houses,
dance pavilion, boat dock
Old lake Resort 1883–1907 Pavilion, boat house, ice house,
restaurant, bath house, 2 piers
Geneva 1888–1935 Hotel, saloon, bath houses,
pavilion, boat harbor
Lincoln beach 1889–1900 ca. Tourist house, swimming pool,
store, saloon, dance pavilion
American Fork Resort 1892–1930’s Dance hall, pool hall, piers,
picnic facilities, café, bath houses
Murdock Resort 1894–1900 ca. Dance pavilion, picnic facilities,
bath houses
Jepperson’s Boat House 1890’s–1920 Picnic facilities, piers, boat
harbor, boat yard, refreshment
stands
Knudsens resort 1913–1918 ca. Boat rentals, fishing equipment
rental, picnic facilities
Loy resort 1913–1925 Boat rentals, picnic tables,
bathing facilities
Provona (Taylor Resort) 1825–1930’s Store, dance hall, 30 cabins, bath
houses, picnic facilities
Table 6.1 – Resort History on Utah Lake. Compiled from Carter (2002).
54. 54
In addition to these resorts, fishing continued to be a very important source of recreation.
Although much of the fishing on Utah Lake was out of necessity, fishing also became a time of
leisure and relaxation. Ducks were plentiful around the lake, so hunters took the opportunity for
some good duck hunting. Because duck hunting became so popular, conservation measures were
installed (Carter, 2002).
6.2.2 Estimates of Recreation Use Numbers on Utah Lake
Utah State Parks maintains annual counts of users entering Utah Lake State Park. Table
6.2 details the counts from 1980-2002. Despite a gap in data collection in 1983-1984, the data
depicts significantly great summer use of the resource, as well as trends in overall annual
visitation.
Chart 1 illustrates the trend in overall annual visitation. There is a distinct drop in use
through the mid and late 1980’s, and another drop beginning in 1999 and continuing through the
end of the data period. No information was provided by Utah Lake State Park regarding the
factors impacting the trends in recreation use.
Utah State Parks provided estimates of percentage of use by activity and time of year
(season). Table 6.3 gives the percentages of use on the lake throughout the year according by
activity and season. The data only reflect use at Provo Boat Harbor. The highest percentage use
is fishing throughout the year. Water sports and camping constitute a significant portion of use
during the warmer months. Interestingly, wildlife watching exhibits a significant percentage of
use during the colder months, possibly indicating a sizable population of bird watching during
annual migrations.