1. Fluorescence recovery after photobleaching of tau in cortical neurons
Ashlyn Johnson1, Sarah Kaufman2, and Marc Diamond2
1Department of Biological Sciences, North Carolina State University, Raleigh, NC 27607
2Center for Alzheimer’s and Neurodegenerative Diseases, University of Texas Southwestern Medical Center, Dallas, TX 75390
Introduction
Methods
Acknowledgements
Conclusions and Future Directions
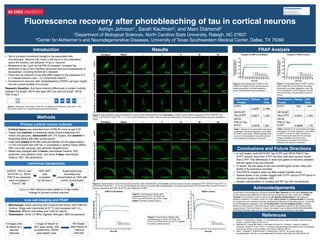
Results FRAP Analysis
References
I would like to acknowledge and sincerely thank Dr. Marc Diamond and the entire Diamond Lab
for their patience and willingness to teach and train a beginning scientist. Thank you to Talitha
Thomas for her training in neuron cultures and Dr. Barbara Stopschinski for her training in
lentivirus production. In addition, thank you to Dr. Nancy Street and Vanessa Powell for directing
and organizing such a fantastic Summer Undergraduate Research Fellowship program. I would like
to acknowledge the assistance of the UT Southwestern Live Cell Imaging Facility, a Shared
Resource of the Harold C. Simmons Cancer Center, supported in part by an NCI Cancer Center
Support Grant, 1P30 CA142543-01. Finally, this research was funded by NIH/NIA R01AG048678,
NIH/NINDS R01NS071835, the Tau Consortium, and the Cure Alzheimer’s Fund (MID).
Primary cortical neuron cultures
Ø Cortical tissue was extracted from C57BL/6J mice at age E18.
Ø Tissue was washed in dissecting media (Hank’s Balanced SS
media and gluocse), dissociated with .5% trypsin, and washed in
dissecting media with fetal bovine serum.
Ø Cells were plated at 60,000 cells per MatTek 35 mm glass bottom,
14 mm microwell dish with No. 0 coverglass in plating media (MEM,
FBS, pyruvate, glucose, and penicillin-streptomycin).
Ø Media was changed after 3 hours (neurobasal medium, B27,
glutamine, and glutamic acid) and every 3 days (neurobasal
medium, B27, and glutamine).
Lentivirus transduction
psPAX2, VSV-G, and
4R1N WT or 4R1N
P301S tau plasmids
were incubated in
TransIT 293
HEK 293T
cells
incubated
for 48 hours
Supernatant was
harvested and
concentrated at 100X with
LentiX Concentrator
3 µLs of 100X lentivirus were added to 3 day media
change of primary cortical neurons
Live cell imaging and FRAP
Ø Microscope: Andor spinning disk confocal with Andor Ultra EMCCD
camera. Stage was maintained at 37 ºC and equipped with CO#.
Ø Objective: 60X for cell bodies and 100X for axons.
Ø Parameters: 16-bit (10 MHz) digitizer, 300 gain, 300 ms exposure
5 images prior
to bleach at 1
second
intervals
1 image of bleach at
30% laser power, 500
µs dwell time, 20X20
pixel bleach area
60 images
after bleach at
1 second
intervals
Ø In cell bodies, both 4R1N WT Tau-EYFP and 4R1N P301S Tau-
EYFP recover more than EYFP but they both also recover slower
than EYFP. The differences in level and speed of recovery between
the two types of tau are minimal.
Ø In axons, the two types of tau also exhibit highly similar rates and
levels of fluorescence recovery.
Ø The P301S mutation does not alter overall mobility of tau.
Ø Assess levels of tau protein tagged with EYFP versus EYFP alone in
neuronal lysate via Western Blot.
Ø Assess colocalization of mutated and WT tau with microtubules.
Figure 5. Fluorescence intensity after
photobleaching of EYFP, 4R1N WT Tau-
EYFP, and 4R1N P301S Tau-EYFP in axons
of primary cortical neurons.
Pre-bleach Bleach 1
EYFP
5 10 30 60
4R1NWTTau-EYFP4R1NP301STau-EYFP
Figure 2. Representative results of fluorescence recovery after photobleaching of the cell bodies of primary cortical neurons expressing EYFP, 4R1N WT Tau-
EYFP, or 4R1N P301S Tau-EYFP. 1, 5, 10, 30, and 60 indicate the number of seconds after photobleaching. 30 neurons per experimental group were subjected to
FRAP.
Pre-bleach Bleach 1 5 10 30 60
EYFP4R1NWTTau-EYFP
Figure 3. Representative results of fluorescence recovery after photobleaching of the axons of primary cortical neurons expressing EYFP, 4R1N WT Tau-EYFP, or
4R1N P301S Tau-EYFP. 1, 5, 10, 30, and 60 indicate the number of seconds after photobleaching. 10 neurons expressing EYFP or 4R1N P301S Tau-EYFP and 18
neurons expressing 4R1N WT Tau-EYFP were subjected to FRAP.
4R1NP301STau-EYFP
0 5 10 15 20 25 30 35 40 45 50 55 60 65 70
0.0
0.1
0.2
0.3
0.4
0.5
0.6
0.7
0.8
0.9
1.0
1.1
Seconds
FluorescenceIntensity
FRAP in Axons
EYFP
4R1N WT Tau-EYFP
4R1N P301S Tau-EYFP
0 5 10 15 20 25 30 35 40 45 50 55 60
0.0
0.2
0.4
0.6
0.8
1.0
Seconds
NormalizedFluorescence
IntensityAfterBleach
Analysis of FRAP in Cell Bodies
0 5 10 15 20 25 30 35 40 45 50 55 60
0.0
0.2
0.4
0.6
0.8
1.0
Seconds
NormalizedFluorescence
IntensityAfterBleach
Analysis of FRAP in Axons
EYFP
4R1N WT Tau-EYFP
4R1N P301S Tau-EYFP
EYFP
4R1N WT Tau-EYFP
4R1N P301S Tau-EYFP
Figure 6. Normalized data of FRAP in cell
bodies that is fitted with an exponential one-
phase association non-linear regression
curve. Only the fitted curves are shown.
Figure 7. Normalized data of FRAP in axons
that is fitted with an exponential one-phase
association non-linear regression curve. No
curve is present for EYFP because the data
did not converge. Only the fitted curves are
shown.
0 5 10 15 20 25 30 35 40 45 50 55 60 65 70
0.0
0.1
0.2
0.3
0.4
0.5
0.6
0.7
0.8
0.9
1.0
1.1
Seconds
FluorescenceIntensity
FRAP in Cell Bodies
EYFP
4R1N WT Tau-EYFP
4R1N P301S Tau-EYFP
Figure 4. Fluorescence intensity after
photobleaching of EYFP, 4R1N WT Tau-
EYFP, and 4R1N P301S Tau-EYFP in cell
bodies of primary cortical neurons.
Fluorescent
Protein
Plateau Half-
Time
EYFP
0.5237 0.788
4R1N WT
Tau-EYFP 0.6571 1.342
4R1N
P301S Tau-
EYFP 0.6579 1.321
Fluorescent
Protein
Plateau Half-
Time
EYFP N/A N/A
4R1N WT
Tau-EYFP 0.6541 1.164
4R1N
P301S Tau-
EYFP 0.6926 1.172
Table 1. Results of an exponential one-phase
association non-linear regression curve fitted
to FRAP in cell bodies. Plateau indicates how
much of the fluorescence recovered and half-
time indicates how quickly it recovered.
Table 2. Results of an exponential one-phase
association non-linear regression curve fitted
to FRAP in axons. No data is present for
EYFP because the data did not converge.
Plateau indicates how much of the
fluorescence recovered and half-time
indicates how quickly it recovered.
Ø Tau is a protein commonly thought to be associated with
microtubules1. Beyond this, there is still much to be understood
about the function and behavior of tau in neurons.
Ø Mutations in tau, such as the P301S mutation, increase the
likelihood of tau to form fibrillary structures that are characteristic of
tauopathies, including Alzheimer’s disease2.
Ø There are six isoforms of tau that differ based on the presence of 3
or 4 repeat domains and 1 or 2 N-terminal inserts3.
Ø Fluorescence recovery after photobleaching (FRAP) can give insight
into the overall mobility of a protein.
R1 R2 R3 R4N1
Research Question: Are there inherent differences in protein mobility
between full length, 4R1N wild type (WT) tau and full length, 4R1N
P301S tau?
Figure 1. Illustration of full length, 4R1N tau. N1 signifies an N-terminal insert and R1, R2,
R3, and R4 signify the 4 repeat microtubule binding domains.
1. Binder LI, Frankfurter A, Rebhun LI. The distribution of tau in the mammalian central nervous
system. J Cell Bio 1985;101(4):1371-8.
2. Sperfeld AD, Collatz MB, Baier H, Palmbach M, Storch A, Schwarz J, Tatsch K, Reske S,
Joosse M, Heutink P, et al. FTDP-17: An early-onset phenotype with parkinsonism and epileptic
seizures caused by a novel mutation. Ann Neurol 1999;46:708-15.
3. Buée L, Bussiere T, Buée-Scherrer V, Delacourte A, Hof PR. Tau protein isoforms,
phosphorylation and role in neurodegenerative disorders. Brain Res Rev 2000;33:95-130.