Evaluation of ProcessingTechnologies for UCB
•
0 likes•33 views

For more details visit: http://www.cryoviva.in/
Recommended

Recommended
More Related Content
Viewers also liked
Similar to Evaluation of ProcessingTechnologies for UCB
Similar to Evaluation of ProcessingTechnologies for UCB (20)
Recently uploaded
Recently uploaded (20)
Evaluation of ProcessingTechnologies for UCB
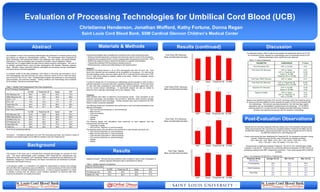
- 1. Evaluation of Processing Technologies for Umbilical Cord Blood (UCB) Christianna Henderson, Jonathan Wofford, Kathy Fortune, Donna Regan Saint Louis Cord Blood Bank, SSM Cardinal Glennon Children’s Medical Center Abstract Background Materials & Methods 1 2 An evaluation of three UCB processing technologies was performed to compare product purity and potency as defined by characterization markers. The technologies were PrepaCyte-CB (BioE, Minnesota), AXP AutoXpress Platform (GE Healthcare, New Jersey), and Sepax (Biosafe, Switzerland). These technologies were compared to SLCBB’s manual Hetastarch method. PrepaCyte-CB is a reagent based two-step manual method requiring centrifugation. The AXP is an optically controlled device using two-step centrifugation with operator interaction between steps. Biosafe’s Sepax instrument performs automated cell processing through centrifugation and optical sensor controlled separation. To maintain validity of the data comparison, UCB utilized in this study was harvested in 35 ml CPD anticoagulant, less than 48 hours old, had a minimum volume of 45 mL neat cord blood, and a minimum TNC of 0.9 x 10e9. Characterization analysis was performed on pre-processing, post-processing, and post-thaw samples. Testing conditions and methodology were consistent for all samples. Results are presented below. Post Processing Characteristics SLCBB PrepaCyte-CB Sepax AXP TNC Recovery (%) 86.0 84.0 83.0 78.0 TMNC Recovery (%) 85.5 83.5 84.0 90.5 CD34+ x 106 3.2 4.1 3.5 2.2 CFU x 105 12.0 10.3 11.7 8.7 Trypan Blue (%) 94.0 97.5 98.0 95.0 7-AAD (%) 95.5 97.1 90.6 95.1 Post Thaw Characteristics SLCBB PrepaCyte-CB Sepax AXP TNC Recovery (%) 81.8 89.9 85.8 79.7 TMNC Recovery (%) 92.0 87.0 93.0 80.0 CD34Recovery (%) 68.5 76.1 80.8 67.1 CFU Recovery (%) 52.9 80.2 62.7 47.0 Trypan Blue (%) 68.0 72.0 73.0 78.0 7-AAD (%) 48.0 48.2 50.0 95.0 Table 1: Median Post Processing and Post Thaw Comparisons *N=10 for all processing methods Conclusion: Prompted by significant CFU and TNC recoveries post thaw, and minimum impact to operations and capital budget, the SLCBB has initiated a trial with PrepaCyte-CB. The purpose of this study was to evaluate three emerging technologies for reduction of UCB units. The three methodologies under evaluation were PrepaCyte-CB (manufactured and distributed by BioE, Minnesota), AXP AutoXpress Platform (manufactured and distributed by GE Healthcare, designed by ThermoGenesis) and Sepax (manufactured and distributed by Biosafe, Switzerland and Biosafe America). In all business models, it is imperative to be vigilant for opportunities to improve and minimize time and effort while maximizing output and efficiency. Current processing of UCB at the SLCBB involves a manual, minimally manipulative technique. In order to expand operations it is critical to identify a process that will improve current workflow operations for technical staff while ensuring the production of a quality end product. The three technologies were evaluated and compared to the current manual technique • Utilizing consistent equipment, processes and personnel used for routine UCB processing; • Subjecting the processed UCB to normal cryopreservation temperatures at less than -150ºC; • Performing a segment study to determine the effects on segment characteristics; • Thawing the processed UCB according to standard protocol. • Performing purity, potency and safety testing on the thawed product. Specimen: Umbilical Cord Blood Harvest in 35 ml CPD anticoagulant less than 48 hours old. Cord blood units collected that are unlabeled will be acceptable for processing. For units that do not make banking criteria, minimum criteria will be 45 mL neat cord blood volume and a TNC of 0.9 x 10e9 will be utilized to maintain validity of the study. Where it is possible, varying volumes will be utilized. A minimum sample size of 10 products per methodology will be evaluated in order to yield a sufficient population to produce data with a significant statistical outcome. At the point when 10 units have been processed by each method, data will be evaluated against each other and the current manual methodology. A cost-benefit analysis will also be utilized to determine which alternate methodology will be fully validated, if any. Procedure: Initial samples were taken to determine pre-processing counts. Once processed by the respective technology, documentation was provided to determine where ancillary samples could be collected for each technology. Ancillary samples were used to determine the TNC fraction of each component separated. The following assays and calculations were performed on each cord blood processed by the different technologies: • TNC recovery (pre-processing vs. post-processing) • MNC recovery • CD34 enumeration • CFU assay • Viability • Sterility The following assays and calculations were performed on each segment from the cryopreserved cord blood unit: • Trypan Blue Viability • CFU recovery (segment vs. post-processing) The following assays and calculations were performed on each thawed cord blood unit: • TNC recovery (post thaw vs. post processing) • MNC recovery (post thaw vs. post processing) • CD34 recovery (post thaw vs. post processing) • CFU recovery (post thaw vs. post processing) • Viability • Sterility AXP Sepax PrepaCyte-CB SLCBB AXP Sepax PrepaCyte-CB SLCBB AXP Sepax SLCBB Results AXP Sepax SLCBB Results (continued) Post-Thaw TNC Recovery Mean and Standard Deviation Post-Thaw CD34+ Recovery Mean and Standard Deviation Post-Thaw CFU Recovery Mean and Standard Deviation Post-Thaw Viability Mean and Standard Deviation Discussion For statistical analysis, ANOVA was the test applied and significance defined as P<0.05. All comparative results between the methodologies were unremarkable except for the following parameters where significance was observed: Based on the significant post-thaw TNC and CFU recoveries within the PrepaCyte group, an exclusive trial was initiated to further evaluate the quality of UCB units processed with this methodology. This decision was also prompted by the fact that major capital expenditure was not necessitated in transitioning to this technology. The SLCBB is exploring options for a similar trial with the leading automated technology to directly compare more significant test groups with the respective methodology. Post-Evaluation Observations Results from the trial have supported what was initially seen in the evaluation test group data. While post-processing TNC recoveries are consistent between PrepaCyte-CB (86%) and the SLCBB HES method (85%), post-processing WBC recovery has increased from 87% with the SLCBB HES method to 91% with PrepaCyte-CB. A thaw control group has been established for PrepaCyte-CB, for comparative purposes moving forward. Within this group (N=25), mean recoveries are reported as follows: TNC = 89% (SD = 4%); TMNC = 87% (SD = 6%); CD34+ = 63% (SD = 15%); CFU = 72% (SD = 14%); TB viability = 71% (SD = 6%). One parameter of significance between PrepaCyte –CB and all other methodologies initially evaluated, is hematocrit. PrepaCyte-CB is extremely effective at depleting the RBC fraction at processing, leading to less RBC contamination post-thaw. Thaw control groups data is reported as below. PrepaCyte-CB PrepaCyte-CB PrepaCyte (N=25) HES (N=25) Average Hct (%) Min. Hct (%) Max. Hct (%) Pre-processing 35.5 35.2 28.3 26.6 48.4 44.3 Post-Processing 8.2 43.7 2.3 36.4 14.7 49.9 Post-Thaw 3.9 20.6 2.0 13.0 6.7 25.2 PARAMETER COMPARISON P Value Post-Processing TNC AXP vs. SLCBB <0.01 Post-Thaw TNC Recovery AXP vs. Sepax AXP vs. PrepaCyte-CB Sepax vs. SLCBB PrepaCyte-CB vs. SLCBB <0.01 <0.001 <0.05 <0.01 Post-Thaw TMNC Recovery AXP vs. Sepax <0.01 Post-Thaw CFU Recovery AXP vs. PrepaCyte-CB PrepaCyte-CB vs. SLCBB <0.001 <0.05 Segment CFU Recovery AXP vs. SLCBB Sepax vs. SLCBB <0.05 <0.05 Segment Viability AXP vs. Sepax AXP vs. PrepaCyte-CB AXP vs. SLCBB <0.01 <0.05 <0.01 Results Segment Characteristics SLCBB PrepaCyte-CB Sepax AXP CFU Recovery (%) 59.0 54.5 38.5 34.5 Viability (%) (TB) 83.0 82.0 80.5 77.0 Segment Analysis: Although the exact predictive value of segment data is under investigation at present, segment descriptive data is represented as follows: Table 2: Median Segment Comparisons Table 4: Hct Comparison (SLCBB HES vs. PrepaCyte-CB) Table 3: P values of significance