Assessment of housing conditions for a developing urban slum using geospatial analysis
•
1 like•193 views


Recommended
Recommended
More Related Content
Similar to Assessment of housing conditions for a developing urban slum using geospatial analysis
Similar to Assessment of housing conditions for a developing urban slum using geospatial analysis (20)
More from Alexander Decker
More from Alexander Decker (20)
Assessment of housing conditions for a developing urban slum using geospatial analysis
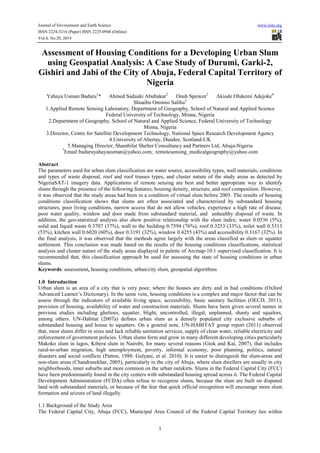
- 1. Journal of Environment and Earth Science www.iiste.org ISSN 2224-3216 (Paper) ISSN 2225-0948 (Online) Vol.4, No.20, 2014 1 Assessment of Housing Conditions for a Developing Urban Slum using Geospatial Analysis: A Case Study of Durumi, Garki-2, Gishiri and Jabi of the City of Abuja, Federal Capital Territory of Nigeria Yahaya Usman Badaru1 * Ahmed Sadauki Abubakar2 Onuh Spencer3 Akiode Olukemi Adejoke4 Shuaibu Onimisi Salihu5 1.Applied Remote Sensing Laboratory, Department of Geography, School of Natural and Applied Science Federal University of Technology, Minna, Nigeria 2.Department of Geography, School of Natural and Applied Science, Federal University of Technology Minna, Nigeria 3.Director, Centre for Satellite Development Technology, National Space Research Development Agency 4.University of Abertay, Dundee, Scotland-UK 5.Managing Director, Shambilat Shelter Consultancy and Partners Ltd, Abuja-Nigeria * Email:badaruyahayausman@yahoo.com; remotesensing_medicalgeography@yahoo.com Abstract The parameters used for urban slum classification are water source, accessibility types, wall materials, conditions and types of waste disposal, roof and roof trusses types, and cluster nature of the study areas as detected by NigeriaSAT-1 imagery data. Applications of remote sensing are best and better appropriate way to identify slums through the presence of the following features; housing density, structure, and roof composition. However, it was observed that the study areas had been in a condition of virtual slum before 2005. The results of housing conditions classification shows that slums are often associated and characterized by substandard housing structures, poor living conditions, narrow access that do not allow vehicles, experience a high rate of disease, poor water quality, window and door made from substandard material, and unhealthy disposal of waste. In addition, the geo-statistical analysis also show positive relationship with the slum index; water 0.0536 (5%), solid and liquid waste 0.3707 (37%), wall to the building 0.7594 (76%), roof 0.3253 (33%), toilet wall 0.5313 (53%), kitchen wall 0.6020 (60%), door 0.3191 (32%), window 0.4255 (43%) and accessibility 0.3167 (32%). In the final analysis, it was observed that the methods agree largely with the areas classified as slum or squatter settlement. This conclusion was made based on the results of the housing conditions classifications, statistical analysis and cluster nature of the study areas displayed in palette of Arcmap-10.1 supervised classification. It is recommended that, this classification approach be used for assessing the state of housing conditions in urban slums. Keywords: assessment, housing conditions, urban/city slum, geospatial algorithms 1.0 Introduction Urban slum is an area of a city that is very poor, where the houses are dirty and in bad conditions (Oxford Advanced Learner’s Dictionary). In the same vein, housing conditions is a complex and major factor that can be assess through the indicators of available living space, accessibility, basic sanitary facilities (OECD, 2011), provision of housing, availability of water and construction materials. Slums have been given several names in previous studies including ghettoes, squatter, blight, uncontrolled, illegal, unplanned, shanty and squalors, among others. UN-Habitat (2007a) defines urban slum as a densely populated city exclusive suburbs of substandard housing and house to squatters. On a general note, UN-HABITAT group report (2011) observed that, most slums differ in sizes and lack reliable sanitation services, supply of clean water, reliable electricity and enforcement of government policies. Urban slums form and grow in many different developing cities particularly Makoko slum in lagos, Kibera slum in Nairobi, for many several reasons (Giok and Kai, 2007), that includes rural-to-urban migration, high unemployment, poverty, informal economy, poor planning, politics, natural disasters and social conflicts (Patton, 1988: Gulyani, et al. 2010). It is easier to distinguish the slum-areas and non-slum areas (Chandrasekhar, 2005), particularly in the city of Abuja, where slum dwellers are usually in city neighborhoods, inner suburbs and more common on the urban outskirts. Slums in the Federal Capital City (FCC) have been predominantly found in the city centers with substandard housing spread across it. The Federal Capital Development Administration (FCDA) often refuse to recognize slums, because the slum are built on disputed land with substandard materials, or because of the fear that quick official recognition will encourage more slum formation and seizure of land illegally. 1.1 Background of the Study Area The Federal Capital City, Abuja (FCC), Municipal Area Council of the Federal Capital Territory lies within
- 2. Journal of Environment and Earth Science www.iiste.org ISSN 2224-3216 (Paper) ISSN 2225-0948 (Online) Vol.4, No.20, 2014 2 latitudes 90 20’ N and 90 25’ N of the equator and within longitudes 50 45’ E and 70 39’ E (Figure 1). The study areas is bordered to the north by Bwari Area Council, to the east by Nasarawa State, to the south west by Kuje Area Council and to the west by Gwagwalada Area Council. At the 2006 population census, the city of Abuja Municipality Area Council had a population of 776,298 and an area of 890km2 , the Federal Capital City (FCC) cover an area of about 250 sq. km2 . The specific study area includes; Jabi, Durumi, Garki-2 and Gishiri situated either in city neighborhoods, inner suburbs and city outskirts. Figure 1. The map of the Federal Capital City, Abuja, Nigeria 1.2 Statement of Research Problem The environment and geography of urban/city slum is complex, and to understand the evolutional fact behind that statement, many isolated field questions must be entertain and not to be seen as discrete entities, for they interact with each other. Toward this end the following research questions are postulated; • is there any observed defects in housing conditions in the city slum, • Can the levels of building material used be adequately classified, • Can slum be detected with geo-spatial tools? The slum area has witnessed remarkable expansion, growth and developmental activities such as crimes, illegal waste disposal, poor infrastructure and bad reputations. It is therefore necessary for a study such as this to be carried out if urban slum will avoid the associated problems of a growing and expanding criminality, incidence of diseases and substandard houses. 1.3 Aim and Objectives The aim of this study is to assess the housing conditions as they influence the growth of urban slum or squatter settlement in the Federal Capital City, Abuja, Nigeria. To achieve the aim, the study will focus on the following objectives: a. To develop a classification scheme for identifying urban or city slum b. To facilitate a comparative analysis of housing conditions in the study areas c. To provide a comprehensive analysis of the dwelling and its condition d. To assess the accuracy of the classifications 2.0 Slum and Housing Studies According to World Bank statement report (2008) that explains the reasons behind movement of people to urban areas is primarily due to more jobs are achievable in cities, reliable living conditions, and promises competent hospital and health services. Hammel (1964) was of the opinion that urbanization creates slums because local governments administrator are unable to manage urban areas and migrant workers without an affordable place to live in, therefore, dwell in slums, squat within walking distance to their place of formal or informal employment. UN-HABITAT (2013) have estimated around 33% of the urban population in the developing world in 2012, or about 863 million people (United Nation, 2003), lived in slums. Their report further expatiates the proportion of urban population living in slums areas in Sub-Saharan Africa as 61.7%, South Asia 35%, Southeast Asia 31%, East Asia 28.2%, West Asia 24.6%, Oceania 24.1%, Latin America and the Caribbean 23.5%, and North Africa
- 3. Journal of Environment and Earth Science www.iiste.org ISSN 2224-3216 (Paper) ISSN 2225-0948 (Online) Vol.4, No.20, 2014 3 13.3%. But taking into consideration of individual countries, the proportion of urban residents living in slum in 2009 was highest in the Central African Republic 95.9%. Understanding slum can be complex and confusing, because isolated and disperse slum might be sharing land with the most developed built urban city, characterized by substandard housing structures (Kundu, 2003). Similarly, Kimani-Murage and Ngindu (2007), expresses dismay on the number of people occupying single apartment, further states that above five persons share a one- room or 45 m2 of single apartment, the same room is equally used for cooking, sleeping and living, particularly slum of Kolkata, India. 2.1 Poverty, Crime and Disease with respect to slum studies UN-HABITAT (2007b) strongly stresses that poverty encourages the formation and demand for slums, particularly in developing countries. UN-HABITAT further explains that slums are often the only principal option for the urban poor of which the incidence rate of slums correlates to poverty. However, slum dwellers occasional do experiences a high rate of disease (Desai, 2003), nevertheless critical one that have been reported in slums includes cholera, HIV/AIDS (Burns and Snow, 2012), malaria (Bhattacharya, et al., 2013), typhoid (Corner, et al., 2013) and drug resistant tuberculosis (World bank, 2013). It is believed that overcrowding of the slums (UN-HABITAT, 2007c) favour the spread of diseases due to the limited space occupied by the slum, secondly poor living conditions also make slum dwellers more vulnerable to certain diseases. Agbola, (2009) use empirical data to suggest crime rates are higher in some slums than in non-slums, with slum homicides alone reducing life expectancy of a resident in a Brazil slum by 7 years than for a resident in nearby non-slum (United Nations Habitat, 2003). 3.0 Methodology The methodology of research is principally by acquisition of data, ground truthing and field validation, statistical approach and image classification. 3.1 Acquisition of Data NigeriaSAT-1 satellite imagery of 2011 and the rectangular grid coordinates (Easting (x) and Northing (y) of the selected slum locations and features in the study areas were acquired from National Space Research Development Agency (NASRDA), Housing population census (NPC, 2006) and land-use data acquired from Federal Capital Development Authority (FCDA) to assist in the identification and interpretation of features of the slum areas. 3.2 Ground truthing and field validation of Remote Sensing Data The training site for selected slum area was created based on the in-situ assessment of the site carried out during the fieldwork and ground truthing exercise. The result of the ground truthing was also used as training sites for supervised classification of the satellite images. Having demarcated the study area, the slum areas were identified on the scene. With the aid of On-Screen digitizing module of archmap 10.1, the boundaries were marked and stored as factor file. 3.3 Statistical Approach Kriging is an interpolator that can be exact or smoothed depending on the measurement error model. It is very flexible and allows you to investigate graphs of spatial auto- and cross-correlation. Kriging uses statistical models that allow a variety of output surfaces including predictions, prediction standard errors, probability and quantile. In this approach, the housing conditions of potential importance were statistically matched to building components of the slum, and provided a multivariate description to assess the accuracy of the classifications. 3.4 Image Classification Procedure (Raster) Having created the signature file, hence the data is ready for supervised classification however. Maximum likelihood classification (MLC) and Principal Component analysis (PCA) was carried out on the 2011 NigeriaSAT-1 imagery for the selected slum in the Federal Capital City (FCC), Abuja, Nigeria using the Image Classification module of Arcmap-10.1 GIS. Having used MLC and PCA, the two images were overlay against each other, further overrun PCA again to produce a clear understanding of city slum. 4.0 Results and Discussion 4.1 Water supply Figure 2 shows the main source of water supply to the slum dwellers that includes borehole, pipe water, open- well, covered well, stream and others. Foremost among them is open well with the highest of 35% in Jabi, Durumi 24% and Gishiri 23%, and stream water with the lowest occurrences of 0% in Garki-2 and Durumi respectively. The Figure 2 identified that overcrowding and poor quality of water is associated with slum area
- 4. Journal of Environment and Earth Science www.iiste.org ISSN 2224-3216 (Paper) ISSN 2225-0948 (Online) Vol.4, No.20, 2014 4 (Wohl, 1977; Kimani-Murage & Ngindu, 2007: United Nation, 2008)), whereby open-well water tends to serve dozens of families and household. It further shows that stream water is not readily available in two of the slum area investigated; Garki-2 and Durumi. Figure 2. The distribution pattern of available water source in the Study Area Figure 3 show very low relationships of the observed water variables in the slum areas, of which, the coefficients of determination r2 for the source of water are 0.0341 (3%) in Garki-2, 0.1714 (17%) in Durumi, 0.0001 (0%) in Jabi and 0.008 (0%) in Gishiri. These results indicate that the sources of water supply did correlate with the state of slum in the study area and shows a high strength in the relationship between the major source of water (open well) and slum areas. Figure 3. The Slum’s relationship with sources of water 4.2 Solid and Liquid waste disposal systems Figure 4 shows the two major waste disposal system in the study area, with the highest and lowest disposal system of 18 in Gishiri and 11 in Garki-2 respectively resulting from illegal waste collection points, and the approved waste collection points recording 2 in Durumi and 1 in Jabi as the highest and lowest respectively. The results also agrees with those of United Nations Habitat (2011) and Cristina (2009), that emphasize the lack of services such as routine garbage collection may allow rubbish to accumulate in huge quantities. The Figure 4 also shows that the prominent way of disposing of rubbish and waste is by duping it anywhere as long as the available landcover is not being used. It is clear that slums are vulnerable to extensive huge rubbish/waste.
- 5. Journal of Environment and Earth Science www.iiste.org ISSN 2224-3216 (Paper) ISSN 2225-0948 (Online) Vol.4, No.20, 2014 5 Figure 4. The distribution of waste collection patterns in the Study Area Figure 5 show some level of relationship of the observed disposal variables. The coefficients of determination r2 for the illegal waste collection points are 0.6748 (67%) and approved waste collection points is 0.0667 (7%). These results indicate that the waste collection or disposal points highly correlate with the state of slums therefore, test of goodness of fit on the regression analysis conducted shows a high strength in the relationship between the illegal waste disposal collection points and slum areas. Figure 5. The Slum’s relationship with waste disposal system 4.3 Wall to the building Figure 6 shows types of wall materials used to produce the building structure in the study area that consist of sandcrete block, mud/clay, used woods, paper cardboard, used leather and used clothes, with the highest of 88 occurrences made of mud/clay at Durumi and the lowest of 2 in Garki-2 and Durumi made of used clothes and paper cardboard respectively. According to Ratcliff (1945) and Kristof (1965) slum areas are characterized by substandard housing structures with materials unsuitable for housing. It was noted during field verifications exercises that, few of the slum dwellers uses brick and cement, but without attention to proper design and structural engineering requirements.
- 6. Journal of Environment and Earth Science www.iiste.org ISSN 2224-3216 (Paper) ISSN 2225-0948 (Online) Vol.4, No.20, 2014 6 Figure 6. The distribution pattern of wall material used in the Study Area Figure 7 show positive relationship of the observed wall variables in the slum areas, and further indicate the coefficients of determination r2 for the type of wall materials as 0.7614 (76%) Garki-2, 0.8997 Durumi (90%). 0.5575 (56%) and 0.8188 (82%) Gishiri . These results indicate that the wall materials correlate with the state and conditions of the study area and shows a high strength in the relationship between the mud/clay material and slum areas. Figure 7. The Slum’s relationship with the type of wall material 4.4 Roof to the Building Figure 8 shows the type of roof material use in the study area, with the highest of 44 at Jabi made of used-zinc and the lowest of 0 cases in Durumi and Garki-2 respectively resulting from the use of grasses. The Figure 8 also identify five major type of material used for producing roof and roof trusses in the study area, particularly, used aluminium, used-zinc, leather/plastics and grasses. According Mandelker (1969), slums areas are vulnerable to grasses, used zinc, torn metal pieces and plastic/woods held together by ropes as roofing material.
- 7. Journal of Environment and Earth Science www.iiste.org ISSN 2224-3216 (Paper) ISSN 2225-0948 (Online) Vol.4, No.20, 2014 7 Figure 8. The distribution of type of roof used in the Study Area Figure 9 show relationship of the observed roof variables. The coefficients of determination r2 for the type of roof are 0.0398 (4%), 0.2546 (25%), 0.9397 (94%) and 0.0667 (1%). These results indicate that the type of roof did correlate with the state of slum in the study area. Likewise, the test of goodness of fit on the regression line conducted shows a high strength in the relationship between the used zinc and slum areas. Figure 9. The Slum’s relationship with the roofing materials 4.5 Toilet wall to the Building Figure 10 shows five types of wall materials used to produce the toilet structure that includes sandcrete blocks, mud/clay, used zinc/ paper cardboard, used woods, used leather and used clothes in the study area, with the highest of 47 cases at Durumi made of mud/clay, and the lowest of 7 cases in Garki-2 of paper cardboard/used zinc. According to United Nations Human Settlements Programme (2003), shanty homes are often built hurriedly, on ad hoc basis, with materials unsuitable for housing. Often the construction quality is inadequate to withstand heavy rains, high winds and other associated climate related problems.
- 8. Journal of Environment and Earth Science www.iiste.org ISSN 2224-3216 (Paper) ISSN 2225-0948 (Online) Vol.4, No.20, 2014 8 Figure 10. The distribution pattern of toilet wall used in the Study Area Figure 11 show relationship of the observed toilet wall materials of the slum areas, of which the coefficients of determination r2 for the type of wall are 0.3400 (34%) Garki-2, 0.8364 (84%) Durumi, 0.4053 (41%) Jabi and 0.5435 (54%) Gishiri. These results indicate that the type of toilet wall correlate with the condition of slum in the study area and shows a high strength in the relationship between the mud/clay and slum areas. Figure 11. The Slum’s relationship with the type of toilet wall 4.6 Kitchen wall to the Building Figure 12 shows type of wall material used for the production of kitchen structure spotted as follow: sandcrete, mud/clay, paper cardboard/used zinc, used woods, used leather and used clothes, with the highest of 25 cases in Durumi made of mud/clay, and the lower of 2 cases in Gishiri and Durumi respectively.
- 9. Journal of Environment and Earth Science www.iiste.org ISSN 2224-3216 (Paper) ISSN 2225-0948 (Online) Vol.4, No.20, 2014 9 Figure 12. The distribution pattern of kitchen wall in the Study Area Figure 13 show relationships of the observed kitchen wall materials and the coefficients of determination r2 for the type of wall as 0.655 (66%) in Garki-2, 0.6635 (66%) in Durumi, 0.6286 (63%) in Jabi and 0.4607 (46%) in Gishiri. These results indicate that the type of kitchen wall correlate with the characteristic of slum in the study area and also shows a high strength in the relationship between the mud/clay and slum areas. Figure 13. The Slum’s relationship with the type of kitchen wall 4.7 Door to the Building Figure 14 shows and identifies five major type of door material in use in the study area that includes; used metal plate, used woods, used zinc sheet, paper cardboard, new improved door and leather/clothes, with the highest of 28 at Gishiri made of used-metal plate and the lowest of 3 made of paper cardboard in Garki-2. Figure 14. The distribution pattern of door type in the Study Area
- 10. Journal of Environment and Earth Science www.iiste.org ISSN 2224-3216 (Paper) ISSN 2225-0948 (Online) Vol.4, No.20, 2014 10 Figure 15 show relationship of the observed door materials of the study areas, of which the coefficients of determination r2 for the type of door material are 0.4751 (Garki-2), 0.0988 (Durumi), 0.0022 (Jabi) and 0.7605 (Gishiri). Reliably, this result confirms that the type of door material particularly used-metal plate did correlate with the state of slum in the study area and shows a high strength in their relationship. Figure 15. The Slum’s relationship with the type of door 4.8 Window to the Building Figure 16 shows the types of window material used in the study area that includes metal/steel, louvers, aluminium used woods, paper cardboard/used zinc, used leather and used clothes, with the highest of 48 cases at Durumi made of used-wood as window, and the lowest of 2 cases at Gaarki-2 of paper cardboard/usedzinc. It is pertinent to note that, the slum investigated has earlier been destroyed and residents were not evicted, then they return to rebuild their houses with the same destroyed material (Desai, 2003) and other substandard building materials. Figure 16. The distribution pattern of window type in the Study Area Figure 17 show relationship of the observed window variables of the slum areas, with the coefficients of determination r2 for the type of window material as 0.1555 (76%) Garki-2, 0.8222 (82%) Durumi, 0.5634 (56%) Jabi and 0.1618 (16%) Gishiri. These results indicate that the type of window material correlate with the state of slum in the study area and more importantly shows a high strength in the relationship between the used-wood and slum areas.
- 11. Journal of Environment and Earth Science www.iiste.org ISSN 2224-3216 (Paper) ISSN 2225-0948 (Online) Vol.4, No.20, 2014 11 Figure 17. The Slum’s relationship with the type of window material 4.9 Accessibility Figure 18 shows types of access in the study area, that consist of; motorable, tarred and drains; motorable and tarred; motorable and graded; local-surfacing for easy access and footpath, with the highest of 48 cases designated to motorable but graded, and the lowest of 5 cases made of motorable, tarred and provided with drainages. According to Hamza and Zetter (1998), slum area are associated with streets of too narrow to allow proper and quick access to fire control trucks which is consistent with the study area. Figure 18. Pattern distribution pattern of accessibility type in the Study Area Figure 19 show positive but low relationship of the observed accessibility variables of which the coefficients of determination r2 for the most available type of access are estimated as follow: Garki-2 recording 0.3766 (38%), Durumi 0.4367 (44%), Jabi 0.2088 (21%) and Gishiri 0.2446 (24%). These results indicate that the state of accessibility did correlate with slum formation in the study area and shows a low strength in the relationship between the type of access in Garki-2 (35), Durumi (32), Jabi (30) and Gishiri (25).
- 12. Journal of Environment and Earth Science www.iiste.org ISSN 2224-3216 (Paper) ISSN 2225-0948 (Online) Vol.4, No.20, 2014 12 Figure 19. The Slum’s relationship with the type of accessibility Figures 20, 21, 22 and 23 shows the classified satellite images of Garki-2, Durumi, Jabi and Gishiri respectively using MLC displayed in the qualitative color palette and the generated map of the slum areas using geospatial tools. The Figures 20-23 also indicates that, the observed variance in colour cluster together, shows that the study area has a predominantly cluster of features, points and objects, of which it demonstrates a better way of differentiating or discriminating slum from non-slum area. However, it clearly separate the slum built-up from the urban built-up with appreciable variance in colour cluster together. Furthermore, Figures 20-23 shows the cluster nature of the slum built-up area with corresponding appearance of variance in colour density, thereby creating a model for identifying the slum area. Figure 20. The 2011 classified satellite imagery and the generated map of Garki-2 using MLC Figure 21. The 2011 classified satellite imagery and the generated map of Durumi using MLC
- 13. Journal of Environment and Earth Science www.iiste.org ISSN 2224-3216 (Paper) ISSN 2225-0948 (Online) Vol.4, No.20, 2014 13 Figure 22. 2011 classified satellite image and the generated map of Gishiri using MLC Figure 23. The 2011 classified satellite image and the generated map of Jabi using MLC 4.10 Discussion and Analysis of Results A close examination of the classified housing conditions (Figures 2, 4, 6, 8, 10,12,14,16 and 18) of the study area produced the best result to be used to assessing and identifying slum within an urban city. However, a classification scheme is developed for assessing conditions of housing facilities in relation to the observed state of slums which could further assist to identifying slum’s ecology. However, the result of correlation analysis conducted explains that observed housing conditions has relationship with applicable slum index; water 0.93%, solid and liquid waste 1.0%, wall to the building 0.6719, roof 0.8229, toilet wall 0.9522, kitchen wall 0.9348, door 0.6586, window 0.7444 and accessibility 0.9441 (Figures 3,5,7,9,11,13,15,17 and 19). The classified satellite imagery (Figures 20 to 23) in relation to the field verification of the slum identification put MLC as the most approximate representation for identifying slum and its various sizes. Furthermore, the MLC has more of best and better result when use to classify and estimate variance of slum built-up. Overall 100% of the conditions of housing facilities sampled confirmed that they are living with defects (Table 1). The classification of the accuracy of housing conditions shows a total of 36 samples were recorded for Garki-2, Durumi, Jabi and Gishiri slum areas that is reported to have 19.44% facilities in decay, 41.67% facilities deteriorating and 38.89% of low quality (Table 1). Based on the adequate prior knowledge of the slums, Federal Capital City (FCC), Abuja, table 1 shows best and the most approximate representation of the areas, hence used as the reference in assessing the conditions of housing, further indicates the most affected: Jabi, Gishiri and Durumi.
- 14. Journal of Environment and Earth Science www.iiste.org ISSN 2224-3216 (Paper) ISSN 2225-0948 (Online) Vol.4, No.20, 2014 14 Table 1. The Summary of the classifications accuracy of housing conditions Note: Decay (0-5%), Deteriorating (6-18%), Low quality (19-39%), Quality (40-59%) and High quality (60- 100%) 5.0 Conclusion The distribution of slums within the Federal Capital City (FCC) varies in land-use types, poor quality water, illegal waste disposal collection points, lacks access, substandard wall, low quality doors and windows of which, it is easier to distinguish the slum-areas and non-slum areas. In Garki-2 and Durumi in particular, slum dwellers are usually in city neighborhoods, while in Jabi and Kpana, they are more common on the urban outskirts. The FCC slums are not just marginalized neighborhoods holding a small population, but slums are widespread, and are home to a large part of urban population. More importantly, the study has shown that a detail classification of the component of houses and its associated conditions, statistical approach, supervised classification tools could produce best result for urban slum identification and verification. One of the identifying characteristics of all the slums in the study area is the lack of inadequate safe drinking water, electricity, basic health care, fire/ambulance services, sanitation and paved roads. Again, the wide-spread and intensive distribution of slum in the Federal Capital City, Abuja is mainly due to informal land tenure, poverty, deficiency of practical housing policy, lack of affordable low cost housing, poor planning and the inability of governments to meet their needs force the dweller to rely on their own. References Agbola, T. (2009), "Urbanization, Slum Development and Security of Tenure-The Challenges of Meeting Millennium Development Goal 7 in Metropolitan Lagos, Nigeria.". Urban Population Development– Environment Dynamics in the Developing World- Case Studies and Lessons Learned, 77–106. Bhattacharya, S.K., Sur, D., Dutta, S., Kanungo, S., Ochiai, R.L., Kim, D.R. & Deen, J. (2013), “ Vivax malaria and bacteraemia: a prospective study in Kolkata, India” . Malaria journal 12(1), 176-178 Burns, P.A. & Snow, R.C. (2012), “ The built environment & impact of neighborhood characteristics on youth sexual risk behavior in Cape Town, South Africa” . Health & Place 18(5), 1088-1100 Corner, R.J., Dewan, A.M. & Hashizume, M. (2013), “ Modelling typhoid risk in Dhaka Metropolitan Area of Bangladesh: the role of socio-economic and environmental factors” . International journal of health geographics 12(1), 13. Cristina, I. (2009), “ Slums in Romania” , TERUM 10(1), 101-113 Desai, V.K. (2003), "Study of measles incidence and vaccination coverage in slums of Surat city". Indian Journal of Community Medicine 28 (1). Giok, O. & Kai P. (2007), “ Urbanization and Slum Formation” , Journal of Urban Health 1, 27–34 Gulyani, S., Talukdar, D. & Jack, D. (2010), “ Poverty, living conditions, and infrastructure access: a comparison of slums in Dakar, Johannesburg, and Nairobi” . World Bank Policy Research Working Paper No. 5388 Hammel, E.A. (1964), "Some characteristics of rural village and urban slum populations on the coast of Peru".
- 15. Journal of Environment and Earth Science www.iiste.org ISSN 2224-3216 (Paper) ISSN 2225-0948 (Online) Vol.4, No.20, 2014 15 Southwestern Journal of Anthropology, 346–358. Hamza, M. & Zetter, R. (1998), “ Structural adjustment, urban systems, and disaster vulnerability in developing countries” . Cities 15(4), 291-299 Kimani-Murage, E.W. & Ngindu, A. M. (2007), “ Quality of water the slum dwellers use: the case of a Kenyan slum” . Journal of Urban Health 84(6), 829-838 Kristof, F.S. (1965), “Housing policy goals and the turnover of housing”. Journal of the American institute of planners 31(3), 232-245 Mandelker, D.R. (1969), “ Housing Codes, Building Demolition, and Just Compensation: A Rationale for the Exercise of Public Powers Over Slum Housing” . Michigan Law Review 67(4), 635-678 OECD (2011), “Housing Conditions”, in How’s life: Measuring Well-being, OECD Publishing Paris, 1, 12. Patton, C. (1988), “ Spontaneous shelter: International perspectives and prospects” , Philadelphia: Temple University Press Ratcliff, R.U. (1945), “ Filtering down and the Elimination of Substandard Housing” . The Journal of Land & Public Utility Economics 21(4), 322-330 United Nations (2008), “ Integrated Water Sanitation and Waste Management in Kibera” United Nations Habitat (2011). “ Kenya Slum Upgrading Project” UN Habitat (2007a), “ The state of world’s cities” UN-HABITAT (2007b), Press Release on its report, "The Challenge of Slums: Global Report on Human Settlements 2003". United Nations Habitat (2007c), “ Slums: Past, Present and Future” United Nations Habitat (2003), “ The challenge of slums - Global report on Human Settlements” United Nations Habitat Group (2011), “ Assessing Slums in the Development Context” United Nations Human Settlements Programme (2003), “ The Challenge of Slums: Global Report on Human Settlements” UNHABITAT (2013), "State of the World's Cities Report 2012/2013: Prosperity of Cities". World Bank (2008), “ Urban Poverty - An Overview Judy Baker” Wohl, A. S. (1977), “ The Eternal Slum: Housing and Social Policy in Victorian” Transaction Books. (Vol. 5). World Bank (2013), “ India” : Battling TB in India’s slums Acknowledgement My special thanks and appreciation goes to Mrs. Hauwa Badaru and colleagues for making the data used in this study available to me at the right time. I also appreciate the Remote Sensing Laboratory, Department of Geography, Federal University of Technology, Minna, Nigeria, where the preliminary data enhancement and processing was carried out. Thanks to Mallam Salihu, Department of Geography, Minna for supporting me with map of the study areas and Arcmap-10.1 Software. I remain grateful to Federal Capital Development Authority (FCDA) for permitting me ground truth the study area and acquire data, their assistance and commitment towards the success of the Journal.
- 16. Business, Economics, Finance and Management Journals PAPER SUBMISSION EMAIL European Journal of Business and Management EJBM@iiste.org Research Journal of Finance and Accounting RJFA@iiste.org Journal of Economics and Sustainable Development JESD@iiste.org Information and Knowledge Management IKM@iiste.org Journal of Developing Country Studies DCS@iiste.org Industrial Engineering Letters IEL@iiste.org Physical Sciences, Mathematics and Chemistry Journals PAPER SUBMISSION EMAIL Journal of Natural Sciences Research JNSR@iiste.org Journal of Chemistry and Materials Research CMR@iiste.org Journal of Mathematical Theory and Modeling MTM@iiste.org Advances in Physics Theories and Applications APTA@iiste.org Chemical and Process Engineering Research CPER@iiste.org Engineering, Technology and Systems Journals PAPER SUBMISSION EMAIL Computer Engineering and Intelligent Systems CEIS@iiste.org Innovative Systems Design and Engineering ISDE@iiste.org Journal of Energy Technologies and Policy JETP@iiste.org Information and Knowledge Management IKM@iiste.org Journal of Control Theory and Informatics CTI@iiste.org Journal of Information Engineering and Applications JIEA@iiste.org Industrial Engineering Letters IEL@iiste.org Journal of Network and Complex Systems NCS@iiste.org Environment, Civil, Materials Sciences Journals PAPER SUBMISSION EMAIL Journal of Environment and Earth Science JEES@iiste.org Journal of Civil and Environmental Research CER@iiste.org Journal of Natural Sciences Research JNSR@iiste.org Life Science, Food and Medical Sciences PAPER SUBMISSION EMAIL Advances in Life Science and Technology ALST@iiste.org Journal of Natural Sciences Research JNSR@iiste.org Journal of Biology, Agriculture and Healthcare JBAH@iiste.org Journal of Food Science and Quality Management FSQM@iiste.org Journal of Chemistry and Materials Research CMR@iiste.org Education, and other Social Sciences PAPER SUBMISSION EMAIL Journal of Education and Practice JEP@iiste.org Journal of Law, Policy and Globalization JLPG@iiste.org Journal of New Media and Mass Communication NMMC@iiste.org Journal of Energy Technologies and Policy JETP@iiste.org Historical Research Letter HRL@iiste.org Public Policy and Administration Research PPAR@iiste.org International Affairs and Global Strategy IAGS@iiste.org Research on Humanities and Social Sciences RHSS@iiste.org Journal of Developing Country Studies DCS@iiste.org Journal of Arts and Design Studies ADS@iiste.org
- 17. The IISTE is a pioneer in the Open-Access hosting service and academic event management. The aim of the firm is Accelerating Global Knowledge Sharing. More information about the firm can be found on the homepage: http://www.iiste.org CALL FOR JOURNAL PAPERS There are more than 30 peer-reviewed academic journals hosted under the hosting platform. Prospective authors of journals can find the submission instruction on the following page: http://www.iiste.org/journals/ All the journals articles are available online to the readers all over the world without financial, legal, or technical barriers other than those inseparable from gaining access to the internet itself. Paper version of the journals is also available upon request of readers and authors. MORE RESOURCES Book publication information: http://www.iiste.org/book/ IISTE Knowledge Sharing Partners EBSCO, Index Copernicus, Ulrich's Periodicals Directory, JournalTOCS, PKP Open Archives Harvester, Bielefeld Academic Search Engine, Elektronische Zeitschriftenbibliothek EZB, Open J-Gate, OCLC WorldCat, Universe Digtial Library , NewJour, Google Scholar