SlideShare a Scribd company logo
1 of 3
Download to read offline
ʀᴀsʜɪᴅ_ᴠᴇɴɢᴀʀᴀ | ʀᴀsʜɪᴅ_ᴠᴇɴɢᴀʀᴀ | ʀᴀsʜɪᴅ_ᴠᴇɴɢᴀʀᴀ | ʀᴀsʜɪᴅ_ᴠᴇɴɢᴀʀᴀ | ʀᴀsʜɪᴅ_ᴠᴇɴɢᴀʀᴀ | ʀᴀsʜɪᴅ_ᴠᴇɴɢᴀʀᴀ | ʀᴀsʜɪᴅ_ᴠᴇɴɢᴀʀᴀ
ʀᴀsʜɪᴅ_ᴠᴇɴɢᴀʀᴀ | ʀᴀsʜɪᴅ_ᴠᴇɴɢᴀʀᴀ | ʀᴀsʜɪᴅ_ᴠᴇɴɢᴀʀᴀ | ʀᴀsʜɪᴅ_ᴠᴇɴɢᴀʀᴀ | ʀᴀsʜɪᴅ_ᴠᴇɴɢᴀʀᴀ | ʀᴀsʜɪᴅ_ᴠᴇɴɢᴀʀᴀ
MODULE I
Research
Research simply refers to in-depth study about a
particular topic by using scientific methods.
Business research
It refers to systematic collection and analysis of
data with the purpose of finding answers to the
problem faced by the management.
Features of business research
1. It is systematic and objective. 2. It has a clear
objective. 3. It is multidisciplinary. 4. It determine
profitability of the business. 5. It is flexible in nature.
6. It is most often demand driven.
Importance/Significance/Benefits of business
research
1. Information for economic planning 2. It helps to
solve operational and planning problems. 3. It helps
in business decision making. 4. It helps in demand
forecasting. 5. It helps in formulating government
policies. 6. It helps in decision making of large
business. 7. It helps in SWOT analysis. 8. It helps in
growth and expansion of business.
Types of research
1. Basic research
Basic research is a type of research which is
undertaken out of intellectual curiosity or
inquisitiveness. It is also known as pure research,
fundamental research.
Features of basic research
1. It is related with principles, laws or rules.
2. The aim is to attainment of knowledge and truth.
3. It try to find out cause and effect relationship of a
social phenomenon. 4. It is problem oriented. 5. It is
original type of research.
2. Applied research
It refers to scientific study and research that help to
solve practical problems.
Features of applied research
1. It find out solution to a real life problem. 2. It is
based on pure research 3.Its problem/goal oriented
4.It integrate previously existing knowledge 5. It
seeks solution to immediate problems.
3. Exploratory research
Its a research used to investigate a problem which is
not clearly defined.its also called formative research
Objectives/Features of exploratory research
1. To generate new ideas. 2. To make an exact
formulation of the problem. 3. To clarify concepts. 4.
To determine the feasibility of the study. 5. To
increase researchers familiarity with problem.
Exploratory research methods
• Experience survey • Secondary data analysis
• Case study • Pilot study • Focus group
4. Descriptive research
It refers to the methods that describes the
characteristics of the variable under study. It is also
known as statistical research.
5. Experimental research
It is a scientific investigation conducted by using two
sets of variables.Its also called casual research
6. Diagnostic research
It is a type of research conducted to identify the
cause of a problem.
Steps in research process/Phases of research
1.Tentative selection of the topic 2.Initial survey of
literature 3.Finalization of research problem
4.Formulation of the problem 5.Extensive literature
survey 6.Formulation of hypothesis 7.Preparation of
research design 8.Preparation of sample design
9.Collection of data and execution of project
10.Analysis of data 11.Testing of hypothesis
12.Generalization and interpretation 13.Preparation
of research report
Research problem
It refers to some kind of problem which a researcher
experiences in the context of theoretical or practical
situations.
Criteria for good research problem
1. It should be original. 2. It should be solvable. 3. It
should be feasible 4. It should be innovative. 5. It
should be cost effective. 6. It should be interesting.
Proposition
It is a declarative statement that is either true or
false but not both.
Difference between pure research and applied
research
Pure research Applied research
It is original type of
research
It is based on pure
research
It is knowledge
oriented
It is problem or goal
oriented
Theoretical and
exploratory in nature
Practical and
descriptive in nature
Reports are in
common language
Reports are in
technical language
Hypothesis
It is the tentative assumption of the
relationship between two or more variables.
Characteristics of a good hypothesis
1. It should be related to a body of theory. 2.
It should be clear and precise. 3. It should be
capable of verification 4. It should be simple
& specific 5.It shouldbe capable of being
tested
Types of hypothesis
• Descriptive hypothesis :- It describe the
characteristics of a variable.
• Relational hypothesis :- It establishes the
relationship between two or more variables.
• Statistical hypothesis :- Association of two
or more variables are hypothesed
• Null hypothesis :- is a hypothesis, which
point out there is no differences between two
populations in respect of same property.
• Alternative hypothesis :- When we reject the
null hypothesis, we can accept another
hypothesis is called alternative hypothesis.
Non directional hypothesis
It is a type of alternative hypothesis used in
statistical significance testing.
Case study
It is an in-depth comprehensive study of a
person, a process, situation or any other
social units.
Pilot study
It is a small scale preliminary investigation to
determine the feasibility of a larger study.
Variables
Variables are concepts that are measured,
manipulated or controlled in a study.
Classifications of variables
1. Dependent variables :- A variable whose
value depends on the value of another
variable or variables is known as dependent
variable.
2. Independent variable :- A variable whose
value does not depend on the value of
another variable or variables is known as
..........
3. Moderating variable :- It is a variable, the
presence of which, modifies the original
relationship between the independent and
dependent variable.
4. Intervening variable :- It is a hypothetical
variable used to explain casual links between
other variables.
5. Extraneous variable :- Extraneous variables
are undesirable variables that influences the
relationship between variables an
experimenter is examining.
Theory
It is a set of logically interrelated statements
in the form of empirical assertions about
properties of infinite class of events.
Requisites/ criteria of theory
1. They must be logically consistent. 2. They
must be interrelated. 3. The statement must
be exhaustive. 4. The proposition should be
mutually exclusive. 5. They must be capable
of being tested.
Induction
It is a process of reasoning from a part to the
whole, from particular to general or from
individual to universe.
Deduction
Its a process of drawing generalization
through inference from the general to
particular
Difference between induction and deduction
Induction Deduction
General to
particular
approach
Particular to
general approach
Method of
verification
Method of
discover
Very quick
method
Very slow method
Downward
movement
Upward
movement
MODULE II
Research Design
It is the planned sequence of the entire process
involved in conducting a research study
Features of research design
1. The means of obtaining information. 2. It is an
activity and time based plan. 3. It is a plan based
on the research question. 4. It comprises the
time and cost budget. 5. It is depend upon the
purpose of research. 6. It is a guide for selecting
sources and types of information needed.
Stages of Research Design
1. Selection of a problem. 2. Review of existing
literature. 3. Sources of the information to be
utilized. 4. Nature of study. 5. Objectives of
study. 6. Geographical area to be covered.
7. Socio cultural context of the study. 8. Period
of study. 9. Dimension of study. 10. Basis for
selecting the data. 11. Technique of study.
12. The control of error.
Merits of research design
1. It helps to save time, money and energy of
researcher. 2. It helps the researcher to
document the research activities. 3. It ensure
proper time schedule for the implementation of
the project 4.it provide confident to the researcher
for completing research work. 5. It provide sense
of success at every stage of work.
Types of research design
1. Exploratory research design 2. Descriptive
research design 3. Causal research design
4. Experimental design
Exploratory research design
Exploratory research design are thosde design
which is conducted to clarify ambiguous
situations or discover ideas that maybe potential
business opportunities.
Features of exploratory research design
1.Its a preliminary study of an unfamiliar problem
2. It is flexible and very versatile 3. Cost for
conducting the study is less. 4. It does not make
use of any earlier theoretical model. 5. It used to
finalize questionnaire.
Exploratory research design methods
1. Experience surveys
It means researcher interact with a person who
have experience in the subject.
2. Secondary data analysis
Secondary data are those data which have
already been collected, tabulated and presented
by someone for some other purposes.
3. Case analysis
4. Piolet study
Descriptive research design
Descriptive research design are those design
which is designed to gain more information
about characteristics of individuals, groups or
situations.
Casual research design
Casual research design seeks to find cause and
effect relationship between variables.
Experimental research design
It is are those design which study the casual
inferences about the relationship between the
independent and dependent variable.
Measurement
It is a systematic way of assigning numbers or
names to objects and their attributes.
Scaling
It is a device used for measuring various things.
It is the procedure for determining the
quantitative measure of abstract concept.
Types of measurement scales
1. Nominal scale :- It simply refers to assigning
numbers or categories to events in order to label
them.
2. Ordinal scale :- It is a measurement scale,
used for variables in ranked order.
3. Interval scale :- These are numerical scale in
which it allow not only the order but also the
exact difference between the values.
4. Ratio scale :- It is the highest measurement
scale. It is possess the characteristics of
nominal, ordinal and interval scale.
Sources of errors in measurement
•Respondent reluctance • Situational factors
•Fault with interviewer • Defective measurements
Features of a good measurement
•Validity • Measurability • Reliability
•Unidimensionality • Practicability • Accuracy
Criteria for the good measurement/ Essentials
of the measurement scale
• Test of validity • Test of practicability • Test of
reliability
Approaches related with construction of scale
1. Arbitrary approach 2. Consensus approach 3.
Item analysis approach 4. Cumulative scale
approaches 5. Factor analysis approach
Likert scale
Rensis Likert developed a summated rating scale
based on item analysis. It is extremely popular
for measuring attitudes.
Steps in construction of Likert scale
1. Collection of statements 2. wording 3. Pilot
study 4. Scrutiny and editing 5. Final selection
Merits of Likert scale
1. It is relatively easy to construct. 2. It is
considered more reliable 3. Less time is required
to construct scale. 4. It is easy to understand.
5. Easy to use.
Validity:- Validity refers to accuracy of a measure
Reliability Reliability refers to consistency of a
measure
MODULE III
Data
Data are facts and statistics collected together
for reference or analysis.
Collection of data
The process of gathering information or data is
called data collection.
Classification of data / Sources of data
Primary data Secondary data
Primary data are
those data which
are collected for
the first time and
these are original
in character
Secondary data are
those data which
have beencollected
by some other
person for his
purpose&published
Merits of primary data
1. Original in character 2. Greater control 3. Data
are current. 4. Secrecy can be maintained. 5.
Better data interpretation 6. Relevant data.
Demerits of primary data
1. High cost. 2.Time consuming. 3.Feedback.
4.High cost of labor.
Merits of secondary data
1. Ease of access. 2. Low cost. 3. Time saving.
4. Variety of sources.
Demerits of secondary data
1. Outdated data. 2. Inaccurate. 3. Need not be
adequate.
Sources of Primary data
1. Observation. 2. Interview. 3. Questionnaire. 4.
Schedule. 5. Experimentation. 6. Simulation. 7.
Use of telephone. 8. Focus group. 9. Mail survey
Sources of Secondary data
1. Official reports of central, state and local
government. 2. Technical journal, newspapers,
books, periodicals etc. 3. Publications of
research organizations. 4. Internet.
Difference between primary and secondary data
Primary data Secondary data
Original in
character
Not original in
character
It is in the shape
of raw material
It is in the shape of
finished goods
It is adequate and
suitable
It is need not ample
& apposite
It is expensive. It is less expensive
It is time
consuming
It is less time
consuming.
It is collected
from real time
It is collected from
past
It has a specified
coverage
It has a wider
coverage
It require more
efforts
It require less effort
Observation
It is a classical method of scientific enquiry. It is
the active acquisition of the information from a
primary source.
Objectives/ features of observation
1. It is a physical and mental activity. 2. It is
purposive and not informal. 3. It is selective.
4. It should be exact. 5. It study collective
behavior and complex situations.
Interview
It is one of the powerful tool for collecting
primary data. It is a direct method of inquiry. In
interview there is a face to face communication.
Process of interview
1. Preparation 2. Introduction 3. Developing
rapport 4. Carrying the interview 5. Recording the
interview 6. Closing the interview
Types of interview
1. Personal interview 2. Group interview
3. Formal interview 4. Informal interview
5. Focused interview 6. Unstructured interview
7. Diagnostic interview 8. Treatment interview
ʀᴀsʜɪᴅ_ᴠᴇɴɢᴀʀᴀ | ʀᴀsʜɪᴅ_ᴠᴇɴɢᴀʀᴀ | ʀᴀsʜɪᴅ_ᴠᴇɴɢᴀʀᴀ | ʀᴀsʜɪᴅ_ᴠᴇɴɢᴀʀᴀ | ʀᴀsʜɪᴅ_ᴠᴇɴɢᴀʀᴀ | ʀᴀsʜɪᴅ_ᴠᴇɴɢᴀʀᴀ | ʀᴀsʜɪᴅ_ᴠᴇɴɢᴀʀᴀ
ʀᴀsʜɪᴅ_ᴠᴇɴɢᴀʀᴀ | ʀᴀsʜɪᴅ_ᴠᴇɴɢᴀʀᴀ | ʀᴀsʜɪᴅ_ᴠᴇɴɢᴀʀᴀ | ʀᴀsʜɪᴅ_ᴠᴇɴɢᴀʀᴀ | ʀᴀsʜɪᴅ_ᴠᴇɴɢᴀʀᴀ | ʀᴀsʜɪᴅ_ᴠᴇɴɢᴀʀᴀ
Questionnaire
It is a list of question send to a number of persons
for them to answer.
Questionnaire design process
1. Define the objective of the study. 2. Deciding on
the information required. 3. Determining the sample
group. 4. Choose method of reaching target group.
5. Writing the questionnaire. 6. Administrating the
questionnaire. 7. Piloting the questionnaire.
8. Development of the final questionnaire.
Guidelines for the preparation of questionnaire
1. It should be attractive. 2. Avoid long words.
3. Avoid ambiguous words. 4. Avoid biased
questions 5. Question should be limited to single
idea.
6. It should be designed in simple language.
Merits of questionnaire
1. It is economical. 2. Uniformity. 3. Free from bias.
4. Reliable results. 5. Respondent get enough time to
answer the questions.
Schedule
It is a set of questions which are asked and filled by
the interviewer in a face to face situation with
another person.
Difference between questionnaire and schedule
Questionnaire Schedule
Responses are filled
by respondents
Responses are filled
by enumerators
It is useful only to
literate
It is useful to both
literate and illiterate
people
No direct contact
with respondents
Direct contact with
respondents
It has large coverage It has less coverage
Questionnaires
response rate is low
Schedules response
rate is high
Sample
It is a small representation of a large unit.
Sampling
It is a process of selecting sample from the
population.
Sampling design
It is a definite plan for obtaining a sample from a
given population.
Steps in sampling design
1. Define population 2. State the sampling frame 3.
Identify the sample unit 4. State the sampling
method
5. Determine the sample size 6. Spell out the
sampling plan 7. Select the sample
Features of a good sample design
1. It must be a truly representative sample. 2. It
should not cause more errors. 3. It should be viable
on the basis of budget constraints. 4. It is able to
control systematic bias effectively.
Principles of Sampling
1. Principle of statistical regularity 2. Principle of
inertia of large numbers
Types of sampling design (Methods / Techniques
of sampling)
A. Probability sampling (Random sampling)
It is defined as the kind of sampling in which every
element in the population has an equal chance of
being selected.
Types of probability sampling
a. Simple random sampling :- Every member of the
population has the same probability of inclusion in
the sample.
b. Systematic sampling :- It is a statistical method
involving the selection of
elements from an ordered sampling frame.
c. Stratified sampling :- It is a sampling method in
which population is divided into homogeneous
groups and sample is randomly taken from the
group.
d. Cluster sampling :- It is a sampling method
wherein the members of the population are selected
at random from naturally occurring group called
cluster.
e. Multistage sampling :- It is a type of sampling and
draw a sample from population using smaller and
smaller groups at each stage.
f. Sequential sampling :- It is a sampling technique
which involves evaluation of each sample taken
from a population to see if it fits a desired
conclusion.
B. Non-Probability sampling
It is a sampling method in which not all members of
the population have an equal chance of participating
in the study.
.
Types of non-probability sampling
A. Convenience sampling :- It is a sampling
method in which it attempts to obtain
sample from convenient elements.
B. Purposive sampling :- It is a sampling
method in which researcher intentionally
select the sample based on some previous
knowledge about the population
C. Accidental sampling :-It is a nonprobability
sampling that involves the sample being
drawn from that part of the population that is
close to hand.
D. Quota sampling :- It is a sampling method
where in data is collected from a
homogenous group.
E. Snowball sampling :- It is a special non-
probability method used when the desired
sample characteristics is rare.
Sample size
It refers to number of participants or
observations include in a study.
Determinants of optimum sample size
1. Nature of population 2. Number of classes
proposed. 3. Nature of study. 4. Types of
sampling 5. Degree of accuracy 6. Availability
of finance.
Sampling error
The errors which arises due to the use of
sampling survey are known as sampling
errors.
Non-sampling errors
These are the errors which can impact the
final survey estimates caused by problems in
data collection, processing, etc.
MODULE IV
Data Processing
It is a process of classification and
summarization of data in order to make
ready for analysis.
Data processing stages
1. Editing 2. Coding 3. Classification
4. Tabulation
Editing
It is a process of examining the data
collected to detect the errors and omission
and correct to these as far as possible.
Coding
It is a process of reducing data in to small
number of classes.
Classification
It is a process of grouping of a related facts
on the basis of certain common
characteristics.
Types of classification
1. Qualitative classification :- Data are
classified on the basis of some quality such
as sex, literacy, religion etc.
2.Quantitative classification:-Classification of
data according to some characteristics that
can be measured such as height, weight, etc.
3. Geographical classification :- Data
classified on the basis of geographical area
or location.
4. Chronological classification :- Classified
on the basis of period of time.
5. Dichotomous classification :- Where only 2
classes are formed is called dichotomous
classification.
Tabulation
It is an orderly arrangement of raw in data in
columns and rows.
Features of tabulation
1. It helps to simplify complex data. 2. It
facilitates comparison. 3. It gives an identity
to data. 4. It helps to detect errors. 5. It helps
to find omissions.
Principles of tabulation
1. The table should be suit to the size of the
paper. 2. The table should have a clear title.
3. To avoid unnecessary details. 4. Do not
use ditto marks. 5. Table should be clear,
accurate and simple. 6. The unit of
measurement should be clearly defined.
Data entry
It is the process of computerizing the data.
Validity of data
It refers to how accurately a method
measures what it is intended to measure.
Uses of graphs and diagrams
1. It helps in presenting data in simple and
clear. 2. It makes the whole data readily
intelligible. 3. It is used for comparison. 4. It
save time in understanding data. 5. It is
useful in analyzing complect economic
situations. 6. It is understood without doing
mathematical calculations.
Types of chart
Charts or line graphs
It displays information in a series of data points
that each represents an individual measurement
or piece of data.
Bar charts
It is a common type of graphs which consists of
parallel bars or rectangles with lengths that are
equal to the quantities that are occur in a given
data set.
Histogram
It is a graph of frequency distributions. It is a set
of vertical bars whose are proportions to the
frequencies.
Frequency polygon
It is a graph of frequency distribution.
Frequency curve
A continuous frequency distribution can be
represented by a smooth curve is known as
frequency curve.
Ogive
Smoothed frequency curves drawn for the two
cumulative series are called ogive.
Pie diagram
It is a circle divided into sections which each
display the size of a relative piece of information.
Pictogram
Is an ideogram that conveys its meaning through
pictorial resemblance to a physical object
Analysis of data
It is a critical examination of data for studying
the characteristics of object under study.
Types of data analysis
Descriptive analysis
These are used to describe the basic features of
data in a study. It provides simple summary
about sample and measure.
Univariate analysis
It involves describing the distribution of a single
variable including its central tendency and
dispersion.
Bivariate analysis
It is one of the simplest form of quantitative
analysis. It involves the analysis of two variables
for the purpose of determining the empirical
relationship between them.
Multivariate analysis
In multivariate analysis, multiple relations
between multiple variables are examined
simultaneously.
Factor analysis
It is a technique that is used to reduce a large
number of variables into fewer number of factors
Inferential analysis
Its concerned with various tests of significance
for testing hypothesis in order to determine what
validity data canbe set to indicate some
conclusions
Types of measures of central tendency
1. Mean 2. Geometric mean 3. Harmonic mean
4. Median 5. Mode
Arithmetic mean (AM)
The most commonly used measures of central
tendency. Mean is the sum of the values divided
by the total number of items in the set.
Merits of AM
1. It is easy to calculate 2. It is simple to follow 3.
It is finite 4. It is based on the all observations. 5.
It is rigidly defined. 6. It is an algebraic
treatment.
Demerits of AM
1. It is highly affected by extreme values. 2. It
cannot be compute accurately. 3. It is not a
suitable average for highly skewed distributions.
4. It cannot average the ratios. 5.It cannot
average the percentage.
Geometric mean (GM)
Geometric mean is the nth positive root of the
product of 'n' positive given values.
Harmonic mean (HM)
Harmonic mean is the reciprocal of the
arithmetic mean of the reciprocal of the given
set of observations.
Median
Median is the most middle value in the arrayed
data.
Mode
Mode is the most frequently occurring value in
the data set.
Range
Range is defined as the difference between the
values of the extreme items of a series.
Mean deviation
Mean deviation is defined as the mean of the
absolute deviations of observations from some
suitable averages like mean median mode.
Tools and statistical measures for analysis
a. Descriptive statistics
1. Measures of central tendency 2. Measures of
dispersion. 3. Measures of correlation. 4.
Regression analysis. 5. Index numbers. 6. Time
series analysis.
1. Measures of central tendency
Average tends to indicating the center of the
distribution is called.......
2. Measures of dispersion
The degree to which numerical data tend to
spread about an average value is called
dispersion or variation.
3. Correlation
Correlation is a statistical technique which can
be used to study the relationship between two or
more variables.
4. Regression
It is the measure of the average relationship
between two or more variables in terms of
original units of the data.
5. Index numbers
Index number is a statistical device for
measuring the statistical changes in group of
related variables over a period.
6. Time Series
It refers to arrangement of data according to the
time of occurrence.
Standard deviation
The standard deviation is defined as the positive
square root of the mean of the square deviations
taken from arithmetic mean of the data.
Simple index numbers
Simple index numbers are those numbers in
which all items are treated as equally.
Weighted index numbers
Weighted index numbers are those numbers it is
based onthe weight of the selected commodities
Consumer price index number
It represents the average change in prices over a
period of time paid by the consumer for goods
and services.
Type I Error
It means rejection of hypothesis which should
have been accepted.
Type II Error
It means accepting the hypothesis which should
been rejected.
Parametric test
The statistical tests based on the assumption
that population or population parameter are
normally distributed is called parametric test.
Important parametric test
• Z-test • T-test • F-test
Non Parametric test
Non-parametric test are method of testing
hypothesis when the nature of the distribution
are unknown. It is also called distribution free
statistics.
Anova
It is a statistical technique that is used to
compare groups on possible differences in the
average of a quantitative measure.
Chi-square test
It is a statistical measure used in the context of
sampling analysis for comparing a variance to
theoretical variance.
Interpretation
It refers to technique of drawing inference from
collected data.
ʀᴀsʜɪᴅ_ᴠᴇɴɢᴀʀᴀ | ʀᴀsʜɪᴅ_ᴠᴇɴɢᴀʀᴀ | ʀᴀsʜɪᴅ_ᴠᴇɴɢᴀʀᴀ | ʀᴀsʜɪᴅ_ᴠᴇɴɢᴀʀᴀ | ʀᴀsʜɪᴅ_ᴠᴇɴɢᴀʀᴀ | ʀᴀsʜɪᴅ_ᴠᴇɴɢᴀʀᴀ | ʀᴀsʜɪᴅ_ᴠᴇɴɢᴀʀᴀ
ʀᴀsʜɪᴅ_ᴠᴇɴɢᴀʀᴀ | ʀᴀsʜɪᴅ_ᴠᴇɴɢᴀʀᴀ | ʀᴀsʜɪᴅ_ᴠᴇɴɢᴀʀᴀ | ʀᴀsʜɪᴅ_ᴠᴇɴɢᴀʀᴀ | ʀᴀsʜɪᴅ_ᴠᴇɴɢᴀʀᴀ | ʀᴀsʜɪᴅ_ᴠᴇɴɢᴀʀᴀ
MODULE V
Research report
A research report is a systematic, scientific and
consistent presentation of the entire process of
research.
Functions of research report
• It serve as a reference material for future.
• It reveals the research ability of the researcher.
• It is useful for policy makers and administrators
• Its used to judge the quality of the research
work • It is used to evaluate competency of the
researcher.
Features/ Characteristics/ Qualities/ Essentials
of a good report
• Clarity • Size • Validity • Orderliness • Simple
language • Attractive • Free from mistakes
• Interesting • Accurate • Use familiar words
Importance/ Significance/ Purpose of research
report
• It helps the researcher to evaluate the success
of report. • It reveals the ability of the researcher.
• It is useful to policy makers and administrators.
• It is guided by management decisions. • It is the
presentation of findings. • It examine the validity
of the generalizations. • It is the inspiration for
further research.
Types of Report
Oral Report
It is a type of report which is not in written
format. This is reporting verbally in person.
Written Report
It is a type of report which is in written format
describing the finding of the report.
Popular report
It is a type of report meant for general public. It
is prepared in simple language.
Technical report
It is a report prepared for specialists who are
interested in understanding the technical
aspects of research methodology.
Report submitted to administrator
It is intended for taking decisions. It includes
some technical data and supporting data.
Stages/ Steps/ Procedure of report writing
• Understanding the subject matter & its logical
analysis • Preparing the final outline of the report
• Preparing the rough draft or first draft
•Finalizing the report
Comprehension
It is the ability to understand and get meaning
from spoken and written languages. It measure
whether a user can understand the intend
meaning of a text and can draw the correct
conclusion
Readability
It is the ease with which a reader can understand
a written text. It
depend on its content and presentations.
Tone
It is the writers voice in written work. It is what
the reader might
perceive the writers attitude.
Title of the report
The title of the report summarizes main idea of
the study. A good title contains fewest possible
words and adequately describe the purpose of
the research.
Bibliography
A bibliography is a detailed list of all the sources
consulted and cited in a research paper & project
Types/ Kinds of bibliography
• Working bibliography :-Its a type of bibliography
formed at the starting stage of the enquiry. It
maybe prepared before the selection of research
problem. It helps the researcher to understand
the problem.
• Final bibliography :-It is a type of bibliography
after the completion of research report. It helps
to verify the facts and statements in the report. It
helps the researcher who are interested tofurther
study of the problem.
Role of audience
The audience of the research includes experts,
technician, executives, non-specialists, etc.
Executive summary
It is a thorough overview of a research report.
Need for executive summary in research report
• Objectives of the research report • Nature of the
decision problem • Key results • Conclusion
• Recommendation for action
Abstract
An abstract is a summary of the research report. It
describe the topic, the scope, the principal findings and
the conclusions.
Glossary
A glossary is a short dictionary giving definitions and
examples
Footnote
An additional piece of information printed at the bottom of
a page is called foot note.
Ethics in research
Ethics in research means the application of fundamental
ethical principles to research activities. It involves
requirements on daily work,
the protection of dignity of subjects and population of the
information in research.
Ethical principles followed by a researcher
• Honesty • Objectivity • Confidentiality
• Carefulness • Integrity • Openness • Social responsibility
• Legality • Competence
Difference between objectivity and subjectivity in
research
Objectivity Subjectivity
It is personal
impartiality
It is judgement
based on individual
It is based on facts It can vary from
person to person
It cannot be
influenced
personal values
and biases
It can be influenced
It canbe
interpreted as
mind-independent
It consists of
statements of
judgement,
assumption etc
It cannot be altered
based on personal
opinion
It can be altered
Used in decision
making process
May or may not use
in decision making
Format / Layout / Content of a research report
The Preliminaries The Text
The Preliminaries The Text The
Reference
material
Title Page Abstract Bibliography
Letter of
transmittal
Introduction Appendix
Acknowledgment Research
procedure
Index (if
any)
Letter of
authentication
Results
Table of contents Discussions
List of tables Conclusion
List of figures summary

More Related Content

Similar to BRM BCOM (2).pdf

research design (B.COM).pptx
research design (B.COM).pptxresearch design (B.COM).pptx
research design (B.COM).pptxSINUSARJA
 
research design (B.COM).pptx
research design (B.COM).pptxresearch design (B.COM).pptx
research design (B.COM).pptxSINUSARJA
 
Research/thesis for post graduate students in dentistry.
Research/thesis for post graduate students in dentistry.Research/thesis for post graduate students in dentistry.
Research/thesis for post graduate students in dentistry.Shivangi Shreya
 
Solving research problem_3539ce35db1215c11a780b1712d47e46
Solving research problem_3539ce35db1215c11a780b1712d47e46Solving research problem_3539ce35db1215c11a780b1712d47e46
Solving research problem_3539ce35db1215c11a780b1712d47e46Kæsy Chaudhari
 
research approach and design
research approach and designresearch approach and design
research approach and designSaima Habeeb
 
FundamentalsofResearchMethodologyandDataCollection.pdf
FundamentalsofResearchMethodologyandDataCollection.pdfFundamentalsofResearchMethodologyandDataCollection.pdf
FundamentalsofResearchMethodologyandDataCollection.pdfMishraNiranjan
 
FundamentalsofResearchMethodologyandDataCollection (1).pdf
FundamentalsofResearchMethodologyandDataCollection (1).pdfFundamentalsofResearchMethodologyandDataCollection (1).pdf
FundamentalsofResearchMethodologyandDataCollection (1).pdfMishraNiranjan
 
Introduction to research methodology
Introduction to research methodologyIntroduction to research methodology
Introduction to research methodologyilona50
 
RESEARCH METHODOLOGY - INTRODUCTION
RESEARCH METHODOLOGY - INTRODUCTIONRESEARCH METHODOLOGY - INTRODUCTION
RESEARCH METHODOLOGY - INTRODUCTIONDr. Mohmed Amin Mir
 
MELJUN CORTES research lecture series.
MELJUN CORTES  research lecture series.MELJUN CORTES  research lecture series.
MELJUN CORTES research lecture series.MELJUN CORTES
 
Introduction to Research Methodology
Introduction to Research MethodologyIntroduction to Research Methodology
Introduction to Research MethodologyJosephin Remitha M
 
Research methodology an introduction
Research methodology an introductionResearch methodology an introduction
Research methodology an introductionMaryam Bibi
 
Researchmethodologynotes 130324234037-phpapp01
Researchmethodologynotes 130324234037-phpapp01Researchmethodologynotes 130324234037-phpapp01
Researchmethodologynotes 130324234037-phpapp01Nagaraju Singarapu
 
Researchmethodologynotes 130324234037-phpapp01
Researchmethodologynotes 130324234037-phpapp01Researchmethodologynotes 130324234037-phpapp01
Researchmethodologynotes 130324234037-phpapp01Nagaraju Singarapu
 
Research notes
Research notesResearch notes
Research notesXahRa Mir
 
Researchmethodologynotes 130324234037-phpapp01
Researchmethodologynotes 130324234037-phpapp01Researchmethodologynotes 130324234037-phpapp01
Researchmethodologynotes 130324234037-phpapp01Nagaraju Singarapu
 

Similar to BRM BCOM (2).pdf (20)

research design (B.COM).pptx
research design (B.COM).pptxresearch design (B.COM).pptx
research design (B.COM).pptx
 
research design (B.COM).pptx
research design (B.COM).pptxresearch design (B.COM).pptx
research design (B.COM).pptx
 
Research/thesis for post graduate students in dentistry.
Research/thesis for post graduate students in dentistry.Research/thesis for post graduate students in dentistry.
Research/thesis for post graduate students in dentistry.
 
Research
ResearchResearch
Research
 
Solving research problem_3539ce35db1215c11a780b1712d47e46
Solving research problem_3539ce35db1215c11a780b1712d47e46Solving research problem_3539ce35db1215c11a780b1712d47e46
Solving research problem_3539ce35db1215c11a780b1712d47e46
 
research approach and design
research approach and designresearch approach and design
research approach and design
 
FundamentalsofResearchMethodologyandDataCollection.pdf
FundamentalsofResearchMethodologyandDataCollection.pdfFundamentalsofResearchMethodologyandDataCollection.pdf
FundamentalsofResearchMethodologyandDataCollection.pdf
 
FundamentalsofResearchMethodologyandDataCollection (1).pdf
FundamentalsofResearchMethodologyandDataCollection (1).pdfFundamentalsofResearchMethodologyandDataCollection (1).pdf
FundamentalsofResearchMethodologyandDataCollection (1).pdf
 
Introduction to research methodology
Introduction to research methodologyIntroduction to research methodology
Introduction to research methodology
 
RESEARCH METHODOLOGY - INTRODUCTION
RESEARCH METHODOLOGY - INTRODUCTIONRESEARCH METHODOLOGY - INTRODUCTION
RESEARCH METHODOLOGY - INTRODUCTION
 
MELJUN CORTES research lecture series.
MELJUN CORTES  research lecture series.MELJUN CORTES  research lecture series.
MELJUN CORTES research lecture series.
 
Introduction to Research Methodology
Introduction to Research MethodologyIntroduction to Research Methodology
Introduction to Research Methodology
 
RMSA Complete Notes.pptx
RMSA Complete Notes.pptxRMSA Complete Notes.pptx
RMSA Complete Notes.pptx
 
Research methodology an introduction
Research methodology an introductionResearch methodology an introduction
Research methodology an introduction
 
Business Research Metods B.Com
Business Research Metods  B.ComBusiness Research Metods  B.Com
Business Research Metods B.Com
 
Research design
Research designResearch design
Research design
 
Researchmethodologynotes 130324234037-phpapp01
Researchmethodologynotes 130324234037-phpapp01Researchmethodologynotes 130324234037-phpapp01
Researchmethodologynotes 130324234037-phpapp01
 
Researchmethodologynotes 130324234037-phpapp01
Researchmethodologynotes 130324234037-phpapp01Researchmethodologynotes 130324234037-phpapp01
Researchmethodologynotes 130324234037-phpapp01
 
Research notes
Research notesResearch notes
Research notes
 
Researchmethodologynotes 130324234037-phpapp01
Researchmethodologynotes 130324234037-phpapp01Researchmethodologynotes 130324234037-phpapp01
Researchmethodologynotes 130324234037-phpapp01
 

Recently uploaded

The CMO Survey - Highlights and Insights Report - Spring 2024
The CMO Survey - Highlights and Insights Report - Spring 2024The CMO Survey - Highlights and Insights Report - Spring 2024
The CMO Survey - Highlights and Insights Report - Spring 2024christinemoorman
 
Contemporary Economic Issues Facing the Filipino Entrepreneur (1).pptx
Contemporary Economic Issues Facing the Filipino Entrepreneur (1).pptxContemporary Economic Issues Facing the Filipino Entrepreneur (1).pptx
Contemporary Economic Issues Facing the Filipino Entrepreneur (1).pptxMarkAnthonyAurellano
 
FULL ENJOY Call girls in Paharganj Delhi | 8377087607
FULL ENJOY Call girls in Paharganj Delhi | 8377087607FULL ENJOY Call girls in Paharganj Delhi | 8377087607
FULL ENJOY Call girls in Paharganj Delhi | 8377087607dollysharma2066
 
Call Girls In Radisson Blu Hotel New Delhi Paschim Vihar ❤️8860477959 Escorts...
Call Girls In Radisson Blu Hotel New Delhi Paschim Vihar ❤️8860477959 Escorts...Call Girls In Radisson Blu Hotel New Delhi Paschim Vihar ❤️8860477959 Escorts...
Call Girls In Radisson Blu Hotel New Delhi Paschim Vihar ❤️8860477959 Escorts...lizamodels9
 
Global Scenario On Sustainable and Resilient Coconut Industry by Dr. Jelfina...
Global Scenario On Sustainable  and Resilient Coconut Industry by Dr. Jelfina...Global Scenario On Sustainable  and Resilient Coconut Industry by Dr. Jelfina...
Global Scenario On Sustainable and Resilient Coconut Industry by Dr. Jelfina...ictsugar
 
Market Sizes Sample Report - 2024 Edition
Market Sizes Sample Report - 2024 EditionMarket Sizes Sample Report - 2024 Edition
Market Sizes Sample Report - 2024 EditionMintel Group
 
Call Girls in DELHI Cantt, ( Call Me )-8377877756-Female Escort- In Delhi / Ncr
Call Girls in DELHI Cantt, ( Call Me )-8377877756-Female Escort- In Delhi / NcrCall Girls in DELHI Cantt, ( Call Me )-8377877756-Female Escort- In Delhi / Ncr
Call Girls in DELHI Cantt, ( Call Me )-8377877756-Female Escort- In Delhi / Ncrdollysharma2066
 
2024 Numerator Consumer Study of Cannabis Usage
2024 Numerator Consumer Study of Cannabis Usage2024 Numerator Consumer Study of Cannabis Usage
2024 Numerator Consumer Study of Cannabis UsageNeil Kimberley
 
Call Girls Miyapur 7001305949 all area service COD available Any Time
Call Girls Miyapur 7001305949 all area service COD available Any TimeCall Girls Miyapur 7001305949 all area service COD available Any Time
Call Girls Miyapur 7001305949 all area service COD available Any Timedelhimodelshub1
 
Vip Female Escorts Noida 9711199171 Greater Noida Escorts Service
Vip Female Escorts Noida 9711199171 Greater Noida Escorts ServiceVip Female Escorts Noida 9711199171 Greater Noida Escorts Service
Vip Female Escorts Noida 9711199171 Greater Noida Escorts Serviceankitnayak356677
 
(Best) ENJOY Call Girls in Faridabad Ex | 8377087607
(Best) ENJOY Call Girls in Faridabad Ex | 8377087607(Best) ENJOY Call Girls in Faridabad Ex | 8377087607
(Best) ENJOY Call Girls in Faridabad Ex | 8377087607dollysharma2066
 
BEST Call Girls In Greater Noida ✨ 9773824855 ✨ Escorts Service In Delhi Ncr,
BEST Call Girls In Greater Noida ✨ 9773824855 ✨ Escorts Service In Delhi Ncr,BEST Call Girls In Greater Noida ✨ 9773824855 ✨ Escorts Service In Delhi Ncr,
BEST Call Girls In Greater Noida ✨ 9773824855 ✨ Escorts Service In Delhi Ncr,noida100girls
 
Organizational Structure Running A Successful Business
Organizational Structure Running A Successful BusinessOrganizational Structure Running A Successful Business
Organizational Structure Running A Successful BusinessSeta Wicaksana
 
/:Call Girls In Indirapuram Ghaziabad ➥9990211544 Independent Best Escorts In...
/:Call Girls In Indirapuram Ghaziabad ➥9990211544 Independent Best Escorts In.../:Call Girls In Indirapuram Ghaziabad ➥9990211544 Independent Best Escorts In...
/:Call Girls In Indirapuram Ghaziabad ➥9990211544 Independent Best Escorts In...lizamodels9
 
Annual General Meeting Presentation Slides
Annual General Meeting Presentation SlidesAnnual General Meeting Presentation Slides
Annual General Meeting Presentation SlidesKeppelCorporation
 
8447779800, Low rate Call girls in Tughlakabad Delhi NCR
8447779800, Low rate Call girls in Tughlakabad Delhi NCR8447779800, Low rate Call girls in Tughlakabad Delhi NCR
8447779800, Low rate Call girls in Tughlakabad Delhi NCRashishs7044
 
Future Of Sample Report 2024 | Redacted Version
Future Of Sample Report 2024 | Redacted VersionFuture Of Sample Report 2024 | Redacted Version
Future Of Sample Report 2024 | Redacted VersionMintel Group
 
VIP Kolkata Call Girl Howrah 👉 8250192130 Available With Room
VIP Kolkata Call Girl Howrah 👉 8250192130  Available With RoomVIP Kolkata Call Girl Howrah 👉 8250192130  Available With Room
VIP Kolkata Call Girl Howrah 👉 8250192130 Available With Roomdivyansh0kumar0
 
Sales & Marketing Alignment: How to Synergize for Success
Sales & Marketing Alignment: How to Synergize for SuccessSales & Marketing Alignment: How to Synergize for Success
Sales & Marketing Alignment: How to Synergize for SuccessAggregage
 
Lowrate Call Girls In Sector 18 Noida ❤️8860477959 Escorts 100% Genuine Servi...
Lowrate Call Girls In Sector 18 Noida ❤️8860477959 Escorts 100% Genuine Servi...Lowrate Call Girls In Sector 18 Noida ❤️8860477959 Escorts 100% Genuine Servi...
Lowrate Call Girls In Sector 18 Noida ❤️8860477959 Escorts 100% Genuine Servi...lizamodels9
 

Recently uploaded (20)

The CMO Survey - Highlights and Insights Report - Spring 2024
The CMO Survey - Highlights and Insights Report - Spring 2024The CMO Survey - Highlights and Insights Report - Spring 2024
The CMO Survey - Highlights and Insights Report - Spring 2024
 
Contemporary Economic Issues Facing the Filipino Entrepreneur (1).pptx
Contemporary Economic Issues Facing the Filipino Entrepreneur (1).pptxContemporary Economic Issues Facing the Filipino Entrepreneur (1).pptx
Contemporary Economic Issues Facing the Filipino Entrepreneur (1).pptx
 
FULL ENJOY Call girls in Paharganj Delhi | 8377087607
FULL ENJOY Call girls in Paharganj Delhi | 8377087607FULL ENJOY Call girls in Paharganj Delhi | 8377087607
FULL ENJOY Call girls in Paharganj Delhi | 8377087607
 
Call Girls In Radisson Blu Hotel New Delhi Paschim Vihar ❤️8860477959 Escorts...
Call Girls In Radisson Blu Hotel New Delhi Paschim Vihar ❤️8860477959 Escorts...Call Girls In Radisson Blu Hotel New Delhi Paschim Vihar ❤️8860477959 Escorts...
Call Girls In Radisson Blu Hotel New Delhi Paschim Vihar ❤️8860477959 Escorts...
 
Global Scenario On Sustainable and Resilient Coconut Industry by Dr. Jelfina...
Global Scenario On Sustainable  and Resilient Coconut Industry by Dr. Jelfina...Global Scenario On Sustainable  and Resilient Coconut Industry by Dr. Jelfina...
Global Scenario On Sustainable and Resilient Coconut Industry by Dr. Jelfina...
 
Market Sizes Sample Report - 2024 Edition
Market Sizes Sample Report - 2024 EditionMarket Sizes Sample Report - 2024 Edition
Market Sizes Sample Report - 2024 Edition
 
Call Girls in DELHI Cantt, ( Call Me )-8377877756-Female Escort- In Delhi / Ncr
Call Girls in DELHI Cantt, ( Call Me )-8377877756-Female Escort- In Delhi / NcrCall Girls in DELHI Cantt, ( Call Me )-8377877756-Female Escort- In Delhi / Ncr
Call Girls in DELHI Cantt, ( Call Me )-8377877756-Female Escort- In Delhi / Ncr
 
2024 Numerator Consumer Study of Cannabis Usage
2024 Numerator Consumer Study of Cannabis Usage2024 Numerator Consumer Study of Cannabis Usage
2024 Numerator Consumer Study of Cannabis Usage
 
Call Girls Miyapur 7001305949 all area service COD available Any Time
Call Girls Miyapur 7001305949 all area service COD available Any TimeCall Girls Miyapur 7001305949 all area service COD available Any Time
Call Girls Miyapur 7001305949 all area service COD available Any Time
 
Vip Female Escorts Noida 9711199171 Greater Noida Escorts Service
Vip Female Escorts Noida 9711199171 Greater Noida Escorts ServiceVip Female Escorts Noida 9711199171 Greater Noida Escorts Service
Vip Female Escorts Noida 9711199171 Greater Noida Escorts Service
 
(Best) ENJOY Call Girls in Faridabad Ex | 8377087607
(Best) ENJOY Call Girls in Faridabad Ex | 8377087607(Best) ENJOY Call Girls in Faridabad Ex | 8377087607
(Best) ENJOY Call Girls in Faridabad Ex | 8377087607
 
BEST Call Girls In Greater Noida ✨ 9773824855 ✨ Escorts Service In Delhi Ncr,
BEST Call Girls In Greater Noida ✨ 9773824855 ✨ Escorts Service In Delhi Ncr,BEST Call Girls In Greater Noida ✨ 9773824855 ✨ Escorts Service In Delhi Ncr,
BEST Call Girls In Greater Noida ✨ 9773824855 ✨ Escorts Service In Delhi Ncr,
 
Organizational Structure Running A Successful Business
Organizational Structure Running A Successful BusinessOrganizational Structure Running A Successful Business
Organizational Structure Running A Successful Business
 
/:Call Girls In Indirapuram Ghaziabad ➥9990211544 Independent Best Escorts In...
/:Call Girls In Indirapuram Ghaziabad ➥9990211544 Independent Best Escorts In.../:Call Girls In Indirapuram Ghaziabad ➥9990211544 Independent Best Escorts In...
/:Call Girls In Indirapuram Ghaziabad ➥9990211544 Independent Best Escorts In...
 
Annual General Meeting Presentation Slides
Annual General Meeting Presentation SlidesAnnual General Meeting Presentation Slides
Annual General Meeting Presentation Slides
 
8447779800, Low rate Call girls in Tughlakabad Delhi NCR
8447779800, Low rate Call girls in Tughlakabad Delhi NCR8447779800, Low rate Call girls in Tughlakabad Delhi NCR
8447779800, Low rate Call girls in Tughlakabad Delhi NCR
 
Future Of Sample Report 2024 | Redacted Version
Future Of Sample Report 2024 | Redacted VersionFuture Of Sample Report 2024 | Redacted Version
Future Of Sample Report 2024 | Redacted Version
 
VIP Kolkata Call Girl Howrah 👉 8250192130 Available With Room
VIP Kolkata Call Girl Howrah 👉 8250192130  Available With RoomVIP Kolkata Call Girl Howrah 👉 8250192130  Available With Room
VIP Kolkata Call Girl Howrah 👉 8250192130 Available With Room
 
Sales & Marketing Alignment: How to Synergize for Success
Sales & Marketing Alignment: How to Synergize for SuccessSales & Marketing Alignment: How to Synergize for Success
Sales & Marketing Alignment: How to Synergize for Success
 
Lowrate Call Girls In Sector 18 Noida ❤️8860477959 Escorts 100% Genuine Servi...
Lowrate Call Girls In Sector 18 Noida ❤️8860477959 Escorts 100% Genuine Servi...Lowrate Call Girls In Sector 18 Noida ❤️8860477959 Escorts 100% Genuine Servi...
Lowrate Call Girls In Sector 18 Noida ❤️8860477959 Escorts 100% Genuine Servi...
 

BRM BCOM (2).pdf

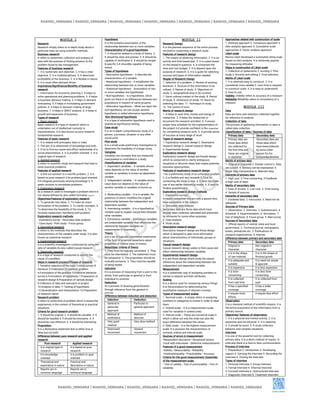
  • 1. ʀᴀsʜɪᴅ_ᴠᴇɴɢᴀʀᴀ | ʀᴀsʜɪᴅ_ᴠᴇɴɢᴀʀᴀ | ʀᴀsʜɪᴅ_ᴠᴇɴɢᴀʀᴀ | ʀᴀsʜɪᴅ_ᴠᴇɴɢᴀʀᴀ | ʀᴀsʜɪᴅ_ᴠᴇɴɢᴀʀᴀ | ʀᴀsʜɪᴅ_ᴠᴇɴɢᴀʀᴀ | ʀᴀsʜɪᴅ_ᴠᴇɴɢᴀʀᴀ ʀᴀsʜɪᴅ_ᴠᴇɴɢᴀʀᴀ | ʀᴀsʜɪᴅ_ᴠᴇɴɢᴀʀᴀ | ʀᴀsʜɪᴅ_ᴠᴇɴɢᴀʀᴀ | ʀᴀsʜɪᴅ_ᴠᴇɴɢᴀʀᴀ | ʀᴀsʜɪᴅ_ᴠᴇɴɢᴀʀᴀ | ʀᴀsʜɪᴅ_ᴠᴇɴɢᴀʀᴀ MODULE I Research Research simply refers to in-depth study about a particular topic by using scientific methods. Business research It refers to systematic collection and analysis of data with the purpose of finding answers to the problem faced by the management. Features of business research 1. It is systematic and objective. 2. It has a clear objective. 3. It is multidisciplinary. 4. It determine profitability of the business. 5. It is flexible in nature. 6. It is most often demand driven. Importance/Significance/Benefits of business research 1. Information for economic planning 2. It helps to solve operational and planning problems. 3. It helps in business decision making. 4. It helps in demand forecasting. 5. It helps in formulating government policies. 6. It helps in decision making of large business. 7. It helps in SWOT analysis. 8. It helps in growth and expansion of business. Types of research 1. Basic research Basic research is a type of research which is undertaken out of intellectual curiosity or inquisitiveness. It is also known as pure research, fundamental research. Features of basic research 1. It is related with principles, laws or rules. 2. The aim is to attainment of knowledge and truth. 3. It try to find out cause and effect relationship of a social phenomenon. 4. It is problem oriented. 5. It is original type of research. 2. Applied research It refers to scientific study and research that help to solve practical problems. Features of applied research 1. It find out solution to a real life problem. 2. It is based on pure research 3.Its problem/goal oriented 4.It integrate previously existing knowledge 5. It seeks solution to immediate problems. 3. Exploratory research Its a research used to investigate a problem which is not clearly defined.its also called formative research Objectives/Features of exploratory research 1. To generate new ideas. 2. To make an exact formulation of the problem. 3. To clarify concepts. 4. To determine the feasibility of the study. 5. To increase researchers familiarity with problem. Exploratory research methods • Experience survey • Secondary data analysis • Case study • Pilot study • Focus group 4. Descriptive research It refers to the methods that describes the characteristics of the variable under study. It is also known as statistical research. 5. Experimental research It is a scientific investigation conducted by using two sets of variables.Its also called casual research 6. Diagnostic research It is a type of research conducted to identify the cause of a problem. Steps in research process/Phases of research 1.Tentative selection of the topic 2.Initial survey of literature 3.Finalization of research problem 4.Formulation of the problem 5.Extensive literature survey 6.Formulation of hypothesis 7.Preparation of research design 8.Preparation of sample design 9.Collection of data and execution of project 10.Analysis of data 11.Testing of hypothesis 12.Generalization and interpretation 13.Preparation of research report Research problem It refers to some kind of problem which a researcher experiences in the context of theoretical or practical situations. Criteria for good research problem 1. It should be original. 2. It should be solvable. 3. It should be feasible 4. It should be innovative. 5. It should be cost effective. 6. It should be interesting. Proposition It is a declarative statement that is either true or false but not both. Difference between pure research and applied research Pure research Applied research It is original type of research It is based on pure research It is knowledge oriented It is problem or goal oriented Theoretical and exploratory in nature Practical and descriptive in nature Reports are in common language Reports are in technical language Hypothesis It is the tentative assumption of the relationship between two or more variables. Characteristics of a good hypothesis 1. It should be related to a body of theory. 2. It should be clear and precise. 3. It should be capable of verification 4. It should be simple & specific 5.It shouldbe capable of being tested Types of hypothesis • Descriptive hypothesis :- It describe the characteristics of a variable. • Relational hypothesis :- It establishes the relationship between two or more variables. • Statistical hypothesis :- Association of two or more variables are hypothesed • Null hypothesis :- is a hypothesis, which point out there is no differences between two populations in respect of same property. • Alternative hypothesis :- When we reject the null hypothesis, we can accept another hypothesis is called alternative hypothesis. Non directional hypothesis It is a type of alternative hypothesis used in statistical significance testing. Case study It is an in-depth comprehensive study of a person, a process, situation or any other social units. Pilot study It is a small scale preliminary investigation to determine the feasibility of a larger study. Variables Variables are concepts that are measured, manipulated or controlled in a study. Classifications of variables 1. Dependent variables :- A variable whose value depends on the value of another variable or variables is known as dependent variable. 2. Independent variable :- A variable whose value does not depend on the value of another variable or variables is known as .......... 3. Moderating variable :- It is a variable, the presence of which, modifies the original relationship between the independent and dependent variable. 4. Intervening variable :- It is a hypothetical variable used to explain casual links between other variables. 5. Extraneous variable :- Extraneous variables are undesirable variables that influences the relationship between variables an experimenter is examining. Theory It is a set of logically interrelated statements in the form of empirical assertions about properties of infinite class of events. Requisites/ criteria of theory 1. They must be logically consistent. 2. They must be interrelated. 3. The statement must be exhaustive. 4. The proposition should be mutually exclusive. 5. They must be capable of being tested. Induction It is a process of reasoning from a part to the whole, from particular to general or from individual to universe. Deduction Its a process of drawing generalization through inference from the general to particular Difference between induction and deduction Induction Deduction General to particular approach Particular to general approach Method of verification Method of discover Very quick method Very slow method Downward movement Upward movement MODULE II Research Design It is the planned sequence of the entire process involved in conducting a research study Features of research design 1. The means of obtaining information. 2. It is an activity and time based plan. 3. It is a plan based on the research question. 4. It comprises the time and cost budget. 5. It is depend upon the purpose of research. 6. It is a guide for selecting sources and types of information needed. Stages of Research Design 1. Selection of a problem. 2. Review of existing literature. 3. Sources of the information to be utilized. 4. Nature of study. 5. Objectives of study. 6. Geographical area to be covered. 7. Socio cultural context of the study. 8. Period of study. 9. Dimension of study. 10. Basis for selecting the data. 11. Technique of study. 12. The control of error. Merits of research design 1. It helps to save time, money and energy of researcher. 2. It helps the researcher to document the research activities. 3. It ensure proper time schedule for the implementation of the project 4.it provide confident to the researcher for completing research work. 5. It provide sense of success at every stage of work. Types of research design 1. Exploratory research design 2. Descriptive research design 3. Causal research design 4. Experimental design Exploratory research design Exploratory research design are thosde design which is conducted to clarify ambiguous situations or discover ideas that maybe potential business opportunities. Features of exploratory research design 1.Its a preliminary study of an unfamiliar problem 2. It is flexible and very versatile 3. Cost for conducting the study is less. 4. It does not make use of any earlier theoretical model. 5. It used to finalize questionnaire. Exploratory research design methods 1. Experience surveys It means researcher interact with a person who have experience in the subject. 2. Secondary data analysis Secondary data are those data which have already been collected, tabulated and presented by someone for some other purposes. 3. Case analysis 4. Piolet study Descriptive research design Descriptive research design are those design which is designed to gain more information about characteristics of individuals, groups or situations. Casual research design Casual research design seeks to find cause and effect relationship between variables. Experimental research design It is are those design which study the casual inferences about the relationship between the independent and dependent variable. Measurement It is a systematic way of assigning numbers or names to objects and their attributes. Scaling It is a device used for measuring various things. It is the procedure for determining the quantitative measure of abstract concept. Types of measurement scales 1. Nominal scale :- It simply refers to assigning numbers or categories to events in order to label them. 2. Ordinal scale :- It is a measurement scale, used for variables in ranked order. 3. Interval scale :- These are numerical scale in which it allow not only the order but also the exact difference between the values. 4. Ratio scale :- It is the highest measurement scale. It is possess the characteristics of nominal, ordinal and interval scale. Sources of errors in measurement •Respondent reluctance • Situational factors •Fault with interviewer • Defective measurements Features of a good measurement •Validity • Measurability • Reliability •Unidimensionality • Practicability • Accuracy Criteria for the good measurement/ Essentials of the measurement scale • Test of validity • Test of practicability • Test of reliability Approaches related with construction of scale 1. Arbitrary approach 2. Consensus approach 3. Item analysis approach 4. Cumulative scale approaches 5. Factor analysis approach Likert scale Rensis Likert developed a summated rating scale based on item analysis. It is extremely popular for measuring attitudes. Steps in construction of Likert scale 1. Collection of statements 2. wording 3. Pilot study 4. Scrutiny and editing 5. Final selection Merits of Likert scale 1. It is relatively easy to construct. 2. It is considered more reliable 3. Less time is required to construct scale. 4. It is easy to understand. 5. Easy to use. Validity:- Validity refers to accuracy of a measure Reliability Reliability refers to consistency of a measure MODULE III Data Data are facts and statistics collected together for reference or analysis. Collection of data The process of gathering information or data is called data collection. Classification of data / Sources of data Primary data Secondary data Primary data are those data which are collected for the first time and these are original in character Secondary data are those data which have beencollected by some other person for his purpose&published Merits of primary data 1. Original in character 2. Greater control 3. Data are current. 4. Secrecy can be maintained. 5. Better data interpretation 6. Relevant data. Demerits of primary data 1. High cost. 2.Time consuming. 3.Feedback. 4.High cost of labor. Merits of secondary data 1. Ease of access. 2. Low cost. 3. Time saving. 4. Variety of sources. Demerits of secondary data 1. Outdated data. 2. Inaccurate. 3. Need not be adequate. Sources of Primary data 1. Observation. 2. Interview. 3. Questionnaire. 4. Schedule. 5. Experimentation. 6. Simulation. 7. Use of telephone. 8. Focus group. 9. Mail survey Sources of Secondary data 1. Official reports of central, state and local government. 2. Technical journal, newspapers, books, periodicals etc. 3. Publications of research organizations. 4. Internet. Difference between primary and secondary data Primary data Secondary data Original in character Not original in character It is in the shape of raw material It is in the shape of finished goods It is adequate and suitable It is need not ample & apposite It is expensive. It is less expensive It is time consuming It is less time consuming. It is collected from real time It is collected from past It has a specified coverage It has a wider coverage It require more efforts It require less effort Observation It is a classical method of scientific enquiry. It is the active acquisition of the information from a primary source. Objectives/ features of observation 1. It is a physical and mental activity. 2. It is purposive and not informal. 3. It is selective. 4. It should be exact. 5. It study collective behavior and complex situations. Interview It is one of the powerful tool for collecting primary data. It is a direct method of inquiry. In interview there is a face to face communication. Process of interview 1. Preparation 2. Introduction 3. Developing rapport 4. Carrying the interview 5. Recording the interview 6. Closing the interview Types of interview 1. Personal interview 2. Group interview 3. Formal interview 4. Informal interview 5. Focused interview 6. Unstructured interview 7. Diagnostic interview 8. Treatment interview
  • 2. ʀᴀsʜɪᴅ_ᴠᴇɴɢᴀʀᴀ | ʀᴀsʜɪᴅ_ᴠᴇɴɢᴀʀᴀ | ʀᴀsʜɪᴅ_ᴠᴇɴɢᴀʀᴀ | ʀᴀsʜɪᴅ_ᴠᴇɴɢᴀʀᴀ | ʀᴀsʜɪᴅ_ᴠᴇɴɢᴀʀᴀ | ʀᴀsʜɪᴅ_ᴠᴇɴɢᴀʀᴀ | ʀᴀsʜɪᴅ_ᴠᴇɴɢᴀʀᴀ ʀᴀsʜɪᴅ_ᴠᴇɴɢᴀʀᴀ | ʀᴀsʜɪᴅ_ᴠᴇɴɢᴀʀᴀ | ʀᴀsʜɪᴅ_ᴠᴇɴɢᴀʀᴀ | ʀᴀsʜɪᴅ_ᴠᴇɴɢᴀʀᴀ | ʀᴀsʜɪᴅ_ᴠᴇɴɢᴀʀᴀ | ʀᴀsʜɪᴅ_ᴠᴇɴɢᴀʀᴀ Questionnaire It is a list of question send to a number of persons for them to answer. Questionnaire design process 1. Define the objective of the study. 2. Deciding on the information required. 3. Determining the sample group. 4. Choose method of reaching target group. 5. Writing the questionnaire. 6. Administrating the questionnaire. 7. Piloting the questionnaire. 8. Development of the final questionnaire. Guidelines for the preparation of questionnaire 1. It should be attractive. 2. Avoid long words. 3. Avoid ambiguous words. 4. Avoid biased questions 5. Question should be limited to single idea. 6. It should be designed in simple language. Merits of questionnaire 1. It is economical. 2. Uniformity. 3. Free from bias. 4. Reliable results. 5. Respondent get enough time to answer the questions. Schedule It is a set of questions which are asked and filled by the interviewer in a face to face situation with another person. Difference between questionnaire and schedule Questionnaire Schedule Responses are filled by respondents Responses are filled by enumerators It is useful only to literate It is useful to both literate and illiterate people No direct contact with respondents Direct contact with respondents It has large coverage It has less coverage Questionnaires response rate is low Schedules response rate is high Sample It is a small representation of a large unit. Sampling It is a process of selecting sample from the population. Sampling design It is a definite plan for obtaining a sample from a given population. Steps in sampling design 1. Define population 2. State the sampling frame 3. Identify the sample unit 4. State the sampling method 5. Determine the sample size 6. Spell out the sampling plan 7. Select the sample Features of a good sample design 1. It must be a truly representative sample. 2. It should not cause more errors. 3. It should be viable on the basis of budget constraints. 4. It is able to control systematic bias effectively. Principles of Sampling 1. Principle of statistical regularity 2. Principle of inertia of large numbers Types of sampling design (Methods / Techniques of sampling) A. Probability sampling (Random sampling) It is defined as the kind of sampling in which every element in the population has an equal chance of being selected. Types of probability sampling a. Simple random sampling :- Every member of the population has the same probability of inclusion in the sample. b. Systematic sampling :- It is a statistical method involving the selection of elements from an ordered sampling frame. c. Stratified sampling :- It is a sampling method in which population is divided into homogeneous groups and sample is randomly taken from the group. d. Cluster sampling :- It is a sampling method wherein the members of the population are selected at random from naturally occurring group called cluster. e. Multistage sampling :- It is a type of sampling and draw a sample from population using smaller and smaller groups at each stage. f. Sequential sampling :- It is a sampling technique which involves evaluation of each sample taken from a population to see if it fits a desired conclusion. B. Non-Probability sampling It is a sampling method in which not all members of the population have an equal chance of participating in the study. . Types of non-probability sampling A. Convenience sampling :- It is a sampling method in which it attempts to obtain sample from convenient elements. B. Purposive sampling :- It is a sampling method in which researcher intentionally select the sample based on some previous knowledge about the population C. Accidental sampling :-It is a nonprobability sampling that involves the sample being drawn from that part of the population that is close to hand. D. Quota sampling :- It is a sampling method where in data is collected from a homogenous group. E. Snowball sampling :- It is a special non- probability method used when the desired sample characteristics is rare. Sample size It refers to number of participants or observations include in a study. Determinants of optimum sample size 1. Nature of population 2. Number of classes proposed. 3. Nature of study. 4. Types of sampling 5. Degree of accuracy 6. Availability of finance. Sampling error The errors which arises due to the use of sampling survey are known as sampling errors. Non-sampling errors These are the errors which can impact the final survey estimates caused by problems in data collection, processing, etc. MODULE IV Data Processing It is a process of classification and summarization of data in order to make ready for analysis. Data processing stages 1. Editing 2. Coding 3. Classification 4. Tabulation Editing It is a process of examining the data collected to detect the errors and omission and correct to these as far as possible. Coding It is a process of reducing data in to small number of classes. Classification It is a process of grouping of a related facts on the basis of certain common characteristics. Types of classification 1. Qualitative classification :- Data are classified on the basis of some quality such as sex, literacy, religion etc. 2.Quantitative classification:-Classification of data according to some characteristics that can be measured such as height, weight, etc. 3. Geographical classification :- Data classified on the basis of geographical area or location. 4. Chronological classification :- Classified on the basis of period of time. 5. Dichotomous classification :- Where only 2 classes are formed is called dichotomous classification. Tabulation It is an orderly arrangement of raw in data in columns and rows. Features of tabulation 1. It helps to simplify complex data. 2. It facilitates comparison. 3. It gives an identity to data. 4. It helps to detect errors. 5. It helps to find omissions. Principles of tabulation 1. The table should be suit to the size of the paper. 2. The table should have a clear title. 3. To avoid unnecessary details. 4. Do not use ditto marks. 5. Table should be clear, accurate and simple. 6. The unit of measurement should be clearly defined. Data entry It is the process of computerizing the data. Validity of data It refers to how accurately a method measures what it is intended to measure. Uses of graphs and diagrams 1. It helps in presenting data in simple and clear. 2. It makes the whole data readily intelligible. 3. It is used for comparison. 4. It save time in understanding data. 5. It is useful in analyzing complect economic situations. 6. It is understood without doing mathematical calculations. Types of chart Charts or line graphs It displays information in a series of data points that each represents an individual measurement or piece of data. Bar charts It is a common type of graphs which consists of parallel bars or rectangles with lengths that are equal to the quantities that are occur in a given data set. Histogram It is a graph of frequency distributions. It is a set of vertical bars whose are proportions to the frequencies. Frequency polygon It is a graph of frequency distribution. Frequency curve A continuous frequency distribution can be represented by a smooth curve is known as frequency curve. Ogive Smoothed frequency curves drawn for the two cumulative series are called ogive. Pie diagram It is a circle divided into sections which each display the size of a relative piece of information. Pictogram Is an ideogram that conveys its meaning through pictorial resemblance to a physical object Analysis of data It is a critical examination of data for studying the characteristics of object under study. Types of data analysis Descriptive analysis These are used to describe the basic features of data in a study. It provides simple summary about sample and measure. Univariate analysis It involves describing the distribution of a single variable including its central tendency and dispersion. Bivariate analysis It is one of the simplest form of quantitative analysis. It involves the analysis of two variables for the purpose of determining the empirical relationship between them. Multivariate analysis In multivariate analysis, multiple relations between multiple variables are examined simultaneously. Factor analysis It is a technique that is used to reduce a large number of variables into fewer number of factors Inferential analysis Its concerned with various tests of significance for testing hypothesis in order to determine what validity data canbe set to indicate some conclusions Types of measures of central tendency 1. Mean 2. Geometric mean 3. Harmonic mean 4. Median 5. Mode Arithmetic mean (AM) The most commonly used measures of central tendency. Mean is the sum of the values divided by the total number of items in the set. Merits of AM 1. It is easy to calculate 2. It is simple to follow 3. It is finite 4. It is based on the all observations. 5. It is rigidly defined. 6. It is an algebraic treatment. Demerits of AM 1. It is highly affected by extreme values. 2. It cannot be compute accurately. 3. It is not a suitable average for highly skewed distributions. 4. It cannot average the ratios. 5.It cannot average the percentage. Geometric mean (GM) Geometric mean is the nth positive root of the product of 'n' positive given values. Harmonic mean (HM) Harmonic mean is the reciprocal of the arithmetic mean of the reciprocal of the given set of observations. Median Median is the most middle value in the arrayed data. Mode Mode is the most frequently occurring value in the data set. Range Range is defined as the difference between the values of the extreme items of a series. Mean deviation Mean deviation is defined as the mean of the absolute deviations of observations from some suitable averages like mean median mode. Tools and statistical measures for analysis a. Descriptive statistics 1. Measures of central tendency 2. Measures of dispersion. 3. Measures of correlation. 4. Regression analysis. 5. Index numbers. 6. Time series analysis. 1. Measures of central tendency Average tends to indicating the center of the distribution is called....... 2. Measures of dispersion The degree to which numerical data tend to spread about an average value is called dispersion or variation. 3. Correlation Correlation is a statistical technique which can be used to study the relationship between two or more variables. 4. Regression It is the measure of the average relationship between two or more variables in terms of original units of the data. 5. Index numbers Index number is a statistical device for measuring the statistical changes in group of related variables over a period. 6. Time Series It refers to arrangement of data according to the time of occurrence. Standard deviation The standard deviation is defined as the positive square root of the mean of the square deviations taken from arithmetic mean of the data. Simple index numbers Simple index numbers are those numbers in which all items are treated as equally. Weighted index numbers Weighted index numbers are those numbers it is based onthe weight of the selected commodities Consumer price index number It represents the average change in prices over a period of time paid by the consumer for goods and services. Type I Error It means rejection of hypothesis which should have been accepted. Type II Error It means accepting the hypothesis which should been rejected. Parametric test The statistical tests based on the assumption that population or population parameter are normally distributed is called parametric test. Important parametric test • Z-test • T-test • F-test Non Parametric test Non-parametric test are method of testing hypothesis when the nature of the distribution are unknown. It is also called distribution free statistics. Anova It is a statistical technique that is used to compare groups on possible differences in the average of a quantitative measure. Chi-square test It is a statistical measure used in the context of sampling analysis for comparing a variance to theoretical variance. Interpretation It refers to technique of drawing inference from collected data.
  • 3. ʀᴀsʜɪᴅ_ᴠᴇɴɢᴀʀᴀ | ʀᴀsʜɪᴅ_ᴠᴇɴɢᴀʀᴀ | ʀᴀsʜɪᴅ_ᴠᴇɴɢᴀʀᴀ | ʀᴀsʜɪᴅ_ᴠᴇɴɢᴀʀᴀ | ʀᴀsʜɪᴅ_ᴠᴇɴɢᴀʀᴀ | ʀᴀsʜɪᴅ_ᴠᴇɴɢᴀʀᴀ | ʀᴀsʜɪᴅ_ᴠᴇɴɢᴀʀᴀ ʀᴀsʜɪᴅ_ᴠᴇɴɢᴀʀᴀ | ʀᴀsʜɪᴅ_ᴠᴇɴɢᴀʀᴀ | ʀᴀsʜɪᴅ_ᴠᴇɴɢᴀʀᴀ | ʀᴀsʜɪᴅ_ᴠᴇɴɢᴀʀᴀ | ʀᴀsʜɪᴅ_ᴠᴇɴɢᴀʀᴀ | ʀᴀsʜɪᴅ_ᴠᴇɴɢᴀʀᴀ MODULE V Research report A research report is a systematic, scientific and consistent presentation of the entire process of research. Functions of research report • It serve as a reference material for future. • It reveals the research ability of the researcher. • It is useful for policy makers and administrators • Its used to judge the quality of the research work • It is used to evaluate competency of the researcher. Features/ Characteristics/ Qualities/ Essentials of a good report • Clarity • Size • Validity • Orderliness • Simple language • Attractive • Free from mistakes • Interesting • Accurate • Use familiar words Importance/ Significance/ Purpose of research report • It helps the researcher to evaluate the success of report. • It reveals the ability of the researcher. • It is useful to policy makers and administrators. • It is guided by management decisions. • It is the presentation of findings. • It examine the validity of the generalizations. • It is the inspiration for further research. Types of Report Oral Report It is a type of report which is not in written format. This is reporting verbally in person. Written Report It is a type of report which is in written format describing the finding of the report. Popular report It is a type of report meant for general public. It is prepared in simple language. Technical report It is a report prepared for specialists who are interested in understanding the technical aspects of research methodology. Report submitted to administrator It is intended for taking decisions. It includes some technical data and supporting data. Stages/ Steps/ Procedure of report writing • Understanding the subject matter & its logical analysis • Preparing the final outline of the report • Preparing the rough draft or first draft •Finalizing the report Comprehension It is the ability to understand and get meaning from spoken and written languages. It measure whether a user can understand the intend meaning of a text and can draw the correct conclusion Readability It is the ease with which a reader can understand a written text. It depend on its content and presentations. Tone It is the writers voice in written work. It is what the reader might perceive the writers attitude. Title of the report The title of the report summarizes main idea of the study. A good title contains fewest possible words and adequately describe the purpose of the research. Bibliography A bibliography is a detailed list of all the sources consulted and cited in a research paper & project Types/ Kinds of bibliography • Working bibliography :-Its a type of bibliography formed at the starting stage of the enquiry. It maybe prepared before the selection of research problem. It helps the researcher to understand the problem. • Final bibliography :-It is a type of bibliography after the completion of research report. It helps to verify the facts and statements in the report. It helps the researcher who are interested tofurther study of the problem. Role of audience The audience of the research includes experts, technician, executives, non-specialists, etc. Executive summary It is a thorough overview of a research report. Need for executive summary in research report • Objectives of the research report • Nature of the decision problem • Key results • Conclusion • Recommendation for action Abstract An abstract is a summary of the research report. It describe the topic, the scope, the principal findings and the conclusions. Glossary A glossary is a short dictionary giving definitions and examples Footnote An additional piece of information printed at the bottom of a page is called foot note. Ethics in research Ethics in research means the application of fundamental ethical principles to research activities. It involves requirements on daily work, the protection of dignity of subjects and population of the information in research. Ethical principles followed by a researcher • Honesty • Objectivity • Confidentiality • Carefulness • Integrity • Openness • Social responsibility • Legality • Competence Difference between objectivity and subjectivity in research Objectivity Subjectivity It is personal impartiality It is judgement based on individual It is based on facts It can vary from person to person It cannot be influenced personal values and biases It can be influenced It canbe interpreted as mind-independent It consists of statements of judgement, assumption etc It cannot be altered based on personal opinion It can be altered Used in decision making process May or may not use in decision making Format / Layout / Content of a research report The Preliminaries The Text The Preliminaries The Text The Reference material Title Page Abstract Bibliography Letter of transmittal Introduction Appendix Acknowledgment Research procedure Index (if any) Letter of authentication Results Table of contents Discussions List of tables Conclusion List of figures summary