
Recommended
Recommended
More Related Content
What's hot
What's hot (20)
Similar to Lug corporate presentation november 2021 pms
Similar to Lug corporate presentation november 2021 pms (20)
More from Adnet Communications
More from Adnet Communications (20)
Recently uploaded
Recently uploaded (20)
Lug corporate presentation november 2021 pms
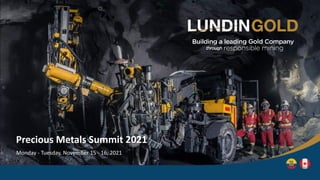
- 1. Precious Metals Summit 2021 Monday - Tuesday, November 15 - 16, 2021
- 2. Caution Regarding Forward-Looking Information and Statements All statements, other than statements of historical fact, made and information contained in this presentation and responses to questions constitute “forward-looking information” or “forward- looking statements” as those terms are defined under Canadian securities laws (“forward- looking statements”). Forward-looking statements may be identified by terminology such “believes”, “anticipates”, “expects”, “is expected”, “scheduled”, “estimates”, “pending”, “intends”, “plans”, “forecasts”, “targets”, or “hopes”, or variations of such words and phrases or statements that certain actions, events or results “may”, “could”, “would”, “will”, “should” “might”, “will be taken”, or “occur” and similar expressions). By their nature, forward-looking statements involve assumptions, inherent risks and uncertainties, many of which are difficult to predict, and are usually beyond the control of management, that could cause actual results to be materially different from those expressed by these forward-looking. Lundin Gold believes that the expectations reflected in these forward-looking statements are reasonable as of the date made, but no assurance can be given that these expectations will prove to be correct. In particular, this presentation contains forward-looking statements pertaining to: estimates of gold production, grades, recoveries and costs, expected sales receipts, cash flow forecasts and financing obligations, capital costs and the expected timing and impact of completion of capital projects including the south ventilation raise, the throughput expansion project, the timing and the success of its drill program at Fruta del Norte and its other exploration activities and the Company’s efforts to protect its workforce from COVID-19. There can be no assurance that such statements will prove to be accurate, as Lundin Gold's actual results and future events could differ materially from those anticipated in this forward-looking information as a result of the factors discussed in the "Risk Factors" section in Lundin Gold's Annual Information Form dated March 2, 2021, which is available at www.lundingold.com or on SEDAR. Forward-looking information should not be unduly relied upon. Except as noted, the technical information contained in this presentation relating to the Fruta Del Norte Project is based on a Technical Report prepared for the Company entitled “Fruta del Norte Project, Ecuador, NI 43-101 Technical Report on Feasibility Study” dated June 15, 2016 with an effective date of April 30, 2016. Information of a scientific and technical nature in this presentation was reviewed and approved by Ron Hochstein, P.Eng., Lundin Gold’s President and Chief Executive Officer, who is a Qualified Persons within the meaning of National Instrument 43-101 - Standards of Disclosure for Mineral Projects (“NI 43-101”). Unless otherwise indicated, all dollar values herein are in US dollars. Important Information for US Investors This presentation may use the terms “measured", “indicated“, “inferred" and “historical” mineral resources. U.S. investors are advised that, while such terms are recognized and required by Canadian regulations, the Securities and Exchange Commission does not recognize them. “Inferred mineral resources" and “historical estimates” have a great amount of uncertainty as to their existence and great uncertainty as to their economic feasibility. It cannot be assumed that all or any part of an inferred mineral resource or a historical estimate will ever be upgraded to a higher category. Under Canadian rules, estimates of inferred mineral resources may not form the basis of feasibility or other economic studies. Further, historical estimates are not recognized under Canada’s NI 43- 101. U.S. investors are cautioned not to assume that all or any part of measured or indicated mineral resources will ever be converted to mineral reserves. This presentation is not an offer of securities for sale in the United States or in any other jurisdiction. The Company’s securities have not been and will not be registered under the United States Securities Act of 1933, as amended, and may not be offered or sold within the United States absent registration or an application exemption from registration. 2
- 3. Delivering Through Volatile Times 3 Operational Excellence Reserve Growth Throughput Expansion Exploration 3,500 to 4,200 tpd Current mining rate is 4,200 tpd. Stockpiling excess ore. Mill throughput of 4,200 tpd to be achieved in Q4 2021 Fruta del Norte Probable Mineral Reserves: 5.24 Moz1 Increase of 5% compared to FY2019 reconciliation Ongoing 10,000m underground drilling program offers further upside 9,000m drill program costing $11m started in Q1 2021 High priority targets: Barbasco and Puente-Princesa Targeting discovery of another Fruta del Norte type deposit Expect to meet upper range of 2021 production guidance Focused on continued optimization of operations Positioned to deliver many years of significant free cash flow 1. See the Company’s Annual Information Form dated March 2, 2021, available under the Company’s profile at www.sedar.com
- 4. FDN’s Strong Performance Continues in Q3 4 Three Months ended September 30, 2021 Three Months ended September 30, 2020 107,663 oz Gold produced 365,316 Tonnes milled 10.3 g/t Average Head Grade 88.8% Average recovery 3,971 tpd Average Mill Throughput 76,837 oz Gold as concentrate 30,826 oz Gold as doré 94,250 oz Gold produced 324,143 Tonnes milled 10.4 g/t Average Head Grade 86.8% Average recovery 3,340 tpd Average Mill Throughput 66,790 oz Gold as concentrate 27,460 oz Gold as doré
- 5. Company is Firmly on Track to Meet its 2021 Guidance 5 1. Please refer to the Company's MD&A for the third quarter of 2021 for an explanation of non-IFRS measures used 320,599 oz gold 2021 YTD Production $778 per oz gold 2021 YTD AISC 380,000 – 420,000 oz gold 2021 Production Guidance $770 – 830 per oz gold 2021 AISC1
- 6. 79.6 94.4 192.2 221.8 92.6 2.6 (40.5) (24.7) Cash as at Dec. 31, 2020 Cash as at March 31, 2021 Cash as at June 30, 2021 Cash generated from operating activities Proceeds from stock option exercises and exercise of anti-dilution rights Principal and interest payments made under the loan facilities Capital expenditures Cash as at September 30, 2021 Lundin Gold Continues to Generate Strong Cash Flows 6 As at September 30, 2021, Lundin Gold had a working capital balance of $136.1 million compared to $56.6 million at December 31, 2020 In Q3 2021, Lundin Gold generated $92.6 million in operating cash flow and ended the quarter with a cash balance of $221.8 million, which supports debt repayments, exploration and planned capital expenditures, including the expansion project
- 7. 99% 7 Vaccination campaigns by Ecuador’s Ministry of Public Health have been ongoing directly at site since Q2 2021 for the Company’s employees and contractors Most Employees Vaccinated at FDN Fully Vaccinated Employees and Contractors1 1. As at October 31, 2021
- 8. Ongoing Construction Projects – South Ventilation Raise 8 Q2 2022 Anticipated SVR Completion Raise boring of the 2.1 m raise was completed near the end of the quarter and shotcrete lining was completed shortly thereafter Contractor has been selected and mobilization underway No anticipated impact on production forecasts for remainder of 2021 or 2022 as a result of the revised work plan
- 9. Mine and Mill Operating at 4,200 tpd Throughput Rate 9 Mine ramped up to 4,200 tpd Final piping tie-ins and commissioning underway. Flotation and concentrate filtering completed and operating. Mill now operating at 4,200 tpd 4,200 tpd expansion project on schedule and on budget Q4 Q3 2021 Mill expansion substantially completed early in Q4
- 10. The 10,000 m underground drill program. Initial results expected in Q1 2022. Fruta del Norte Resource Expansion Drilling Program Progressing 10 Drill program focused on opportunities within existing current reserve and expansion of Inferred Resources
- 11. 11 Objective is to discover another Fruta del Norte type gold-silver epithermal deposit Regional Exploration Potential Suarez Pull Apart Basin – 38 km2 FDN East FDN SW Alejandro La Negra Norte Barbasco Emperador El Puma Fruta del Norte Gata Salvaje Puente-Princesa La Negra Guayacan Lora Key exploration ground is the 38 km2 Suarez Pull-Apart Basin The Basin remains essentially untested and geological conditions are similar to those at Fruta del Norte In Q3 2020, permits for drilling two high priority targets, Barbasco and Puente-Princesa, were received Many more additional targets yet to be evaluated
- 12. Drilling at the Barbasco Target Ended During the Third Quarter 12 Holes intersected late FDN andesites, Suarez basin fill sediments and Santiago Formation andesites and sediments Zones of epithermal related alteration intersected and multiple narrow, widely spaced epithermal quartz- carbonate-sulphide veins and some broader intervals of epithermal crackle brecciation intersected Most veins are mildly anomalous in gold, silver and the epithermal pathfinder elements arsenic and antimony Frequency of veining and intensity of epithermal alteration increases to the south into an area covered by post- mineralization rocks Drilling to continue in 2022 once new access tracks are constructed to reach the more remote and steep southern area of the target Initial Interpretations Six diamond drill holes totalling 5,387m were completed at Barbasco TerraSpec data, sericite:chlorite ratios (sericite generally indicates closer proximity to the fluid ‘source’ than chlorite).
- 13. Drill Program Now Focused on Puente-Princesa Target 13 Two rigs currently turning A significant shear structure has been intersected at depth along the Santiago Fm (FDN host) and the Zamora batholith Contains epithermal silica-illite alteration and some quartz- carbonate-sulphide veining within mixed sediment and andesite Initial assay results from Puente-Princesa expected in the first quarter of 2022 Puente-Princesa Two holes completed and two in progress The original 3,000m drill program at Puente- Princesa has been expanded to 5,000m
- 14. 5 Year Sustainability Strategy 14 Climate Change Community Infrastructure Community Well-being Environmental Stewardship Health & Safety Human Rights Lasting Economic Opportunities Responsible Resource Governance
- 15. A Leading ESG Offering 15 • The Environmental Stewardship Program implements industry best practices for water management, waste and tailings management, and emissions reductions while protecting biodiversity. • Adopting TCFD recommendations and incorporating climate-related risk into disclosures. Environment Guidelines and Associations • 1,766 direct jobs as of August 2021 (Zamora Chinchipe: 51% / Rest of Ecuador: 39%). • The Company spent $23M on local procurement in the Zamora Chinchipe Province in 2020. $393M was spent in Ecuador. • Between 2015 and 2020, Lundin Gold invested $20M in domestic economy strengthening projects. Social • Lundin Gold is committed to maintaining a high standard of corporate governance that fosters accountability, ethical behavior, and transparent disclosure. • 15% female representation in the workforce / +50% director independence / 30% female director representation. • Recently published 2020 Sustainability Report, available on www.lundingold.com Governance
- 16. 16 Estamos Conectados Connectivity Project Completed in October 2021 Lundin Gold is appreciative of the numerous partners who have committed to supporting this connectivity project through the Lundin Foundation, including: 1,370 tablets distributed to students in the Los Encuentros parish as well as several other rural communities close to Fruta del Norte Fibre optic infrastructure has been installed to provide improved internet service to the local communities Internet service has been improved for local schools in the area
- 17. 17 Since assuming office in May, reconciliation and vaccinations have earned Guillermo Lasso a +70% approval rating Lasso Off to a Strong Start AUG Established the Executive Decree Nº 151 that contains the Mining Policy for Ecuador. The Decree lays out an action plan and timeframe that has a primary objective of developing an efficient, environmentally and socially responsible mining industry in Ecuador. SEPT Ecuador and the IMF reach agreement resulting in $1.5 billion in new disbursements this year MAY Guillermo Lasso inaugurated as the 47th President of Ecuador SEPT Guillermo Lasso announces his economic bill named Creating Opportunities SEPT Achieved goal of vaccinating 9 million of Ecuador’s 17.7 million citizens against COVID-19 in his first 100 days in office
- 18. 18 Mining Playing an Important Part in Ecuadorian Economic Growth Mineral Resources now represent one of Ecuador’s top five exports $810 million1 Total exports generated by mining sector in Ecuador during 2020 $430 million1 Taxes paid in 2020 by mining companies in Ecuador $374 million1 Direct foreign investment for Ecuador during 2020 The Zamora Chinchipe economy can benefit as a direct result of Fruta del Norte 8.5x Projected growth of Yantzaza’s economy over the next 7 years $160 million Local fiscal resources over the LOM (vs. 2018 Yantzaza budget of $10m) $1 billion LOM royalties and taxes expected to be paid $626 million Lundin Gold domestic purchases (2017 – 2020) $3.6 - 5.7 billion FDN contribution to Ecuador’s GDP over LOM 1. Source: Bloomberg Lundin Gold will contribute to Ecuador’s economy for years to come
- 19. Corporate Structure 19 1. Data presented on slide as at November 08, 2021 Symbol TSX: LUG / OMX: LUG Share price (CAD/sh) 11.44 52 Week Trading Range 9.11/12.93 Shares Outstanding 233.1 M Market Capitalization C$2,696 M Cash Position US$221.8 M LT Debt US$516.9 M BMO Capital Markets Outperform, $16.00 CIBC World Markets Outperform, $15.00 Cormark Securities Buy, $15.00 Desjardins Securities Hold, $13.75 Haywood Securities Buy, $14.00 National Bank of Canada Perform, $13.50 Scotiabank Outperform, $14.50 Stifel GMP Buy, $15.50 SpareBank 1 Markets Buy, SEK 100 / CAD $15.00 TD Securities Buy, $15.50 TSX: LUG / OMX: LUG 59% 5% 23% 13% Strategic Management Institutional Retail CAPITAL MARKETS DATA ANALYST COVERAGE SHAREHOLDERS
- 20. Lundin Gold – Value Creation Opportunities 2021 production estimated between 380,000 - 420,000 oz based on an average head grade of 10.4 g/t Au Initial results from underground resource expansion drill program Results from the regional exploration drill program at the Puente-Princesa target and 2022 exploration program Announcement of short and longer-term guidance 20 Operational Excellence Reserve Growth Throughput Expansion Exploration 2021/2022 Catalysts
- 21. Contact information: Finlay Heppenstall Director, Investor Relations finlay.heppenstall@lundingold.com +1 604-806-3089 www.lundingold.com Lundin Gold @LundinGold / LundinGoldEC Lundin Gold Ecuador Lundin Gold Thank You
- 22. Appendix
- 23. Non-Executive Board of Directors, Management and Operations Team 23 Lukas Lundin Carmel Daniele Ian Gibbs Chantal Gosselin Ashley Heppenstall Paul McRae Craig Jones Bob Thiele Gillian Davidson Chairman Director Director Director Director Director Director Director Director Ron F. Hochstein Alessandro Bitelli Sheila Colman Nathan Monash David Dicaire Iliana Rodriguez Chester See President, CEO & Director EVP, CFO VP, Legal and Corporate Secretary VP, Business Sustainability VP, Projects VP, Human Resources VP, Finance Doug Moore Juan Carlos Contreras Murray Wright Guy Bédard Mine Manager Mill Manager Supply Chain Manager General Manager
- 24. Third Quarter of 2021 Financial Highlights 24 1. Please refer to the Company's MD&A for the third quarter of 2021 for an explanation of non-IFRS measures used (Tables are expressed in $’000, except share and per share amounts, or unless otherwise stated) Three Months ended September 30, 2021 Three Months ended September 30, 2020 Nine Months ended September 30, 2021 Net revenues 190,753 118,904 546,889 Income from mining operations 89,431 62,751 264,066 Earnings before interest, taxes, depreciation, and amortization1 112,832 58,030 352,475 Adjusted earnings before interest, taxes, depreciation, and amortization1 113,468 76,040 327,187 Net income 56,673 27,780 192,637 Free cash flow1 47,114 (4,295) 193,689 Average realized gold price ($/oz sold)1 1,769 1,986 1,770 Cash operating cost ($/oz sold)1 650 632 635 All-in sustaining costs ($/oz sold)1 804 728 778 Free cash flow per share1 0.20 (0.02) 0.84 Adjusted net earnings1 58,796 45,790 171,005 Adjusted net earnings per share1 0.25 0.20 0.74
- 25. 0 200 400 600 800 1000 1200 1400 1600 1800 2000 0 10 20 30 40 50 60 70 80 90 100 All-In Sustaining Cost (US$/oz) Percentage (%) of Global Production Lundin Gold in the Lower Quartile of the Global Gold AISC Curve1 YTD 2021 AISC ($’000, unless otherwise stated)3 Cash operating costs 202,307 Corporate social responsibility 931 Treatment and refining charges 25,551 Accretion of restoration prevision 80 Sustaining capital 27,332 Silver by product credit (8,259) All-in sustaining costs (“AISC”) 247,924 Gold oz sold 318,822 AISC per oz sold $778 25 Gold Price ~$1,829/oz2 1. SNL Metals and Mining, public company filings 2. Spot gold as at November 08, 2021 3. Please refer to the Company's MD&A for the third quarter of 2021 for an explanation of non-IFRS measures used
- 26. Free Cash Flow1 26 1. Please refer to the Company's MD&A for the third quarter of 2021 for an explanation of non-IFRS measures used (Tables are expressed in $’000, except share and per share amounts, or unless otherwise stated) Three Months ended September 30, 2021 Nine Months ended September 30, 2021 Net cash provided by operating activities 92,658 309,746 Net cash used for investing activities (24,715) (54,323) Interest paid (20,829) (61,734) Free cash flow 47,114 193,689 Basic weighted average shares outstanding 232,723,880 231,831,680 Free cash flow per share1 0.20 0.84
- 27. Probable Mineral Reserves of 5.24 Moz of Gold at 8.03 g/t1 27 Result of converting a portion of Drift and Fill mineable orebody sections to Long Hole Stoping, due to good ground conditions experienced in the mine December 31, 2019 2020 Reserve2 Processed in Remainder of 20203 December 31, 20204 Mt 17.6 20.8 0.6 20.3 Au (g/t) 8.74 8.1 9.84 8.03 Au (Moz) 4.99 5.41 0.18 5.24 Ag (g/t) 12.1 11.8 12.04 11.45 Ag (Moz) 6.92 7.68 0.22 7.46 1. See slide 37 for information regarding the assumptions, parameters and risks associated with the FY2020 reconciliation, along with other disclosure in accordance with NI-43-101 2. As at July 31, 2020 These changes have also resulted in a slight increase to dilution and decrease in average grade Mineral Resources estimates at Fruta del Norte were not affected 3. Corresponds to mill feed from August 1, 2020 to December 31, 2020 4. See the Company’s Annual Information Form dated March 2, 2021, available under the Company’s profile at www.sedar.com.
- 28. Fruta del Norte one of the few Multi-Million Ounce, High-Grade Gold Assets in Production1 28 1. Source: S&P Global Market Intelligence Metals and Mining, company reports, Lundin Gold Annual Information Form dated March 2, 2021 Producers with gold reserves > 4 million ounces
- 29. 29 km of Underground Mine Development Completed1 29 2,148 km developed during the third quarter. Rates averaged 23.3 m per day. 1. As at September 30, 2021
- 31. Responsible Mining 31 Lundin Gold Inc is committed to responsible mining, and therefore operates our facilities according to 3 fundamental principles: working safely, environmental stewardship, and respect in each of our activities We seek to create enduring relationships with local communities and stakeholders and to address social challenges that are priorities both for communities and for the business through partnerships, and in doing so, help create value for a range of stakeholders. Mining Is a Catalyst for Sustainable Business Development Local Hiring Local Procurement Impact Investing 90% of Lundin Gold’s workforce is from Ecuador1: − 51% from the province − 39% rest of Ecuador − 10% foreign personnel 1. As at July 2021 2. January 2017 – November 2020 Spent ~$88 million on goods and services in the in the province2. During development, over 300 Ecuadorian suppliers provided: − Construction materials − Transportation − Site support services − Food and other perishables Lundin Gold and the Lundin Foundation work with local enterprises to increase economic diversification: − Takataii: agricultural development program focused on producing and selling of short cycle agricultural products supplies multiple vendors − Nexo, Conexión Empresarial: education program that strengthens the skills of local micro-entrepreneurs so that they can access new business opportunities https://lundingold.com/site/assets/files/16806/sustainability_report_2019_september.pdf -
- 32. Impact Investing to Deal with COVID-19 In 2021, Lundin Gold continued to invest in local development with a wide range of partners Focus has been on direct COVID-19 response and mitigating its impacts on local communities 32
- 33. 33 Zamora River Bridge Now Fully Operational Inaugurated during the second quarter and is now being used to access site Will reduce transportation costs Enables a more efficient route for trucks and vehicles to come in and out of Fruta del Norte
- 34. Newcrest Financing Package and Senior Debt Facility 34 Gold Pre-Pay and Stream Finance Package Gold Prepay Credit Facility of US$150 million, repayable in 19 fixed quarterly principal and interest instalments equivalent to the value of 9,775 oz gold (raising to 11,500 oz and 13,225 if the gold price is less than $1,436 and less than $1,062, respectively) based on spot at time of payment starting December 2020 and ending 2025. − First payment made under the gold prepay in December 2020. Stream Credit Agreement of US$150 million, repayable in variable monthly principal and interest instalments equivalent to the delivery of 7.75% gold production and 100% silver production, based on spot at time of payment less US$400/ounce Au and US$4.00/ounce Ag, up to a maximum of 350,000 oz of gold and 6 million oz of silver. − Payments commenced upon achievement of Commercial Production in February 2020 − Option to buy back 50% of the stream in June 2024 and 50% in June 2026 Offtake agreement for up to 2.5 million ounces refined gold Senior Debt Facility $350 million from lenders syndicate − 7 lenders and 1 export credit agency − Tranche A: US$250 million senior commercial facility. − Tranche B: US$100 million senior covered facility under a raw material guarantee provided export credit agency. − Term: eight and half years, maturing in June 2026. − Annual interest: 3 or 6 month LIBOR plus an average margin of approx. 5.05% (Tranche A) and 2.50% (tranche B) over the term. Fully drawn at end of 2019. Repayable in variable quarterly instalments starting at the end of 2020 and maturing in June 2026. First payment made in December 2020
- 35. Government Agreements The Company has all the major agreements and permits with the Government of Ecuador in place 35 The Exploitation Agreement The Investment Protection Agreement • The Exploitation Agreement sets out the rights and obligations of the Government of Ecuador and Aurelian as mining concessionaire with respect to the Project and incorporates: • Term: affords the mining concessionaire the right to develop and produce gold from the Project for 25 years • Fiscal Terms: describing royalties, windfall tax and sovereign adjustment mechanisms • Security: acknowledges the financing requirements and provides the ability and authorisation to grant security • Enforcement: provides acknowledgement that the Lenders are entitled to foreclose without authorisation from the mining concessionaire or the Government of Ecuador • Dispute Resolution Procedures: arbitration under UNICTRAL rules (in Santiago, Chile) • The Investment Protection Agreement primarily deals with tax and mining regulatory stabilisation and other investment protection mechanisms. Key benefits include: • Income tax rate fixed at 22% • Exemption from the capital outflow tax of 5% on payments of principal and interest to financial institutions outside of Ecuador • The ability to obtain benefits granted by the Government of Ecuador through future investment protection agreements with other investors in similar projects in Ecuador • No restrictions to transfer or assign all or part of the investment, including the right to assign its rights to any financing parties • Other benefits granted to Aurelian include no restriction to: • produce and sell minerals; • import and export goods; and • establish, maintain, control, or transfer funds abroad, provided statutory remittances and obligations have been met Both the Exploitation Agreement and the Investment Protection Agreement were signed in December 2016
- 36. Mineral Resources NI 43-101 Mineral Resources - Mineral Resources, inclusive of Mineral Reserves as at December 15, 2015 36 Category Tonnage (M t) Grade (g/t Au) Contained Metal (M oz Au) Grade (g/t Ag) Tonnage (M oz Ag) Indicated 23.8 9.61 7.35 12.9 9.89 Inferred 11.6 5.69 2.13 10.8 4.05 Notes: 1. The Qualified Person for the estimate is Mr. David Ross, P.Geo., an employee of RPA. The estimate has an effective date of 31 December, 2015. 2. Mineral Resources are reported inclusive of Mineral Reserves; Mineral Resources that are not Mineral Reserves do not have demonstrated economic viability. 3. Mineral Resources are reported at a cut-off grade of 3.5 g/t Au; which was calculated using a long term gold price of US$1,500/oz. 4. Mineral Resources are constrained within underground mineable shapes that assume a minimum thickness of 2 m; metallurgical recovery of 94%; total operating costs of US$145/t milled (mining cost of US$60/t milled; process costs of US$35/t milled; G&A costs of US$15/t milled; surface infrastructure costs of US$28/t milled; concentrate transport and treatment costs of US$7/t milled); royalties of US$71/oz and selling costs of US$65/oz. 5. Numbers may not add due to rounding. 6. For information with respect to the key assumptions, parameters and risks associated with the results of the Technical Report for the Project, the Mineral Resource and Mineral Reserve estimates included therein and other technical information, please refer to the Technical Report. 1. The 2020 Reserve has been estimated in accordance with CIM Standards and NI 43-101. The 2020 Reserve is as at July 31, 2020 and reflects mill feed from January 1, 2020 to July 31, 2020. 2. Additional information on Mineral Resource and Mineral Reserve estimates for Fruta del Norte is contained in the in the Technical Report which is available under the Company's profile on SEDAR. Except as set out below, the assumptions, parameters and risks associated with the Company's Mineral Resource and Mineral Reserve estimates set out herein are as set out in the Technical Report. 3. All Mineral Reserves presented are Probable Mineral Reserves. No Proven Mineral Reserves were estimated. 4. Mineral Reserves were estimated using key inputs listed in the top right table. 5. Gold cut-off grades for the different mining methods are listed in the bottom right table. 6. Silver was not considered in the calculation of the cut-off grade. 7. Tonnages are rounded to the nearest 1,000 t, gold grades are rounded to two decimal places, and silver grades are rounded to one decimal place. Tonnage and grade measurements are in metric units; contained gold and silver are reported as thousands of troy ounces. 8. Rounding as required by reporting guidelines may result in summation differences. Notes to Probable Mineral Reserve Update Key Input December 31, 2019 2020 Reserve December 31, 2020 Unit Gold Price 1,250 1,400 1,400 $/oz TS 48 47 47 $/t D&F 81 69 69 $/t Process, Surface Ops, G&A 58 57 57 $/t Dilution Factor 10 8 8 Percent Concentrate Transport & Treatment 68 92 92 $/oz Royalty 71 77 77 $/oz Gold Metallurgical Recovery 91.7 91.7 91.7 Percent Gold Cut-off Grade December 31, 2019 2020 Reserve December 31, 2020 Unit Transverse Stope 3.8 3.8 3.8 g/t Drift and Fill 5.0 4.4 4.4 g/t
- 37. Lundin Gold @LundinGold / LundinGoldEC Lundin Gold Ecuador Lundin Gold