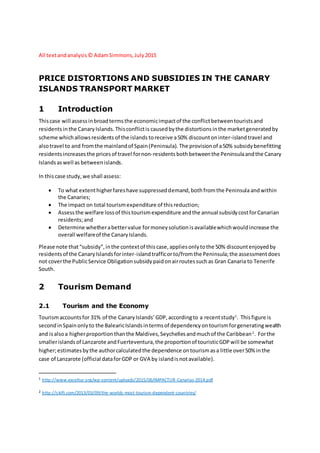
2. 2.2 Foreign Tourists
Foreigntouristarrivalsinthe CanaryIslandshave shownconsistentgrowth,withthe exceptionof
Fuerteventura,whichwitnessanincrease muchhigherthanthe otherislands,andLaPalma,which
sufferedasharpdecline.Touristvolumesforthe twoyearsare displayedin Figure 1.
Figure 1: Foreign Tourists by Island, 2007 and 2014
Tourists 2007 Tourists 2014 Change 2007-
2014
Fuerteventura 1,012,948 1,749,743 72.7%
Gran Canaria 2,509,602 2,879,485 14.7%
Lanzarote 1,582,043 2,013,044 27.2%
La Palma 162,096 124,200 -23.4%
Tenerife 2,997,660 3,749,630 25.1%
TOTAL Foreign 8,264,349 10,516,102 27.2%
2.3 Peninsula Tourists
The picture for Peninsulatouristsisthe diametricoppositeof thatforforeignvisitors,withall islands
showingasignificantdecline indemandbetween2007 and2014 – see Figure 2.
Figure 2: Peninsula and Total Tourists by Island, 2007 and 2014
Tourists 2007 Tourists 2014 Change 2007-
2014
Fuerteventura 121,266 102,470 -15.5%
Gran Canaria 513,748 390,862 -23.9%
Lanzarote 341,581 256,235 -25.0%
La Palma 81,691 44,274 -45.8%
Tenerife 837,187 521,247 -37.7%
TOTAL
Peninsula
1,897,238 1,421,364 -25.1%
All Nationalities 10,161,587 11,937,466 17.5%
Source:EGATUR
Note:FRONTUR data, whichis the primarysource for analysing tourismdemand, is onlyavailable fromSeptember 2009.
However, to check that the order of magnitude of the change is correct, we can examine air transport statistics, which
provide a 100% sample of all passenger movements throughthe airports inthe CanaryIslands archipelago.
In 2007, 3.89 millionsingle trips were recorded(tourist numbers are in effect returntrips) whilst in2014, the same data
showedthat there were 2.98 million passengers in2014. This represents a fall of 23.6% andsois reasonablyconsistent
with the EGATUR data.
The tablesabove showa stark contrastbetweenthe demandforCanaryIslandtripsforeignand
Peninsulatourists.
If we examine the dataovertime,we have twoverydifferenttrendsapparentinthe data.
3. Figure 3: Tourism Demand over Time
Foreigntouristvolumes droppedsignificantlyin2009 but have beenonan upwardtrendsince.By
contrast,Peninsulatouristshave continuedtodropsteadilysince 2007, withthe exceptionof 2010.
3 Spanish Leisure Trips Abroad
To assesswhetherthe fall inPeninsula-Canariestrafficisattributable toeconomicfactorsspecificto
Spain,we will examine acontrol group,whichisleisure tripsundertakenbySpaniardstoforeign
countries.Forthe purposesof ouranalysis,tripstothe Canary Islandscan be consideredasforeign,
as these require atwoto three hourflightandso are differentincharacterto domestictourism
undertakenwithinthe Peninsula.3
Spanishtouriststravellingabroadhave increasedsomewhatwhenwe compare 2007 to 2014 in
Figure 4. In contrastto the dropof 25% witnessedfortourismbetweenthe Peninsulaandthe Canary
Islands,foreigntripsabroadforleisure purposeshave shownahealthyincrease overthe seven
years. The increase infriendsandfamilytrafficseemsratherhigh,but thiscouldbe attributableto
largernumbersof foreignresidentsvisitingtheirhome country.
Figure 4: Spanish Leisure Trips Abroad
2007 2014 Change
Friends and Family
2,388,481 3,431,828 43.7%
Holidays
6,118,027 6,262,284 2.4%
TOTAL
8,506,508 9,694,112 14.0%
Source:Instituto de TurismoEspaña (IET)
However,evenif we take the lowfigure of 2.4%,thisstill comparesfavourablywiththe 25% dropin
trafficon Canarianroutes.
3 In 2014, 9% of domestic trips were undertaken byair comparedto 61% of foreigntrips (source: IET)
4. 4 Peninsula-Canarias Air Traffic
4.1 Fares
AirEuropa and IberiaExpressdominate flightsbetweenTenerife,GranCanariaand the Peninsula.
IberiaExpressinparticularhasa policyof a highminimumflooronflightstoandfromthe Canary
Islands,asexemplifiedbythe examplebelow,inFigure 5,of faresfromTenerife.
Figure 5: Minimum Single Fares from Tenerife (€)
Source:Skyscanner, July16th, 2015 (RYR – Ryanair;AE – Air Europa;IB– Iberia;IBE – IberiaExpress)
PeninsulademandshowsasignificantpeakduringJulyandAugust,yetthere isnoreductioninfares
duringa lowmonthsuch as November.Bycontrast,RyanairandVuelingvaryfaressignificantly,
accordingto demand. AirEuropa has similarminimumfaresontheirwebsite butthese farescanbe
undercutusinga comparisonsite suchas Skyscanner.
The IberiaExpresspolicyof fixedfaresdoesnotapplytoroutesof similardistance,such asMadrid-
Edinburgh;onthe Scottishroute,there isa significantdifference inminimumfaresbetweenthe
summerpeakandquieterperiods.Thisfixedfare policyyieldsperverseprices,withthe lowestfares
to London(roughly60% longerthanthe distance of TF-MAD) oftenbeingcheaperthaneitherIberia
Expressor AirEuropa.
The full service operatorsmaintainthispolicy,atleastontheirownwebsites,evenwhentheyforma
dominantduopoly(GranCanaria,Tenerife) orwhentheywouldbe expectedtobe a price follower,
as inthe case of Lanzarote,where Ryanairisthe dominantoperatortothe Peninsula.
Figure 6 showsthe numberof flightstoand fromthe Peninsulabyairlinefor2014.
Figure 6: Flights in 2014 by Island to and from the Peninsula
Gran Canaria Tenerife Lanzarote Fuerteventura
Vueling 3,418 2,999 971 453
Air Europa 3,054 6,123 1,324 354
Ryanair 2,456 2,786 2,187 814
Iberia Group 4,316 4,238 960 898
LCC share 2014 44% 36% 58% 50%
5. RYR share 2014 19% 17% 40% 32%
LCC Share 2007 38% 40% 36% 36%
Source:AENA Statistics (http://www.aena.es/csee/Satellite?pagename=Estadisticas/Home)
4.2 Load Factor
For the purposesof the above analysis,Spanair routestothe CanaryIslandswere designatedas“low
cost” for 2007 operations,alongwithFutura,Ryanair,easyJetandClickair. Ryanairhasbeen
highlightedinparticularinthe table above asitsfaresare generallythe lowestavailable per
kilometre andoftenlessthe half the price of the nextcheapestoperator.
Whilstitisnot possible todetermine profitabilitybyroute,itisfeasible todetermine loadfactorsfor
all the keyplayersonPeninsulaflights,astheyall use asingle type of aircraft (the exceptionbeing
AirEuropa).
In Figure 7, we presentfourfiguresperairline:
Total,whichisall of IberiaExpress’business(IEonlyoperatesto,fromorwithinSpain),most
of Vueling’sandRyanair’soperationsto,fromandwithinSpainonly;
International,includingall flightsbetweenanypartof Spain(includingthe Canaries) and
foreigncountries;
National,whichcomprisesall domesticroutesincludingthe CanaryIslands;and
Canaries,whichonlyshowsflightsbetweenthe CanaryIslandsandthe Peninsula.
Figure 7: 2014 Load Factors by Airline
What shouldbe immediatelyapparentfrom Figure 7isthat flightsbetweenthe Canariesandthe
Peninsulaenjoyasignificantlyhigherloadfactorthanairlines’otheroperations.WhilstRyanairdoes
not appearto be takingadvantage of this state of affairsto offerhigherprices(see Figure 5),the
same cannot be saidin particularof IberiaExpressandAirEuropa. Itis thisrent-seekingbehaviour
that has presumablyencouragedNorwegiantoenterthe Peninsula-CanariesmarketfromOctober
2015.4
4 http://www.travelweekly.co.uk/Articles/2015/07/10/55877/norwegian-to-start-canaries-flights-from-mainland-
spain.html
6. 5 Inter-Island Traffic
Inter-islandtrafficwasroughly7.4milliontripsin2007 and 6.8 millionin2014, a drop of 8.5% in
sevenyears. There,is,however,averywide variationof growthbetweenindividual flows.
One significantflow whichhasbeenomittedfromfurtherdiscussion isLanzarote (Orzola)toLa
Graciosa,an islandwithapopulationof around300 people immediatelytothe northof Lanzarote.In
2014, there were some 332,000 tripson thisroute but figuresfor2007 are not available.
Figure 8: Inter Island Traffic: Major Flows
Sources:AENA data, Puertos de Tenerife, Puertos Canarios
A reductionof 8.5% needstobe placedinthe contextof changesto GDP andtourismvolumesover
the same period.Thisdata ispresented in
8. Figure 9: Changes in Real GDPand Tourist Volumes
Change 2007 to
2014
Real GDP
-6.4%
Tourist Volumes + 17.5%
On thisbasis,we can inferthatdemandperformance forinter-islandtransporthasbeenparticularly
weak;usingan elasticityof 0.7, forexample, we wouldexpecttosee a reductionindemandof
around4.5% andthat is before consideringthe significantincreaseintourismvolumes.
If we lookat individual flows,we cansee thatthere hasbeena wide variationindemandchanges.
The changesin the six busiestroutesare presentedin Figure 10.
Figure 10: Top Six Flows DemandChanges, All Modes
Route
Shortest
Distance (km)
Change 2007-
2014
La Gomera-Tenerife 38 -3.2%
Gran Canaria-Tenerife 68 -15.3%
Lanzarote-Fuerteventura 14 +8.5%
Fuerteventura-Gran Canaria 115 +7.6%
La Palma-Tenerife 139 -15.0%
Lanzarote-Gran Canaria 208 -11.6%
In absolute terms,Lanzarote-Fuerteventuraprovidesthe cheapesttripfortourists(€23 return) and
demandhasbeenshowingasteadyincrease.Thisroute isthe onlyone inthe Canary Islandswith
three ferrycompaniescompeting.
La Gomera’spopulationfell by7%between2007 and2014 and so a reductionof just3% impliesan
increase intouristvolumesbetweenLaGomeraand Tenerife (recall thatdemandwithrespectto
populationhas anelasticityof 1).There are five tosix dailysailingseachwaybetweenLaGomera
and Tenerife,whichisquite ahighfrequencytoserve apopulationof justover20,000, sotourists
are likelytoplayasignificantrole indemandonthisroute.The cheapestreturnfare fornon-
residentsis€685
.
Figure 11: Propensity of Tourists to “Island Hop”
Population Tourist Main
Destination
Tourists
Secondary
Destination
Fuerteventura 106,930 1,990,842 97,438
La Gomera 20,721 87,732 96,723
Gran Canaria 851,157 3,579.940 51,972
El Hierro 10,675 4,924 15,518
Lanzarote 141,940 2,399,667 243,776
La Palma 83,456 150,550 147,340
5 As seeninJuly2015
9. Tenerife 889,936 4,772,587 223,476
TOTAL 2,104,815 9,409,882 876,243
Source:FRONTUR
The table above showsthatlessthan 10% of touristswhovisitedthe CanaryIslandsin2014 visited
more than one island. Thisfigure isconsistentwithEGATURdata,whichshowed89% of touristsdid
not visitanyotherisland.In2007, EGATUR recorded16% of touristswhovisitedatleastone other
island,sothe situationhasdeterioratedoverthe lastsevenyears.
6 Inter-Island Air Fares
6.1 Types of Route
Airrouteswithinthe Canariescanbe classifiedintothree types:
Longerroutes(> 170km) betweenLanzarote andTenerife/GranCanaria,Fuerteventurato
Gran Canaria and La Palmato Gran Canaria;
Shorterroutes,includingTenerife toGranCanaria,La Palmato Tenerife andFuerteventura
to Gran Canaria; and
Noncommercial routeswhichare subjecttodirectsubsidy(knownasaPublicService
Obligation),includingroutesfromEl Hierroand La Gomera. These are notdiscussedfurther.
The distinctionisimportantbecause,inthissection,we will benchmarkinter-islandairfaresagainst
routeswitha similardistance flownbyRyanairbetweenthe Peninsulaandthe Balearicislands.
In
10. Figure 12 below,we presenttwointer-islandairfaresandbenchmarkthese againstflightsover
similardistancesoperatedbyRyanairtoIbizaand Mallorca.
6.2 Fares on Longer Routes
The faresshownin the firsthalf of
11. Figure 12 are lowseasonfarestothe BalearicIslandsand bookable three monthsinadvance,whilst
the secondtable showspricesatthe heightof the peakjustfourweeksinadvance.
Lanzarote – Tenerife North(TFN) isamonopolyoperatedbyBinterwhereasthe route toLasPalmas
has competitionfromasmalleroperator,CanaryFly;thisexplainsinpartthe lowercostper
kilometre of the shorterinter-islandroute.
12. Figure 12: Canarian and Balearic Air Fares
Source:Companywebsites (Binter, CanaryFly, Ryanair) andSkyscanner
What isnot immediatelyexplainableisthe verywide discrepancyinfaresatothertimesof the year,
withthe Ryanairfaresat lessthan half the level of the cheapestCanarianones.Evenif abagis paid
for withthe Ryanairflight,the costperkilometre issignificantlybelowthatof Canarianflights(which
include aluggage allowance inthe price).
6.3 Airport Charges
To enable afair comparisonof the flightslistedin
13. Figure 12, we also needtoconsiderairportcharges.The twocharges whichare of interesthere are
the landingfees(baseduponanaircraft’smaximumtakeoff weight)andfeesperdeparting
passenger.
In 2015, these chargeswere significantlylowerforinter-islandflightsthanfordomesticroutesto
and fromthe Peninsula6
. ForaBoeing737-800, as operatedbyRyanair,andassuming170 seats
occupied,the approximatedifference airportchargesperpassengerwas€4 underthe 2015 tariff,or
2 centsperkilometre fora200km trip.Therefore,the anomalyinticketpricesperkilometreis
actuallyhigherthan
6 http://www.aena.es/csee/ccurl/861/788/Guia%20tarifas%20aena%20aeropuertos%202015%20ingles_ed%20marzo.pdf
14. Figure 12 suggests.
6.4 Fares on Shorter Routes
Below,we cansee the fareson the two mostpopularshorterroutes,betweenTenerifeandLa Palma
and Gran Canaria (LPA).
Figure 13: Fares on Shorter Routes
Thisfigure providessome supportforthe monopolypricingargumentinthe previoussection;please
note howthe fare perkm, incents,betweenLaPalmaandTenerife islowerforCanaryFlyandonly
slightlyhigherforBinter,eventhoughthe route istwice aslongas Lanzarote-Tenerife.
AlthoughBinterhasanair monopolyonthe Tenerife-GranCanariaroute,airtravel betweenthe two
largestislandsaccountsforonlyone thirdof total demand.In
15. Figure 14, we compare the ferryfareswhich,incertaincases,are onlyslightlybelowthe equivalent
air fare.
16. Figure 14: Ferry Fares Tenerife-Gran Canaria
Source:FredOlsen, Armas websites
Inter-islandferryfaresare discussedinfurtherdetail inthe nextsection.
7 Inter-Island Ferry Fares
The chart belowprovidesmid-seasonreturn (October2015) faresfor a foot passenger.Any
discountsattributable toresidentshave beenexcludedfromthe comparison.
Note:fares research was undertakeninJuly2015
In the chart above,inter-islandCanarianfaresare showninred,the yellowpointsrepresentother
ferryroutesinSpainand the blue pointsare elsewhere inthe world(UK,France,Italy,Maltaand
Australia). The chartprovidesevidence that,ingeneral,the priceschargedbyCanarianferry
operatorsare somewhathigher forsimilardistances thaninothercountries.
17. 8 Operators in the Canaries
8.1 Airlines
There are three majorand twominoroperatorsplyingroutesinthe CanaryIslands.BinterCanariasis
the dominantairoperatorand provideslinksbetweenall the minorislandsandTenerife,Gran
Canariaor both.Itsflagshiproute hastraditionallybeen betweenGranCanariaandTenerife with14
flightsperweekdayeachwayinsummer2015. Interms,of frequency,thisroute ismatchedbyLa
Palma-Tenerife(14perweekday) followedbyLanzarote-GranCanaria(13) andFuerteventura-Gran
Canaria(11).
A secondoperator,CanaryFly(CF) commencedoperationsinlate 2013, effectivelyreplacingIslas
AirwayswhichwentbankruptinOctober2012. Asof summer2015, CF effectivelycompetedwith
Binteronjust tworoutes:La Palma-Tenerife (4perweekday) andLanzarote –Gran Canaria(3). CF
stoppedservingFuerteventuraearlyin2015. CF also fliesbetweenGranCanariaandTenerife but
onlythree timesperweek,soitsmarketshare isnegligible.
Therefore,the three topairroutesall have a combinedfrequencyof roughly16-18 flightsperday
each way.
8.2 Ferries
The two dominantferrycompaniesare more evenlymatchedintermsof frequencybutwiththe
exceptionof Tenerife-GranCanaria(the twoferrycompaniesuse differentportsinGran Canariaand
so theirsharescan be quantified),itisdifficulttosaywhichone dominates intermsof demand.
Unlike Binter,the ferriesgenerallyoperate anetworkwithinthe individual provincesof Tenerife
(Tenerife,LaPalma,El Hierro, La Gomera) and Las Palmas(GranCanaria, Fuerteventura,Lanzarote)
and betweenthe twolarge islands,butnototherwise betweenthe provinces.
A summaryof the majorroutesisshown inFigure 15 below,alongwithairshareswhere
appropriate.
Figure 15: Market Shares by Route
Route
Operators Mode/Operator Shares in
2014
La Gomera-Tenerife FO, AR Ferry (98%)
Gran Canaria-Tenerife
BI, FO, AR Air (33%), FO (43%), AR
(24%)
Lanzarote-Fuerteventura FO, AR, LR Ferry (100%)
Fuerteventura-Gran Canaria
BI, FO, AR Ferry (58%), BI (39%), CF
(3%)
La Palma-Tenerife
BI, CF, FO, AR Ferry (31%), BI (61%), CF
(8%)
Lanzarote-Gran Canaria BI, CF, AR AR (17%), BI (76%), CF(7%)
BI :Binter Canarias; CF:CanaryFly;FO:FredOlsen ExpressFerries;AR:Armas Ferries;LR:Lineas RomeroFerries
18. 8.3 Spotlight on Fuerteventura to Gran Canaria
Lookingback at Figure 8, itis noteworthythatthe route betweenFuerteventuraandGran Canaria
has buckedthe trendandshowna significantincrease indemand.Thissectionhighlightstotal
demandandmodal splitindetail between2011 and April 2015.
In 2007, demandon the route was almost900,000 passengersperannumandby the endof 2012,
demandhad fallentoaround770,000 annually.Since the endof 2012, however,demandhas
increasedmarkedly,byaround25% injust twoyears.
The impact of the 2012 changes(particularlythe improvementonthe ferryservice) isevidencedby
the steadyincrease inoverall demandduring2013 andthe switchinferry’srole frombeingthe
minorto the dominantmode.
In Figure 16, we have highlightedeventsoverthe lastthree years thathave influenceddemandon
the Fuerteventura-GranCanariaroute.
Figure 16: Events of the FUE-GCRoute
Action Date Results
Fred Olsen introduces promotional
fares
June-12 Shift to ferry, demand
increase
FO introduces fast ferry August-12 Reduced ferry journey time,
shift to ferry
Islas Airways goes bankrupt October-12 Demand constant, shift to
ferry
FO doubles frequency December-
12
Generalised journey time by
ferry declines, greater
capacity on route, overall
demand increases
Canary Fly (CF) inaugurates
Fuerteventura-Gran Canaria flights
Late 2013 Air traffic increases but
ferry traffic has doubled in a
year
CF pulls out of FUE-GC route February
2015
No discernible change to
date in total market size or
air’s market share
The impact of the 2012 changes(particularlythe improvementsonthe ferry service) is evidencedby
the steadyincrease inoverall demandduring2013 andthe switchinferryfrombeingthe minorto
the dominantmode.
20. Figure 17: Demand by Mode on Fuerteventura-Gran Canaria
9 Subsidies to Residents
9.1 Inter-Island Air Trips
We sawin section [] thatinter-islandtraffichadnotgrownparticularlystronglycomparedtoGDP.
Also,whencomparedtogrowthin tourismof nearly16% insevenyears,demandforinter-island
transporthas beenparticularlyweak.Recallthatnon-residentsof the islandspaydoublecompared
to residentsof the Canaries.
To highlightthe lowincidence of touristtripsoninter-islandtravel,we canexamine the numberof
inter-islandairtripssubsidisedforthe latestthree yearsforwhichdataisavailable.The resultsof
thisexercise are shownin Figure 18.
.
21. Figure 18: Total and Subsidized Air Trips
Sources:AENA data, ISTAC(for volume of subsidisedpassengers)
Please note thatthe subsidieswere those paidinagivenyearratherthanthe numberof trips
actuallysubsidisedinthe yearof travel.There were delaysinpaymentfor2011 travellersandthe
arrears were presumablypaidin2012, explainingthe veryhighfigureof 98%.Therefore,the average
figure of 83% for the three years(or five tripsoutof everysix) beingmade byresidentsisprobablya
bestestimate.The average subsidypaidoverthe three yearswas€76 million.
A seconddistortionimpedinginter-islandtravel isalegal barriertoentry.The two incumbent
airlinesare legallyprotectedfromcompetitionand,asa result,faresare somewhathigherinthe
Canariesthanon routesof similarlengthelsewhereinSpain.
We sawin
22. Figure 12 that passengersable toflyfromBarcelonaorValenciatothe Balearic Islandspaywell
underhalf perkm comparedto Canarianpassengers oversimilardistances.The Canariansystemis
particularlyinefficientasthe average loadisbarelyover40 passengersperflightcomparedto71-77
on the smallerValencia-Ibizamarket.Itisalsointerestingtonote that,althoughthe Barcelona-
Majorca market ismore than double the size of Lanzarote-LasPalmas,the numberof flightsper
annumis nomore than 20% higher. So,overall ,the cost peravailable seat-kmonthe Canarian
route is somewhathigherbecause smalleraircraft(68seats) are usedthroughout.
By contrast, we can compare the cheapestfaresbetweenLanzarote (forexample) andMadrid,
whichismore than seventimesasfaras Gran Canaria.In October2015, the cheapestone-waynon-
residentfare onBinterwas€49.60, whilstasingle fare (alsonon-resident) with Ryanairwasavailable
for €43 on several days,includingone dayat€297
.
Demandon the Balearicroutesismuchhigherinsummerthan winter(bycontrast,Canaryinter-
islandtransporthasrelativelylittleseasonality) andsofaresduringthe summerpeak toand from
the BalearicIslandsare almoston a par withCanarianfares.
Figure 19 showsthe difference inseasonalitybetweentrafficbetweenthe Peninsulaandthe
BalearicIslandsandinter-islandCanariantrafficforbothmodes.The seasonal variationforBalearic
islandtrafficisnearlydouble thatof Canariandemand.
Figure 19: Seasonality of Demand January 2011 – April 2015
Sources:ISTAC, Iberstat CAIB, Aena, Puertos Canarios, Puertos de Tenerife
7 Fare searches were undertaken onJuly13th, 2015
23. As we have mentionedpreviously, service provisionwithahigherlevel of seasonalityismore
expensive,particularlyforimmovable infrastructure,whichneedstorecoveritscostsovera shorter
part of the year.
9.2 Air Trips to/from the Peninsula
As mightbe expected,giventhe distanceinvolved,subsidiesonPeninsulaairfaresconsume the
highestamountof money.
Since 2012, total trafficfell furtherin2013 and2014, but wasshowing signsof growthin2015. So,
trafficinthe currentyearis runningat roughly2012 levels.
9.3 Ferry Trips
Data on ferrysubsidiesissomewhathardertocome by,so we needtomake some estimates.The
bestestimate isthatferrysubsidiesforresidentsare reportedlyrunningatapproximately€60
millionperannum8
.The figure underthe “441M” program(see the footnote) combinessubsidiesfor
the Balearicand CanaryIslandsas well asCeutaand Melilla.Giventhe populationsanddistances
involved,we expectthatmostof this subsidyisspentonthe Canariannetwork.The subsidy
programme,includingthatforair fares,istherefore costinginexcessof €300 millionperannum.
9.4 Summary of Subsidies
Piecingtogetherthe availableevidence,the subsidiestotalledaround€266 milliononaverage for
the period2010-2012.
Total annual expenditure bythe Canariangovernmentwasaround€6.7 billionin2014 and a similar
amountis projectedfor2015. By contrast,the bill forsubsidisingCanarianresidents’transportcosts
iscurrentlybudgetedat €300 million,ora little under5% of the regional government’sexpenditure.
Please note,however,thatthe subsidiescome fromcentral governmentratherthanthe regional
one.
8
http://www.sepg.pap.minhap.gob.es/Presup/PGE2015Ley/MaestroDocumentos/PGE-
ROM/doc/1/3/14/2/3/N_15_E_R_31_117_1_1_3_1.PDF
24. 10 Tourism Expenditure Losses
10.1 Quantified Costs – Peninsula Tourists
We will nowassessthe extentof tourismexpenditureinthe CanaryIslandsattributabletothe drop
inPeninsula-Canariestraffic.
There are twobenchmarkswhichwe can use forthisexercise:
The volume of foreigntouristsvisitingthe Canary Islands;or
The volume of Spanishtouriststravellingabroadonleisure trips.
We will use the secondof these benchmarksasthe growthinSpaniardstravellingabroad(14%) is
somewhatlowerthanthe increase inforeigntouristsholidayinginthe Canaries (25%).So,our
estimate canbe perceivedasconservative.
Tourismincome isgeneratedbythree factors whichcanbe describedasthe tripodof tourism
income,asexpenditure bytouristsinaholidaydestinationdependsonall three factors:
The volume of tourismarrivals;
The average lengthof stay pertourist;and
The dailyexpenditure of eachtouristforeachday thattheyare on holiday.
The table belowrequiressome explanation.The “Emisor”columnshowsthe annual numberof
Spaniardstravellingabroadforthe purposesof a holidayorvisitingfamilyandfriends.The datahas
beensmoothedfromthe original datasetasitwas subjecttounexplainedjumpsbetweenvarious
years.“Peninsula”isthe numberof touristsaged16 or olderas recordedbyEGATUR tothe Canary
Islandsand“Penisula2”isthe numberwhichwouldbe expectedif the trajectoryof touriststothe
Canary Islandshasbeensimilartothe numberof Spaniardstravellingabroad.The difference
betweenthe actual andexpectedtouristvolumesisshowninthe “LostTourists”column.
Figure 20: Lost Expenditure from Peninsula Tourists
Sources:ISTAC, author’s calculations
The revenue lostisthe productof these losttourists,theiraverage stayandaverage daily
expenditure asrecordedbyEGATUR. To putthese figuresintocontext,EGATURestimatedtotal
tourismexpenditureinthe CanaryIslandsat€4.22 billionin2014.
25. 10.2 Wider Economic Benefits
We have seenfrompreviouschaptersthattourismexpenditureisbasedon the three factorsof
arrivals,average lengthof stayandaverage dailyexpenditure.We have alsoseenthatlessthan10%
of all touristarrivalsvisittwoormore islands.
Data is notavailable onwhethertouristswhovisitmore islandsspendlongerinthe CanaryIslands,
but itis notunreasonable toassume thattheydo.
So,letus nowpose the followingquestion.Of the 10.5 milliontouristswhovisitedthe Canary
Islandsin2014, what if 1 millionof themspentanextradayon holidayasa resultof visitinganother
island(assumingthatfareswere loweredfromtheircurrentlevel)?
If we workon an assumptionof €40 pertouristperday for incidentals(food,drink,local transport,
touristsites) etc.,these extraguestnightswouldgenerate anextra€40 millionperannumor1% of
actual tourismincome.
We notedinparagraph 5 that there were around6.8 millionone waystripsoninter-islandroutesin
2014. Therefore,the impactof 1 millionextratouristsundertakingareturninter-islandtripwould
increase demandbyaround30%. It isunlikelythatthe increase wouldbe evenlyspread,however,
and wouldbe focusedonshorterrouteswithmore tourismappeal,suchasTenerife-LaGomeraand
Fuerteventura–Lanzarote/Gran Canaria.
Widereconomicbenefitsalsoinclude whatisknownasa multipliereffect.If,forexample,youspend
€100 ina store and the ownermakes40% profit,the ownerwill thenhave extradisposable income.
Let usassume,forexample,thatthisownersaveshalf of hisorher profitandspends€20 elsewhere.
Thiscycle continuesuntil the sumsbecome negligible. Ateachstage,the sumavailable is20% of the
value of the previousstage).
Usingthe figuresinthe above example,the initialexpenditureof €100 becomes100*/ (1-0.2) which
is€125.
Althoughwe will notattempttocalculate the multipliereffecthere, itisimportanttobe aware of its
existence.
11 Alternative Uses for Funds
11.1 What Funds are Available?
We have seenfrompreviouschaptersthatthere isalossof around€600 millionperannumof which
half isgovernmentexpenditure onsubsidiesandthe remainderismoneynotinjectedintothe
Canarianeconomy.Inthissection,we will be verycautiousandassume thatonly€300 millionis
available tobe spentelsewhere.
11.2 Change from Unlimited Subsidy per Person
There isno limitonthe amountof subsidythat an individual receivesforinter-islandtravel ortrips
to and fromthe Peninsula.There isalsosufficientevidence thatwealthierpeople travel more andso
26. we endup inthe perverse situationthatthe subsidiesflow more topeople withahigherpropensity
to travel.The perversityisamplifiedbythe factthat the full subsidyisavailabletobusinessclass
faresas well aseconomy.
There isno data available onthe frequencyof subsidisedtravelandthere are certainlycasesfor
whicha subsidymightbe appropriate forfrequenttravel,(manybusinessestreatLanzarote and
Fuerteventuraasone market,giventhe twoislands’proximity) butthere remainsacase for
assessingthe necessityof subsidiesforfrequenttravellers.
That said,the advantage of the current,unlimitedsystemisthatitis notoverlybureaucraticandthe
subsidyisnowadaysappliedautomaticallyviaadatabase whichchecksresidents’eligibilityforthe
discount. Anotheradvantage of the systemof subsidisingtravellersisthatthe consumerreceives
100% of the benefitof the subsidy.
11.3 Abolition of Subsidy
If the hypothesisproposedearlieriscorrect,namelythatthe resident’sdiscountincreasesthe
normal fare,one optionisto remove the subsidyentirely.
The argumentfor subsidies isreducedsomewhatif average faresdecline.InNovember2015,
Norwegian,anewcarrierscheduledtostartPeninsula-CanariesoperationsinOctober2015, is
offeringfaresataroundone quarterof the IberiaExpressprice.IE’scostsperavailable seat
kilometre werebroadlyinlinewithVuelingandeasyJetin2012 but above Ryanair’s.9
So,there isan
argumentthat farescouldbe reducedbyallowingthe markettoworkand forflightstoand fromthe
Peninsulamarkettooperate ona fullycommercial,market-drivenbasis.
Evenduringperiodsof lowdemand - Novemberwasthe weakestmonthin2014 - the airlines’load
factors heldupand,infact, bothRyanair andVuelinghadabove average loadfactorsforPeninsula
routesduringthe month.So,a furtherargumentagainstsubsidiesiswhyrouteswithseveral
hundredthousandpassengersperannumandoperatedbymodern,efficientjetaircraftneed
subsidiesinthe firstplace.Thisisparticularlytrue forflightsbetweenthe CanaryIslandsandMadrid
or Barcelona. Similarargumentsapplytointer-islandtraffic.
9 http://centreforaviation.com/analysis/iberia-a-new-hammer-can-crack-an-old-nut-but-sometimes-the-new-ones-taste-
better-109589