More Related Content Similar to CapstoneResearchProposal Similar to CapstoneResearchProposal (6) 4.
4
I. PROBLEM STATEMENT
As the population in Boone County, Missouri increases and adds additional strain on
roads and bridges, funding for county transportation infrastructure lags. Since 2011, Boone
County’s population has been growing at around 1.5% annually and is projected to continue the
same trend for at least the next decade (American Fact Finder, 2015). This growth, which is
concentrated primarily in and around the City of Columbia, is creating stress on existing county
infrastructure. Besides putting strain on existing infrastructure, new housing developments
adjacent to the city also require the construction and servicing of new roads. This increased
demand may lead to additional challenges for road and bridge maintenance, public safety, the
environment, and future transportation investments for Boone County public services.
In the twentyfirst century, America faces complex challenges in sustaining
transportation infrastructure on national, regional, and local levels of government. Counties are
responsible for building and maintaining 45% of public roads and 230,690 bridges, which
translates into a third of the nation’s transit systems (Istrate, Mak, & Nowakwski, 2014).
According to the National Association of Counties (NACo) (2014), “the U.S. transportation
system is the ‘circulatory’ system of the U.S. economy that requires a cohesive resolution for a
strengthening economic recovery on the ground” (p. 5). Because county governments make up a
third of this “circulatory” system, they play a critical role. However, this role is undermined by
many challenges. The combination of federal budget cuts, the recent economic recession, and the
widespread use of fixed gasoline taxes for state and federal highway funding contribute to a
growing gap in county transportation funds (Istrate, Mak, & Nowakwski, 2014). Consequently,
federal and state funding for county transportation projects is increasingly inadequate. Also,
5.
5
county governments, including Boone County, face the dilemma of rising transportation project
costs, increasing traffic volumes, and limitations on their ability to generate revenue. In
response, our capstone team examines these challenges, assesses what they mean for Boone
County, explores relevant literature, and evaluates several policy alternatives.
II. BACKGROUND
Boone County is located in central Missouri. It is the eighth largest county in Missouri
and contains the state’s fifth largest town, Columbia. The United States Census Bureau (2014)
estimates the county population at 170,773 for 2013. An important characteristic of Boone
County is that the county seat, Columbia, contains a majority of the population with 115,276
residents, the other 32.5% of residents live throughout the rural county areas. Within the city of
Columbia is the University of Missouri, resulting in a unique county composition with a single
dominant metro area which also holds a very large public university.
Boone County government is comprised of a threemember elected commission
responsible for passing budgets and countywide policies; Presiding Commissioner Daniel
Atwill, Commissioner Karen Miller, and Commissioner Janet Thompson are the three elected
County Commission members. Boone County is also responsible for managing more than 800
miles of roads and bridges, the costs of which are retained within their budget’s Road & Bridge
Fund. This fund is composed of “restricted revenues including a property tax, a onehalf cent
sales tax, the County’s portion of the gasoline tax, and other similar revenues. These revenues
may only be used for road and bridge maintenance and improvements” (Atwill, Miller,
Thompson, & Pitchford, 2014, p.52). At one point, the Commission made the promise of paving
6.
6
every county gravel road to garner support for a sales tax increase, but this fund is only capable
of maintaining current infrastructure. Besides proving problematic for paving gravel roads,
current funding’s shortcomings have also led to difficulties for the county in meeting growing
demand for road maintenance.
The traditional mechanisms for financing the development and management of county
transportation infrastructure, as well as the increasing costs associated with such infrastructure,
are inadequate. In 2014, Boone County spent roughly $19 million on transportation infrastructure
through its Road and Bridge Fund (Atwill, Miller, Thompson, & Pitchford, 2014), a growing
majority of which has been sufficient only for “modest maintenance” of existing infrastructure
(D. Atwill, personal communication, December 17, 2014). This fund has seen a steady increase
in expenditures without a proportional growth in all aspects of county road development, with a
majority dedicated to “Pavement Preservation” and “Maintenance” (see Road & Bridge Graphs
in Appendix C for more detail). Also, according to NACo, “the cost of construction and
materials increased by 44% between 2000 and 2013, more than the 35% rise in the overall rate of
inflation” (Istrate, Mak, & Nowakwski, 2014, p. 3). The estimated 1.5% annual population
growth will be another source of transportation challenges, and Boone County must be proactive
in their infrastructural developments to best accommodate these increased strains. With state
transportation dollars decreasing and local money for transportation infrastructure barely able to
keep up with the status quo, maintaining current infrastructure while trying to build more
infrastructure to meet the needs of a growing population is a major challenge for Boone County.
To understand how this infrastructure funding problem will be addressed at the county
level, the traditional mechanisms used by Boone County for generating revenue must be
7.
7
examined. The first major source of revenue for the county Road & Bridge Fund are property
taxes, which brought in $1,389,220 in 2014approximately 7.2% of their Road & Bridge Fund.
This tax comprises a relatively small portion of revenues, even as the assessed valuation of real
estate continues to grow between two and four percent each year, with total assessments valuing
just over $2.5 billion. The current rates of taxation are $0.12 per $100 assessed property value
for “General Fund Operations” and $0.05 per $100 assessed property value for “Road & Bridge
Operations” (Atwill, Miller, Thompson, & Pitchford, 2014).
The sales tax contributes the most to the county’s total revenue, drawing approximately
$13,805,000, or 72.3%, of total infrastructure funds. While this has been a consistently strong
contributor, it represents a regressive tax system, which is very volatile and dependent upon the
economic conditions of the time. Economic downturns like the recession of 2009, which greatly
reduced sales tax revenues, continue to make it difficult for the county to make large, longterm
plans. While this sales tax is received by the county as a whole, the funds are parsed out to the
county’s specific operations by a fraction of each cent collected (Atwill, Miller, Thompson, &
Pitchford, 2014).
Intergovernmental revenues (state/federal support) is the third source of funding for
Boone County, and comprises 7.47% (or $1,426,300) of this fund (Atwill, Miller, Thompson, &
Pitchford, 2014). This funding largely comes from state and federal grants and appropriations.
Missouri designates a portion of their state gasoline tax to their counties. This rate of taxation is
not determined by the counties and has remained stagnant for the past few decades. While
intergovernmental revenues represent an ongoing source of funding, the amount provided can
fluctuate for ongoing operations or onetime projects and improvements.
8.
8
The final major revenue source comes from the county’s service charges, which is largely
comprised of real estate recording fees, commissions on paid property tax bills, and other sales
proceedings. These charges amount to $399,770 or 2.1%, of the Road & Bridge Fund (Atwill,
Miller, Thompson, & Pitchford, 2014). This resource can be altered to an extent, but must not be
heavily relied upon for revenue.
Infrastructure funding challenges are not unique to Boone County. Cities, counties, and
states are struggling with this infrastructure crisis throughout the U.S. In 2005, the American
Society of Civil Engineers estimated that $1.6 trillion were needed to upgrade the U.S.
infrastructural system (Flowers, 2014). Now, the estimate is $3.6 trillion to upgrade our
infrastructure by 2020, and the Congressional Budget Office estimates that the highway trust
fund will face a shortfall of $120 billion by 2024 (Infrastructure: Going their separate ways,
2014). Compared globally, U.S. infrastructure is ranked 19th by the World Economic Forum
(Pagano & Perry, 2008). During the early years of the Great Recession, many politicians and
governmental leaders advocated an alternative to the proposed (and passed) economic stimulus
package. Instead of focusing on individuals, it was said more could be done by targeting
infrastructure projects. However, federal transportation funding for state and local governments
remains and is becoming increasingly inadequate.
In Boone County, federal and state funding for county roads only accounted for 7.4% of
the Road and Bridge Fund (Atwill, Miller, Thompson, & Pitchford, 2014). Other counties have
adopted additional funding mechanisms, but they still are not sufficient to cover all of the needs
of their businesses and residents (Istrate, Mak, & Nowakwski, 2014, p 3). There are latent
opportunities for Boone County to reduce transportation funding gaps by tapping into
9.
9
underutilized resources with similar institutions or using unique approaches to service delivery.
Barring a federalstatecounty partnership solution, any new mechanism will just be part of a
piecemeal approach for the overall network of roads and bridges.
III. LITERATURE REVIEW
Boone County’s current infrastructure funding mechanisms represent some of the most
commonly used tools available to local governments in the U.S. However, there are other
alternative mechanisms that local governments may use. The following explores some other
funding mechanisms used by other counties, and works to firmly ground the problem in the
history of general county infrastructure funding in the U.S. These mechanisms are divided into
two groups: institutional arrangements and funding mechanisms. Institutional arrangements will
explore different types of organizational arrangements that can facilitate more efficient collection
and use of funds. The funding mechanisms will outline some of the most common, as well as the
most promising, ways that local governments fund their infrastructure.
Institutional Arrangements
i. Intergovernmental Cooperation
Different methods of intergovernmental cooperation can be beneficial to all governments
involved, especially governments that face similar problems. One example is interlocal planning,
which is the process by which local governments organize their services, developments, and
vision for their programming in a cohesive manner with relevant stakeholders and municipalities.
Boivard et al. (2007) suggest utilizing service assessments to value and prioritize the services
and operations undertaken by local governments to guide collaborative strategic planning. By
reviewing the programs used by their citizens, each party is able to provide input and support of
10.
10
a specific operation, thereby defining the roles of each government for future development. Parr
et al. (2006) build on this by suggesting that governments are able to more effectively balance
growth through the construction of regionalized committees composed of those affected by
similar economic forces or infrastructural systems. Interlocal planning ensures that all local
governments understand how those in the surrounding area are handling the needs of their
community.
Network facilitation is another form of intergovernmental cooperation. When counties
retained their own supervisory boards to represent different areas of need for the county and
determine where to direct services, dialogue between public stakeholders occurred more
naturally. Network facilitation is a method of hosting dialogues in the absence of a formal
council or public arena to debate and consider the goals undertaken by different governing
bodies (CRC, 2008). While counties are not able to provide the power these supervisors once
had, supervisors are the prime candidates for orchestrating conferences, summits, and forums to
receive guidance from those most knowledgeable about the areas of most concern.
Powers development is a third form of intergovernmental cooperation where each
municipality seeks to improve the services or abilities of their jurisdiction, while conceding a
degree of power. For example, a “contract for services” arises when one jurisdiction is allowed
to grow and provide their services (ex: law enforcement, fire safety) for another municipality at
an agreed rate. “Joint service agreements” are planned, financed, and provided by both parties to
all jurisdictions and combine departments or agencies to cover a larger geographical area.
However, this arrangement increases dependence on larger municipalities. Finally, “mutual aid
agreements” are basic contracts that outline the circumstances, methods, and extent to which
11.
11
each jurisdiction will support the other in the event of emergencies. Aside from the value of
providing basic tangible services and powers, intergovernmental collaboration establishes a
culture of cooperation for future interaction and growth in the region (2006).
ii. CityCounty Government
Combining county and city governments is another strategy that has been undertaken to
consolidate services and save money. This occurs most often in counties where there is one
major metropolitan city that is overwhelmingly the center, both economically and politically, of
the county. Potential benefits include reduced costs, increased efficiency, and better planning.
Reduced costs come mostly from combining police and firefighting services, unifying health and
human services, and reducing personnel. The negatives associated with consolidating separate
forms of government include reduced morale, harming the local economy through fulltime
employer reduction, and creating ineffective services through poor integration (Durning, 1995).
Durning (1995) analyzed the effects on employees from the governmental merger of the
city of Athens and Clarke County in Georgia. However, he points out an important aspect of this
field of research: governmental mergers between cities and counties are not wellstudied.
Proponents and opponents often discuss their positions in qualitative terms, and robust
quantitative backing is lacking. The focus is usually on employee perception regarding the
merger, and in Clarke County, the perception was overall more negative than the general
population. Conjoining the governments led to multiple layoffs which led to a reduced morale
within the workforce. There was a concern about how long the transition lasts, highlighting that
many would feel their jobs are not secure until the new institution layout has calcified.
12.
12
While the longterm cost savings had yet to be seen, employees were troubled by the
more immediate costs of transitioning and the overlap of required staff services. Overhead and
other administrative costs did not immediately decline as expected either, since the process
required extra monetary resources to find the most effective way to conduct the needed changes.
The transition also required a retooling of schedules. Each government entity had different pay
periods, different accounting methods, and different agency philosophies. The police
departments highlight this issue: the county government had the “law enforcement” philosophy
while the city’s approach was the “service” philosophy. Philosophical issues must be taken into
account and dealt with when determining what retraining is necessary across governmental
agencies.
Carr and Feiock (2004) also point out the issues surrounding citycounty merger case
studies. While other forms of governmental mergers, such as councilmanager governments,
have a large population of governments to study, most case study analyses have used no more
than three or four citycouncil mergers to study the results. Also, a large portion of these studies
have focused on the actual transition from one form of government to the other, but not the
effects of such a transition. When merged, there was a noticeable increase of institutional inertia,
wherein governmental procedures became more calcified and less responsive to groups outside
of the political structure. While these combined governments became less affected by politicians
and political outsiders, they were less influenced by citizen groups. Further, there is discussion
that it may lead to greater efficiency overall, but response can be noticeably reduced for citizens.
Therefore, it is possible that citizens view resources as being directed more towards the dominant
city at the cost to the other citizens of the county.
13.
13
Funding Mechanisms
i. Taxation
Taxes are the primary method by which counties and other local government bodies have
traditionally funded their infrastructure. In the 19th and early 20th century, cities funded almost
all of their operations, including infrastructure, with property taxes collected from citizens. As
the twentieth century progressed, income taxes, sales taxes, and gross receipts slowly began to
supplant local governments’ reliance on property taxes. Since the 1970s, funding has trended
away from taxes in general and more towards user fees and charges (Pagano & Perry, 2008).
Today, most counties in the United States supplement federal and state road funds with locally
raised revenues that take a variety of tax and nontax forms. The tax forms that counties most
frequently use include personal property taxes (especially for personal vehicles), local option
sales taxes, local gas taxes, as well as all the previously mentioned taxes (ex. property tax)
(Istrate, Mak, & Nowakwski, 2014).
The state gas tax is one of the major funding sources for the majority of U.S. counties.
However, the increase of fuelefficient cars and a lack of adjustment for inflation has eroded the
revenue raised by gas taxes. Currently, 36 states rely on fixed rate gas taxes (ex. 18 cents per
gallon), which are not adjusted for inflation and which do not allow for increased revenues as gas
prices increase. Additionally, the majority of states have not raised their gas taxes in over a
decade, resulting in a decrease of the gas tax’s real revenue value over time. Twelve states allow
counties to collect a local option gas tax. However, even these are usually limited to a maximum
rate and “often involve additional approvals for implementation” (Istrate, Mak, & Nowakwski,
2014, p.21) such as local referendums that require voter approval. With gas tax revenue
14.
14
increasingly unstable, many counties are attempting to move away from gas tax reliance in
funding roads and bridges (Istrate, Mak, & Nowakwski, 2014).
Other innovative taxes have also been implemented in some locales to address the
twentyfirst century’s unique taxation challenges. Commuter taxes, for example, are taxes levied
against persons who work, but do not live, in a particular location. Commuter taxes have been
implemented by some “employment center” cities whose daytime populations swell with
nonresidents who use municipal infrastructure but do not pay municipal property taxes (Maciag,
2014). The types of cities most likely to consider, and benefit from, commuter taxes are
declining cities with wealthier suburbs, and cities with relatively small land area (Maciag, 2014).
While commuter taxes implemented in Ohio and Kentucky have brought in an astonishing
amount of additional revenue (Cleveland reportedly received as much as $210 million from
commuter taxes alone), commuter taxes are also controversial (Pagano & Perry, 2008). New
York City implemented a commuter tax over a decade ago but it was eventually allowed to
expire, with opponents saying that commuter taxes incentivize businesses to relocate outside of
cities. Studies done in Detroit have not shown similar results, however (Maciag, 2014). Despite
some controversy, more and more local governments are looking at commuter taxes as a possible
option for addressing their revenue challenges.
In essence, commuter taxes are just a specific form of regional tax base sharing which has
been in use by some local governments since the 1970s. Regional tax base sharing is intended to
“reduce metropolitan area fiscal disparities and reduce the competition by local governments for
new development, thereby increasing the efficiency of metropolitan area land use and reducing
horizontal inequities” (Reschovsky, 1980, p.57). In Minnesota, the first state to implement a tax
15.
15
base sharing program, horizontal tax base disparities were greatly reduced between local
governments around Minneapolis and St. Paul (Reschovsky, 1980). As can be expected, there is
also controversy surrounding this form of taxation, as one local government always inevitably
has more to gain than the other, prompting opponents to accuse this policy of “robbing the
suburbs to pay for the city” (Kurtz, 2012). However, as citizens become increasingly tax averse,
and technological innovations like fuelefficient vehicles and online shopping reduce the tax
base, many counties are trying to find new nontax options to increase revenue for infrastructure.
ii. Bonds
Bonds are the other traditional funding mechanisms often used by local governments. A
bond is a debt security where the bond issuer contractually promises to pay the creditor the bond
amount and interest. This is a way for governments, along with private companies and
organizations, to raise specific amounts of money and elongate the payout rate across a
predictable timeline. By raising this money, local governments can fund longterm infrastructure
projects. Public entities in the United States usually issue bonds through bond measures, which
are voted upon by the general public and allow the public entity to issue bonds to raise a certain
amount of money. Municipal bonds have traditionally been used to gather financial resources for
infrastructure projects like roads and bridges. The most common types of bonds are general
obligation bonds, revenue bonds, and assessment bonds. General obligation bonds are backed by
the full faith and credit of the issuing government. Revenue bonds promise repayment from a
stream of revenue from a defined activity, such as user fees. Assessment bonds are backed by
property tax collections (Office of Economic Policy, 2014).
16.
16
The United States is unique in its prevalent use of municipal bonds. It is also important to
note that the large municipal bond market has often persuaded governments not to seek out
public private partnerships (PPP) or private equity in the past. The large market of municipal
bonds has often been a very safe and reliable market. Interest from these bonds are often tax
exempt on some level, usually from federal income tax. Currently, most infrastructure projects
are funded in part through revenue bonds. These bonds are backed by user fees, such as tolls for
roads (Office of Economic Policy, 2014).
Current tax laws do provide a barrier from utilizing both municipal bonds and private
equity or partnership. The tax exempt municipal bonds are not allowed to be used to fund
projects in which private equity ownership plays a role (Office of Economic Policy, 2014).
The Obama Administration has proposed creating a new type of municipal bond that
helps bridge the gap between traditional municipal bonds and the need to utilize private
partnerships. These proposed new bonds, called the Qualified Public Infrastructure Bonds, would
combine the tax benefits of public municipal bonds, have no issuance caps (unlike private
bonds), and would have overall fewer restrictions than private activity bonds. These types of
bonds would be useful for longterm leasing by governments to private organizations that would
either run or administer the infrastructure itself (Watts, Jagoda 2015).
iii. Fee Revenues
There has been a trend by state and city governments toward funding infrastructure
development with user fees and other charges, and away from the traditional use of property
taxes. Early on, most infrastructure development was financed through general obligation debts.
After market panics of the 1880s, state constitutions and laws placed limits on the general
17.
17
obligation bonds that could be utilized by local governments. These limits were usually
percentages of property values available for taxation in the jurisdiction of the local government.
While general obligation bonds were characteristically backed by the full faith and credit of the
local government, newer bonds were utilized post1880s to maneuver around limits on general
obligation debts. Bonds such as special assessment bonds, which derive payback revenue from
specific tax streams and are not backed by full faith and credit of the local government, came
into favor. The Great Depression of the 1930s again caused a disruption in the use of
infrastructure funding. Because a substantial amount of property owners were unable to pay their
property taxes, a substantial amount of special assessment bonds went into default. Revenue
bonds took hold after the 1930s. Unlike general obligation debts and special assessment bonds
(which are paid back through taxation), revenue bonds rely upon revenues generated through
operations, much like user fees (Pagano & Perry, 2008, p.2325).
Because of the restrictions placed upon bonds, a move towards increased user fees also
occurred across municipalities. These fees are charged to users of services to gain a revenue
stream that can be reinvested back into the government’s coffers. One of the most common
examples are highway tolls collected by states. This funding is used to reinvest, maintain, and
improve road infrastructure. Charging user fees is becoming substantially more popular as a way
to both reduce deficits and compensate for falling infrastructure funding from governments
(Sayeh, 2014). In general, if it is a government service being provided that does not deal with
lifeordeath scenarios, there is an opportunity for a government to charge a service fee.
iv. Transportation Development Districts (TDD)
18.
18
Transportation Development Districts (TDD) are a transportation project development
tool, governed by state statute, which is available for use by registered voters, local communities
and property owners (Missouri Dept of Transportation, 2015). TDDs serve to fund, promote,
plan, design, construct, maintain or operate one or more “projects” or to assist in such activity.
These projects may include:
● Street, highway, road, interchange, intersection, bridge, traffic signal light or signage;
● Bus stop, terminal, station, wharf, dock, rest area or shelter;
● Airport, river, or lake port, railroad, light rail or other mass transit and any similar or
related improvement or infrastructure (MO Dept of Economic Development, 2015).
A TDD is a political subdivision designed to facilitate specific public transportation
improvements through the collection of taxes and the borrowing of funds. A TDD has a
geographic jurisdiction that is created and voted on by “qualified voters,” which is then approved
by the circuit court (MO Dept of Transportation, 2015). As of 2010, 166 TDDs were established
in Missouri, with a reported total estimated transportation project costs of over $1.6 billion and a
reported total anticipated revenues of over $2 billion (Missouri State Auditor, 2015).
The revenue of a TDD can only be used for public transportation and
transportationrelated improvements. In Missouri, TDD can impose a sales tax in increments of
1/8% up to 1%. TDD sales taxes have historically been collected by the district or local
authority. House Bill 191 amended section 238.235, RSMo to require the Department of
Revenue to begin collecting sales taxes imposed by TDDs. While the legislation is effective
August 28, 2009, the statute includes a provision that the collection of taxes by the Department
19.
19
are effective on the first day of the second calendar quarter after the Department receives
notification from the district. Based on district notifications, the Department will first begin
collecting a transportation development district’s tax for tax periods beginning January 1, 2010
(MO Dept of Revenue, 2015). Appendix B contains more technical details about using TDDs in
Missouri.
v. County Infrastructure Banks
The idea of County Infrastructure Banks comes from the procedures of most state
Department of Transportation infrastructure banks, where a portion of the state’s funding for
infrastructure is pooled and administered through lowinterest loans and credit assistance
programming. Pennsylvania’s Dauphin County was the first county to develop this idea, though
some large cities have also used this approach. Instead of dispersing their portion of the state’s
gas tax to their municipalities, county leaders choose to pool their resources, and loan out to
municipalities or private developers for infrastructure projects, withholding a portion of the
approved municipality’s gas tax or other revenue sources as repayment. Dauphin County has also
been using this to invite public and private partnerships by incentivizing private firms with lower
repayment rates and faster development (DCIB, 2014).
The Dauphin County Infrastructure Bank has some basic requirements for funding
applications. First, the funds can only cover specific parts of the preconstruction/construction of
the project usually tied to the physical development. Second, the maximum amount of time for
repayment is ten years, with a set rate for developers and another for public entities, both of
which must be met with a letter of approval from the affected municipality, a loan guarantee, and
an indication of the tax allocation or relevant repayment source. Finally, while the physical work
20.
20
is conducted by the recipient or their chosen developer, the county will oversee each step of
development to assure program adherence (DCIB, 2014).
In order to select projects, the county allows for two ‘funding rounds’ each year with
application deadlines to receive funding by a set date. Once a project is formally submitted to the
county, there is a credit analysis provided by an internal or consultant team, which is then
reviewed with the potential borrower by a committee of economic development, auditory, and
county leaders. After this meeting, a final draft is submitted for approval to the Board of
Commissioners and the final decision is made. This process is key as the county must be very
meticulous in their review of the application (DCIB, 2014).
At the beginning of the program, Dauphin County had roughly $2 million in the bank,
yet anticipates around $30 million in program funding after a decade of support and utilization
by local municipalities (DCIB, 2014). According to the 2014 Boone County Budget,
approximately $2.5 million is currently being dispersed to municipalities as “Sales Tax
Distributions” and would be a similar source utilized by the DCIB to initiate their program, while
current resources for road maintenance and expansion projects would see their funding
unaffected.
IV. DATA & METHODS
This analysis used the secondary data collected from the existing literature on
infrastructure funding, as well as primary data collected from interviews with government
officials from counties with similar characteristics and funding challenges as Boone County.
22.
22
of the main municipality, specific infrastructure budgeting constraints (if any), as well as any
problems the county has had with funding infrastructure under a growing population. Any
counties that varied drastically from Boone County in more than one of these aspects were
considered unfit for the final analysis and were therefore excluded. Secondly, the interview
questions were used to explore the different “realworld” ways in which other counties have
addressed their infrastructural funding needs amid sustained population growth. Comparable
counties are used as case studies for the strategies gathered during the literature review, and
therefore helped inform the more general secondary data.
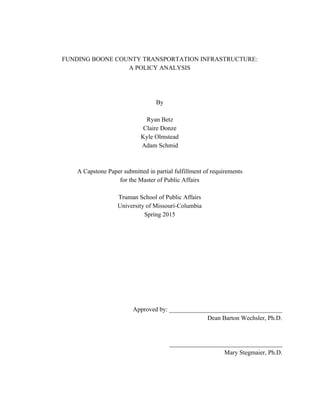
VI. FINDINGS
A total of 9 counties responded to our request for an interview. Table 1 gives basic
demographic descriptives for each of these counties. All of the responding counties were
noncharter counties, and 66.7% were responsible for funding roads and bridges (Graph 1).
Those that were not responsible for roads and bridges were included in the analysis because they
still used interesting funding mechanisms, even though these mechanisms were used to fund
other projects. Real estate taxes were the most common source of revenue for roads and bridges,
followed by state revenue sharing and state gas taxes (Graph 2). State revenue for roads and
bridges varied drastically from 10% to 100% (Graph 3). Of those counties that do provide road
and bridge services, most said that funding their infrastructure was a challenge. Table 2 describes
each county’s perceived biggest challenge for funding their roads and bridges.
Table 1: Descriptives for Counties Interviewed
County, State (micropolitan) Population
(2013 Estimate)
Growth Rate
(April 1, 2010
July 1, 2013)
University
population (of
Land
area (sq
miles)
Total
Infrastructure
Budget
23.
23
total county
population)
Boone, MO (Columbia) 170,773 5% 15.7% 685.41 19,085,348
Lancaster, NE (Lincoln) 297,036 4.1% 6.5% 873.55 9,403,108
Tippecanoe, IN (Lafayette) 172,780 4.3% 17% 499.81 10,527,800
Washtenaw, MI, (Ann Arbor) 117,025 2.7% 24.2% 705.97 20,148,557
Centre, PA (State College) 153,990 0.9% 26% 1,109.92 N/A
Montgomery, VA
(Blacksburg)
96,207 1.9% 25% 387.01 N/A
Fayette, KY (Lexington) 308,428 4.3% 6.95% 283.65 4,352,600
Champaign, IL (Champaign) 204,897 3% 16% 996.27 7,593,588
Johnson, IA (Iowa City) 139,155 6.3% 16% 614.04 9,403,108
Douglas, KS (Lawrence) 114,322 3.2% 24.48% 475 5,931,899
Figure 1:
Figure 2:
25.
25
Tippecanoe, IN
(Lafayette)
Yes The amount of time it takes to plan projects
Washtenaw, MI, (Ann
Arbor)
Yes Getting voter approval for increased taxes to
fund infrastructure
Centre, PA (State
College)
No. Cooperative relationship with
Department of Community and
Economic Development where they
provide money for county’s assistance
with sewers.
Montgomery, VA
(Blacksburg)
Yes Not enough revenue to cover increasing
public demands.
Fayette, KY (Lexington) No. Not required to fund roads and
bridges
Champaign, IL
(Champaign)
No. Very few county roads.
Johnson, IA (Iowa City) Yes Heavier equipment and extreme weather has
increased maintenance needs and therefore
costs.
Douglas, KS (Lawrence) Yes Keeping consistent funding through periods
of no obvious 'distress' to the roads.
V. CRITERIA
The survey data and literature reviews were then used to write a policy analysis to
identify several funding alternatives for Boone County’s infrastructure. Primarily qualitative
methods were used to analyze the collected data. From the literature review and the county
interviews, the most viable funding mechanisms were chosen as possible alternatives for Boone
County. The county interviews served as case studies and examples for the chosen funding
mechanisms. Alternatives were chosen based on four criteria: effectiveness, political feasibility,
efficiency, and equity. Effectiveness is defined as whether or not the alternative has the intended
outcome of funding Boone County’s infrastructural needs amid sustained population growth.
Political feasibility is defined as whether the different political factions will find the alternative
acceptable and amenable to implementation. Efficiency is defined as whether the alternative
26.
26
creates the most benefit for the least amount of resources. This was done by taking potential
barriers to implementation, such as political maneuvering, technical complications, etc., into
account and weighed against the scale of the alternative’s benefits. Equity is defined as whether
the costs and benefits are equally shared across all populations within Boone County.
Specifically, this means making sure that no one municipality bears the burden of the cost. No
one specific alternative will be recommended. Instead, these multiple alternatives will serve as a
starting point for further exploration on the part of Boone County, and will also help inform any
discussions the county may have with the Columbia City Council or other political entity.
VII. POLICY ALTERNATIVES & ANALYSIS
Several common funding mechanisms emerged throughout the literature review and the
county interviews. After analyzing these common mechanisms using the four criteria outlined
above (effectiveness, political feasibility, efficiency, and equity), the following funding
alternatives were found to be the most relevant to Boone County’s particular situation and
challenges. Some of these mechanisms could be adapted by Boone County and implemented to
reduce funding gaps. It is important to recognize that these alternatives are not mutually
exclusive, and can be implemented together or separately.
Alternative A: Intergovernmental Cooperation
The City of Columbia and Boone County face similar problems: decreased funding,
growing populations, aging infrastructure, just to name a few. These shared problems mean that
there is great opportunity for intergovernmental collaboration between the governments to
collectively address these invasive problems. Regardless of the exact form of intergovernmental
27.
27
cooperation (some possibilities of which are presented in the literature review), two basic things
are needed for any framework to be effective: 1) institutionalized cooperation and 2) wide
support for the scope and the goals for their collaboration. The first can be achieved by making
these interactions as significant and routinized as possible. This provides a uniform platform in
which all participants are able to participate and impact the development of their region through
advisory, planning, or evaluative constructs. Secondly, the procedural collaborations which occur
must be approved by the participants, creating an element of buyin or approved method of
communication. In order to receive value from these interactions, both small and large
municipalities should be given equal representation. By working together, the county and cities
can create longterm planning solutions that accounts for the needs of the governmental
stakeholders.
The criticism of this alternative pertains to the degree of effectiveness received from
implementation. Intergovernmental cooperation may lead to better planning and resource usage,
but the total amount of resources saved and redirected is not well known. Aside from this,
intergovernmental cooperation is quite political feasibility, efficient, and equitable.
Alternative B: Boone County Infrastructure Funding Bank
After examining the benefits of consolidating funds for municipalities into a single
revolving loan fund, our team felt a Boone County Infrastructure Bank (BCIB) could be a valid
alternative for the region’s infrastructural challenges. In order to establish this program, Boone
County, after receiving support from their municipalities, would invest their budget’s “Sales Tax
Distribution” ($2,514,800 according to the 2014 Budget) into a revolving loanfund for
infrastructure improvement throughout the county. After composing a board of administrators
28.
28
from each municipality, guidelines for the loan applicants, and interest rates for public/private
developers, this bank would review and approve projects biannually from the board. Selected
recipients are responsible for producing reports on their progression and are held accountable to
the revisions and requests of the BCIB board. Repayment plans are established on a
projecttoproject basis and funding for municipalities are withheld from a portion of their sales
tax distribution or similarly stable source of funding.
This alternative has the potential to provide a sustainable, longterm funding solution for
Boone County while simultaneously creating intergovernmental cooperation, and utilizing
present revenue resources. It should be stressed that this program is aimed at maintaining the
health of the county for decades, and immediate results will be diminished. Overall, this
alternative would be very effective at addressing Boone County’s funding challenges by giving
financial support for needed projects without placing a large burden on taxpayers. It is fairly
efficient, as funding is administered directly to the most organized and pertinent projects, but it
does cost municipalities more in the longterm. Unfortunately, this alternative is not particularly
equitable, as larger municipalities inevitably will receive more funding for larger projects and
political feasibility may also potential stumbling block. Establishing this BCIB would be very
challenging from a logistical and administrative perspective, requiring Boone County
government to be responsible for the project, and would also require committed members of each
municipality to remain engaged and cooperative for the benefit of the community. Board
appointments may also prove to be politically contentious, as individual agendas and
uncooperative participants threaten the cohesive administration of the funds. Once these
29.
29
administrative details are established and the cultural norms for funding infrastructure have
shifted, the BCIB would be financially stable and politically manageable.
Alternative C: StateLevel Solutions
Collectively working toward a statelevel solution is another alternative that Boone
County could undertake. Many of the current funding challenges Boone County faces is a direct
result of statelevel laws and policies. Therefore, changing or adjusting those same policies is,
obviously, the most effective way to ameliorate the problems caused by those policies. One of
the statelevel changes that would greatly alleviate Boone County’s funding challenges is a
reformation of the state gas tax. Currently, Missouri’s gas tax is fixed, meaning that it doesn’t
change with the price of gas. A nonfixed tax, indexed for inflation, would bring in additional
revenue whenever gas prices increase, and indexing for inflation would ensure that the tax would
maintain it’s ability to generate revenue over time. Missouri’s gas tax hasn’t been raised since
1994 (Missouri Department of Transportation, 2013), and therefore has long lost it’s ability to
generate adequate revenue. Updating the gas tax to reflect the real value of the 1994 tax in 2015
dollars, changing to a nonfixed tax, and ensuring it is indexed for inflation would generate a
substantial amount of additional state revenue to be allocated to the counties for roads and
bridges.
Iowa recently increased its gas tax by 10 cents per gallon as part of a $215 million annual
funding package for Iowa’s city, county, and state roads. The increase had broad support from
Iowa business groups, farmers, trucking interests, the Iowa State Association of Counties, the
Iowa County Engineers Association, and legislators from both sides of the aisle because of the
increasingly insufficient maintenance of Iowa’s roads. The tax increase will allow several
30.
30
muchneeded highway projects to be undertaken, and will accelerate the rate of repairs for city
and county roads (Petroski, 2015). During our interview with the Johnson County
Commissioner, he expressed that his county was expecting a substantial increase in state funding
after the gas tax was implemented that would make up for most of the budget deficit his county
experiences for roads and bridges. Despite the guaranteed increased revenue that a reformed gas
tax would bring, this solution is still a temporary one as fuelefficient cars continue to gain in
popularity. It would, however, bring almost immediate financial relief to Missouri’s counties for
roads and bridges.
Another statelevel solution that could alleviate some of Boone County’s funding
challenges is to create a regional tax base sharing scheme so that Boone County and the City of
Columbia are no longer competing for the same tax revenue. Because regional tax base sharing
usually results in one government entity benefiting more than the other, these arrangements are
usually dictated at the statelevel. Implementing a regional tax base sharing program between
Boone County and Columbia would be politically difficult, but, if implemented, would alleviate
some of the competition with Columbia to capture the tax base and might be worth exploring in
more depth.
To create these statelevel solutions, Boone County would have to lobby the state
legislature. There are already several coalitions lobbying for these exact issues, and it would be
easy for Boone County to join the lobbying efforts. The Missouri Association of Counties is
working towards blocking any future legislature that further erodes the county tax base, fixing
the state’s “antiquated tax base,” and finding a funding package that would adequately address
Missouri’s infrastructure needs (Missouri Association of Counties, 2014). Also, the Missouri
31.
31
Local Leaders Project was just recently formed with the purpose of uniting local elected officials
to lobby more effectively for issues that affect their citizens (Yokley, 2015). Joining these
lobbying efforts would be relatively easy for Boone County, and lending their voice to an already
established group would make their efforts more salient.
If these statelevel changes were made, this alternative will be extremely effective at
addressing Boone County’s infrastructure funding challenges. However, the efficiency of trying
to make these statelevel changes is lacking, because lobbying for statelevel changes requires a
large upfront time commitment with no guarantee of reward. This would be a very equitable
solution, however, since the entire county would likely be affected equally by statelevel policy
changes. Finally, this alternative is very politically feasible, because lobbying for county
interests is usually looked upon as politically benign, if not expected. That this alternative has the
potential for substantial reward will likely make it even more politically feasible.
Alternative D: Transportation Development Districts
TDDs provide another funding alternative to Boone County. TDDs may allow the county
to address specific geographic transportation needs throughout the growing county. Given that
growth throughout the county is spatially disproportionate, TDDs may offer the county the
opportunity to target specific infrastructure needs in commercial growth areas surrounding
Columbia, as well as in rural areas, using TDD revenues as opposed funds from the Road and
Bridge Fund. This helps alleviate stress on the transportation fund to spend on other,
noncommercial, infrastructure services, making TDDs an equitable alternative.
Also, TDDs may be part of an intergovernmental collaboration that allow governments to
share infrastructure development responsibilities in growing areas that cross traditional
32.
32
jurisdictional and governmental boundaries. The City of Columbia already implements twelve
TDDs throughout different areas experiencing high growth, road use, and congestion (REDI,
2015). This demonstrates their political feasibility in the area, as well as efficiency for preventing
duplication.
Finally, TDDs have been shown to be effective. As of 2010, 166 TDDs were established
in Missouri, with a reported total estimated transportation project costs of over $1.6 billion and a
reported total anticipated revenues of over $2 billion (Missouri State Auditor, 2015). These are
significant revenues, which average to roughly $12 million per TDD, demonstrating their
effectiveness. Both the targeting and collaboration aspects of TDDs might give the opportunity
for equitable, effective, efficient and politically feasible means for funding new or improving
current transportation infrastructure where it is needed the most.
VII. CONCLUSIONS
As we can see from the criteria and our analyses, approaching the infrastructure problems
that face Boone County will require a collection of solutions; there does not seem to be a single
panacea. By attacking the problem from multiple angles, Boone County can more effectively
address their funding needs.
One of the biggest takeaways of this study is the need for greater countywide
communication. Boone County can benefit by involving all relevant stakeholders in developing a
strategy for longterm management of infrastructure developments, as this creates an open line of
communication and establishes a desire to achieve a desired vision through a cooperative
framework. The different layers of government can effectively communicate what is needed in
33.
33
each area, issues of concerns, and overall transportation goals. Further, this helps highlight the
many ways that each stakeholder has a role in the economic and communal development of the
region, whether through expertise, experience, or services.
Our study has highlighted other aspects of infrastructure services and funding that would
be improved if given further research. First, investigating the proposed bonds by the Obama
Administration would be helpful, to further explore the potential for new partnerships between
the public sphere and private organizations. Second, further study on increasing the gas tax must
be provided in order to appropriately gauge the burden to be levied on those contributing to the
decay of these systems. It is consistently brought up as one reason for declining revenue, but
there is a need for a thorough economic review of the effects on local budgets in the context of
improved gas efficiency and America’s changing driving habits. Third, Boone County would
benefit by researching ways to utilize private capital in a more effective manner. The bulk of this
inquiry would require significant economic analysis, but would provide a road map to utilize
resources that may currently be underutilized.
In closing, as we consider these areas of inquiry and potential solutions, Boone County
must recognize that there are plenty of opportunities available if the proper will and support is
applied. While there is no one ideal answer, public leaders must be outspoken and passionate
about the struggles they face and continue to educate the public about the needs and
opportunities for change in their community. This process will not independently yield the
desired returns, this vision of change must be consistently pursued through impassioned
leadership to assure the most the vital and sustainable future of Boone County.
34.
34
References
American Fact Finder. (2013). “Annual Estimates of the Resident Population: April 1, 2010 to
July 1, 2013”. United States Census Bureau. Retrieved from
http://factfinder.census.gov/faces/tableservices/jsf/pages/productview.xhtml?src=CF
Atwill D., Miller K., Thompson J., & Pitchford J. (2014). “2014 Budget.” Boone County
Missouri.
Bovaird, Tony and Elke Loeffler. 2007. Assessing the Quality of Local Governance: A Case
Study of Public Services. Public Money & Management 2007: 293300.
Carr, J. & Feiock, R. (2004). “Perspectives on CityCounty Consolidation and Its Alternatives.”
CItyCounty Consolidation and Its Alternatives: Reshaping the Local Government
Landscape. Retrieved from:
https://books.google.com/books?hl=en&lr=&id=ltw9BA4lLsC&oi=fnd&pg=PR8&dq=c
ity+county+government&ots=66Pawzcq0A&sig=OyXwdb_UIwgEfAcFVMUgkyWoqU
#v=onepage&q=city%20county%20government&f=false
Citizens Research Council (2008) Approaches to Consolidating Local Government Services.
Michigan: Citizens Research Council of Michigan.
City of Columbia Planning and Transportation Department. (2010). Transportation Development
Districts: An Overview of their Purpose, Establishment, Process, and Usage within the
City of Columbia. Retrieved from:
http://www.gocolumbiamo.com/community_development/commission_archive/Commiss
ions/PZ/documents/TDDReportPZCWS080510.pdf
Dauphin County Infrastructure Bank (2014). “Infrastructure Bank Guidelines.” Dauphin County
Department of Community and Economic Development. Dauphin County, Pennsylvania.
Downtown Columbia Leadership Council (2014). “Infrastructure Report presented to City of
Columbia Mayor and Council Members”. Downtown Columbia Leadership Council.
Retrieved from
http://www.gocolumbiamo.com/Council/Commissions/downloadfile.php?id=15621
Durning, D. (1995). “The Effects of CityCounty Government Consolidation: The Perspectives
of United Government Employees in AthensClarke County, Georgia.” Public
Administration Quarterly, 19(3), 272298. Retrieved from
http://www.jstor.org/stable/40862311
Flowers, A. (2014). “Why We Still Can’t Afford to Fix America’s Broken Infrastructure”.
FiveThirtyEight. Retrieved from
http://fivethirtyeight.com/features/whywestillcantaffordtofixamericasbrokeninfras
tructure/
Infrastructure: Going their separate ways (2014, November 22). The Economist. Retrieved from
http://www.economist.com/news/unitedstates/21633848statesandcitiesseizeinitiative
transportfundinggoingtheirseparateways
35.
35
Istrate E., Nowakowski A., & Mak, K. (2014). “The Road Ahead: County Transportation
Funding and Financing.” National Association of Counties. NACo Policy Research
Paper Series. Issue 2.
Kurtz, S. (2012, August 13). “How Obama is Robbing the Suburbs to Pay for the City.” Forbes.
Retreived from
http://www.forbes.com/sites/realspin/2012/08/13/howobamaisrobbingthesuburbstop
ayforthecities/
Maciag, M. (2014, March 5). “Cities consider taxing commuters to drive up revenue.”
Governing. Retrieved from
http://www.governing.com/news/headlines/govmorecitiescouldtaxnonresidentworke
rsreversecommuters.html
Missouri Association of Counties (2014). 2015 MAC Resolutions. Retrieved from
http://www.mocounties.com/images/187/document/macresolutions2015_740.pdf
Missouri Department of Economic Development Business and Community Services Division.
(2015). Retrieved from:
http://www.missouridevelopment.org/community%20services/Local%20Finance%20Initi
atives/Transportation%20Development%20District.html
Missouri Department of Revenue. (2015). Transportation Development District. Retrieved from:
http://dor.mo.gov/business/sales/tdd/
Missouri Department of Transportation. (2015). Transportation Development District
Frequently
Asked Questions. Retrieved from:
http://www.modot.org/PartnershipDevelopment/documents/TDDfaq.pdf
Missouri Department of Transportation. (2015). Transportation Development District
Information. Retrieved from:
http://www.modot.org/PartnershipDevelopment/documents/TDDInfo.pdf
Missouri Department of Transportation. (2015). Steps to Forming a Transportations
Development District. Retrieved from:
http://www.modot.org/PartnershipDevelopment/documents/StepsToFormingATransporta
tionDevelopmentDistrict.pdf
Missouri Department of Transportation (2013). Funding History. Retrieved from
http://www.modot.org/about/funding/fundinghistory.htm
Missouri State Auditor. (2011). Transportation Development Districts. Retrieved from:
http://www.auditor.mo.gov/repository/press/2011116.pdf
Office of Economic Policy. (2014). “Expanding our Nation’s Infrastructure through Innovative
Financing.” U.S. Department of the Treasury. Retrieved from
http://www.treasury.gov/presscenter/pressreleases/Documents/Expanding%20our%20N
ation's%20Infrastructure%20through%20Innovative%20Financing.pdf
Pagano, M. & Perry, D. (2008). “Financing Infrastructure in the 21st Century City”. Public
Works Management Policy, 13(1), 2238. Retrieved from
http://pwm.sagepub.com.proxy.mul.missouri.edu/content/13/1/22.full.pdf+html
36.
36
Parr, J., Riehm, J., & McFarland, C. (2006) Guide to Successful Local Government
Collaboration in America’s Regions. Washington, D.C.: National League of Cities.
Petroski, W. (2015, February 25). Gas tax hike takes effect Sunday. The Des Moines Register
Online. Retrieved from
http://www.desmoinesregister.com/story/news/politics/2015/02/25/iowagastaxbranstad
/23990671/
Regional Economic Development, Inc. (2015) Tax Rates. Retrieved from:
http://www.columbiaredi.com/expandrelocate/financingtaxesincentives/taxrates
Reschovsky, A. (1980). “An Evaluation of Metropolitan Area Tax Base Sharing.” National Tax
Journal, 33(1), 5566.
Sayeh, Antoineete M. 2014. “Infrastructure Investment: Part of Africa’s Solution.” IMFdirect.
October 28, 2014
United States Census Bureau (2014). “State and County QuickFacts.” U.S. Department of
Commerce. Retrieved from
http://factfinder.census.gov/faces/tableservices/jsf/pages/productview.xhtml?src=bkmk
Watts, J. & Jagoda, N. (2015). “Muni Market Participants Applaud QPIB, Water Proposals.” The
Bond Buyer. Retrieved from
http://www.bondbuyer.com/news/washingtoninfrastructure/munimarketparticipantsap
plaudqpibwaterproposals10696401.html
Yokley, E. (2015, January 22). “Local government groups form the ‘Missouri Local Leaders
Project.’” PoliticMO.com. Retrieved from
http://politicmo.com/2015/01/22/localgovernmentgroupsformthemissourilocalleade
rsproject/
38.
38
Appendix B: Missouri TDDs
Missouri TDDs also serve the purpose and have the power to:
● Form a board of directors who will possess and exercise all of the district's legislative and
executive powers, after qualified district voter approval.
● Contract with the Missouri Highways and Transportation Commission (MHTC) or the
local transportation authority to receive revenue from the district to apply to project costs.
● Increase or decrease the number of projects it is authorized to complete, subject to voter
approval, or modify a project subject to MHTC or local transportation authority approval.
● Levy special assessments, after qualified district voter approval.
● Incur contract and liabilities appropriate to its purpose.
● Purchase land or receive contribution of land and cash for project rightofway.
● Limit and control access from adjacent property to a district project.
● Sell and convey excess rightofway for fair market value to any person or entity.
● Contract with a federal agency, state agency, political subdivisions of the state, MHTC, a
local transportation authority, a corporation, partnership or individual regarding funding,
promotion, planning, designing, constructing, improving, maintaining or operating a
project.
● Contract with MHTC or a local transportation authority to transfer the project to them
free of cost
● Sue and be sued in its name, and receive service of process.
● Fix compensation of its employees and contractors, with competitive bidding practices
for contracts in excess of $5,000, and award contracts based on lowest and best.
39.
39
● Purchase property necessary or convenient for its activities, with competitive bidding
practices for purchases in excess of $1,000, and award purchases based on lowest and
best.
● Collect and disburse funds for its activities.
● Condemn land for a project, upon prior approval by MHTC or the local transportation
authority, per chapter 523, RSMo.
● Obtain insurance, the cost of which will be charged to the project, to protect itself, its
officers and its employees, against loss of real or personal property of any kind.
● Require contractors to obtain liability insurance, also naming the district, its directors and
employees as insured.
● Selfinsure if economically unfeasible to purchase insurance or if it has sufficient funds
to cover anticipated judgments.
● Pay for costs of an audit by the state auditor, occurring no less than once every three
years.
● Exercise other powers necessary or convenient for the district to accomplish its purposes
(Missouri Dept of Transportation, 2015).