2011 2qrt Newsletter
- 1. Detroit Semi-Annual Apartment Survey & Report
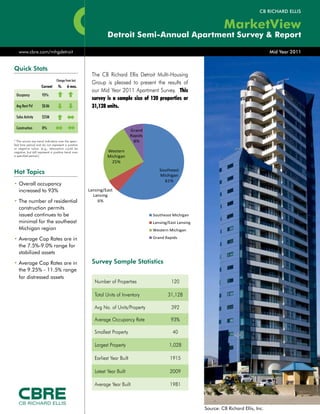
www.cbre.com/mhgdetroit Mid Year 2011
Quick Stats
The CB Richard Ellis Detroit Multi-Housing
Change from last
Group is pleased to present the results of
Current Yr. 6 mos.
our Mid Year 2011 Apartment Survey. This
Occupancy 93%
survey is a sample size of 120 properties or
Avg Rent Psf $0.86 31,128 units.
Sales Activity $55M
Construction 0%
Grand
Rapids
* The arrows are trend indicators over the speci- 8%
fied time period and do not represent a positive
or negative value. (e.g., absorption could be Southeast Michigan
negative, but still represent a positive trend over Western
a specified period.) Michigan Lansing/East Lansing
25%
Western Michigan
Southeast
Hot Topics Michigan Grand Rapids
61%
• Overall occupancy
Grand Rapids
increased to 93% 8%
Lansing/East
Lansing
• The number of residential 6%
construction permits
issued continues to be
Western Southeast Michigan
minimal for theMichigan
southeast Lansing/East Lansing
Michigan region 25% Western Michigan
Southeast
• Average Cap Rates are in Michigan Grand Rapids
61%
the 7.5%-9.0% range for
Lansing/East
stabilized assets
Lansing
6%
• Average Cap Rates are in Survey Sample Statistics
the 9.25% - 11.5% range
for distressed assets
Number of Properties 120
Total Units of Inventory 31,128
Avg No. of Units/Property 392
Average Occupancy Rate 93%
Smallest Property 40
Largest Property 1,028
Earliest Year Built 1915
Latest Year Built 2009
CB Richard Ellis
Average Year Built 1981
© 2010, CB Richard Ellis, Inc.
Source: CB Richard Ellis, Inc.
- 2. Occupancy
Since 2Q2011, occupancy rates increased slightly to Historic Overall Occupancy Occupancy
93%
Detroit Semi-Annual Apartment Survey & Report
95.0%
94.1%
94.0%
93.0% 93.2%
93.0%
The average occupancy level for 2011 is trailing the 92.0% 92.0%
92.0% 91.3%
91.2% 91.2%
national average just slightly by 1%. 91.0% 90.6%
90.0%
89.0% 89.1% 89.0%
The highest occupied Detroit submarket is Dearborn 89.0%
88.0%
at 99.8%. The lowest is the I-275 East submarket at
87.0%
88.2%. 86.0%
2000 2001 2002 2003 2004 2005 2006 2007 2008 2009 2010 2011
Submarkets with the most notable increases include:
Ann Arbor at 3.8% and I-275 East at 3.5%.
Overall occupancy rates have increased 1% since the
end of 2010. Survey results are summarized on page 4.
Source: CB Richard Ellis, Inc.
Submarket 2Q11 Occupancy 4Q10 Occupancy % Change
Ann Arbor 98.5% 94.9% 3.8%
Dearborn 99.8% 98.5% 1.3%
Detroit 90.0% 87.8% 2.5%
Downriver 89.0% 93.7% -5.0%
I-275 East 88.2% 85.2% 3.5%
I-275 West 97.1% 95.1% 2.1%
I-94 92.7% 92.0% 0.8%
M-53 95.2% 94.0% 1.3%
Oakland North 93.0% 93.1% -0.1%
Oakland South 94.0% 95.7% -1.8%
Oakland West 91.2% 90.0% 1.3%
Woodward 90.0% 91.2% -1.3%
Mid Mid Year 2010
Year 2011
*Submarket Map available on Page 6
Page 2
© 2010, CB Richard Ellis, Inc.
- 3. Maximizing Your Bottom Line During the Upswing in the Market
by Ed Glen and Ron Hall
Many properties are experiencing higher occupancy in southeast Michigan which is very gratifying for owners after the vacancy
problems and concessions during the past several years.
Detroit Semi-Annual Apartment Survey & Report
Although cash flow may be improving, we have noted some items to review which will further strengthen your bottom line.
When trying to improve your operating income, it is important to remember the 5 basic “P’s” of property management – Product
(curb appeal and rent ready units), People (are they trained and motivated?), Promotion (marketing and advertising), Policies
(do you allow dogs?) and Price (are rents maximized?). Sticking to the fundamentals is the key to success. Good ready product
-inside and out, trained and motivated sales people, sufficient qualified leasing traffic, and policies consistent with your immedi-
ate competitors (so you are not at a disadvantage) are surefire ways to increase demand. Lets’ take a closer look at the 5 “P’s”.
Product – Regardless of age, a property should always be clean and well maintained. Curb appeal cleanliness and attention
to detail are first impressions that begin to influence a customers buying decision from the moment they drive into your com-
munity. Rent ready vacant product is also critical to the sales process – the units must look good, smell good, and feel good with
no objections to the preparation of the apartment. Note that this process starts from the parking lot into the actual unit itself.
The lot should be clean, no litter/cigarette butts by the entry way to the building, no weeds or trash, the front door is painted
and in good shape, door hardware is snug and secure, and windows are clean so your product can be shown in its’ best light.
People - During periods of higher occupancy, the leasing personnel tend to get relaxed and become “drive-thru order tak-
ers” rather than true sales professionals who make an effort to connect with the customer and sell all the attributes of your
property and product. To keep the leasing personnel “fresh”, it is a good idea to shop your own people on line and by us-
ing a mystery shopper. The leasing agents’ attitude, knowledge and connection will make the sale of your apartments over
the competition if they have been trained and are motivated. This is true even if the competitor next door has more ameni-
ties or a slightly newer or larger unit type. Trained sales people can make the difference in both occupancy and rental rates.
Promotion – Merchandizing, marketing, and advertising are all components of a successful promotion campaign. Although rental
guides, newspapers, and signage are basic traffic generators, there are other sources to consider. The first is a website. In the
world today, over 70% of all apartment hunters seek information from the web. Websites are inexpensive to build and add email
capabilities that let customers gather information and communicate at all hours of the day and night. Another arrow in the quiver
is to complete a resident profile noting the employers of your existing residents. Where you have multiple residents working for
the same employer allows the opportunity to direct mail or personally visit the employers’ human resources department and of-
fer “preferred employer” incentives such as a reduced security deposit or waived application fee to attract even more employees.
Policies – Your community or company policies are not something you normally think about in terms of marketing your apart-
ments but they are important in both attracting and repelling potential residents. Obviously, some are personal preferences such
as not allowing pets or perhaps motorcycles. These policies should be reviewed and the questions asked “why do I have this in
place?” and “what would happen if it changed?”. By not reviewing and/or altering these types of policies, you are missing a large
percentage of the rental market. For example, according to the 2011- 2012 APPA National Pet Owners Survey, 62% of all U.S.
households own a pet (39% own a dog and 33% own a cat). If you do not allow pets, you have effectively cut your customer base
by 62%! Also, the number of American households that own motorcycles jumped 26% from 2003 – 2008. It is interesting to note
that the median household income of motorcycle owners exceeds that of the average American household (motorcycle owners
$59,290 while U.S. Average is $50,233). While these facts are not intended to necessary make you change these policies, it gives
you an idea of the importance of examining your rules (and motivation) for changes that may increase traffic and rental demand.
Price – Monthly market studies should be performed to monitor what your competition is doing in terms of rents, security de-
posits, and concessions. These surveys allow you to determine the rental ranges for unit types in you sub-market. The goal
is to be at the upper end of the range. Moving the rent when your demand is strong is essential if you are going to maxi-
mize your cash flow. Note that rents should be adjusted based on unit type and availability – not “across the board”. Also,
when trying to introduce a rent increase sometime it makes sense to give the leasing personnel a little perk. Be it a bonus for
individual leases, a bonus for achieving a certain number of leases within a certain time frame or maybe lunch for the en-
tire staff to celebrate the team’s success. A properly motivated staff can propel rents and occupancy beyond your expectation.
Every property is unique with its attributes and there are always opportunities to improve your assets’ performance. Sometimes
it is helpful to have a consultant examine your property since they will be looking at the operation with fresh eyes (to see it as
your customers see it) and with no bias or ego involved. It is the same reason you go to the doctor for an annual check-up so
a specialist can examine your vital signs and keep you in good running shape. When was the last time you gave your property
a checkup? For more information about marketing, management, and consulting, please contact www.REALmanagement.org.
Mid Mid Year 2010
Ed Glen and Ron Hall are founders or REAL Management. They have over 35 years of experience managing multifamily real estate throughout the
Source: Getty Images
United States. Ed and Ron have worked for industry names such as Cardinal Industries and Hall Financial Group as well as holding executive level
Year 2011
positions with Trammel Crow, Equity Residential, Beztak Properties, and the Altman Companies.
Page 3
© 2010, CB Richard Ellis, Inc.
- 4. Market Rents
Overall, average monthly rents decreased slightly rent increases is the Oakland West submarket at
Detroit Semi-Annual Apartment Survey & Report
from its 4Q2010 level of $800 or $0.90 per sf to 39.9%. Both increases appear to be spurred by the
$782 or $0.86 per sf, a 0.46% decrease. decrease in concessions being offered.
Since the 4Q2010, the most significant rent Concessions seem to be drying up. Most of our
decreases occurred in the following markets: survey respondents said they were not offering
Downriver, where average rents fell from $755 to any concessions. However, if they had to give a
$667, a decrease of 11.1%, and Dearborn, where concession, it was one month of free rent.
rents dropped from $1,031 to $963, a 6.6%
decline.
The largest increase in rent growth from the 4th
quarter of 2010 occurred in the Detroit market,
where rent increased from $623 to $1,148
or 84.3%. Another submarket with significant
Submarket * 2Q11 Avg Rent 4Q10 Avg Rent % Change
Ann Arbor $1,060 $875 21.1%
Dearborn $963 $1,031 -6.6%
Detroit $1,148 $623 84.3%
Downriver $667 $755 -11.7%
I-275 East $695 $683 1.8%
I-275 West $955 $758 26.0%
I-94 $735 $759 -3.2%
M-53 $856 $715 19.7%
Oakland North $1,128 $900 25.3%
Oakland South $885 $878 0.8%
Oakland West $1,000 $715 39.9%
Woodward $902 $900 0.2%
*Submarket Map available on Page 6
Occupancy & Rents by Property Class
Occup Avg Rent
Class Units % of Total Occupancy Change Avg Rent Change
4Q10 4Q10
A 2,335 7.5% 98.67% 92.5% 6.7% $1,400 $1,262 10.9%
B 5,292 17.0% 95.6% 92.8% 3.0% $850 $744 14.3%
C 23,501 75.5% 85.4% 90.2% -5.4% $650 $630 3.2%
Mid Mid Year 2010
Year 2011
Page 4
© 2010, CB Richard Ellis, Inc.
- 5. Rents By Unit Type
Detroit Semi-Annual Apartment Survey & Report
Chapoton Manor - St. Clair Shores, MI
Source: CB Richard Ellis, Inc.
AVG AVG CHANGE
AVG AVG LOW AVG
UNIT TYPE UNITS % MIX TOTAL SF HIGH RENT/ SINCE
UNIT SF RENT RENT
RENT SF 4Q10
STUDIO 623 2.0% 299,040 480 $497 $526 $512 $1.07 -8.14%
1BD/1BA 12,451 40.0% 9,002,073 723 $615 $681 $648 $0.90 -2.58%
1BD/1.5BA 45 0.1% 40,275 895 $714 $785 $750 $0.84 -29.63%
2BD/1BA 6,226 20.0% 5,709,180 930 $687 $795 $741 $0.80 -5.15%
2BD/1BA - TH 200 0.6% 206,000 1,030 $787 $895 $841 $0.82 43.25%
2BD/1.5BA 78 0.3% 84,864 1,088 $727 $840 $784 $0.72 -16.26%
2BD/1.5BA - TH 120 0.4% 142,560 1,188 $827 $940 $884 40.74 -11.47%
2BD/2BA 9,950 32.0% 10,905,200 1,096 $886 $979 $933 $0.85 1.29%
2BD/2.5BA 40 0.1% 55,680 1,392 $1,196 $1,422 $1,309 $0.94 -6.89%
3BD/1BA 25 0.1% 26,825 1,073 $991 $1,106 $1,049 $0.98 17.73%
3BD/1BA - TH 60 0.2% 70,380 1,173 $1,091 $1,206 $1,149 $0.98 34.13%
3BD/1.5BA 48 0.2% 57,792 1,204 $1,051 $1,161 $1,106 $0.92 -5.30%
3BD/2BA 1,100 3.5% 1,538,900 1,399 $1,093 $1,210 $1,152 $0.82 -55.75%
3BD/2.5BA 100 0.3% 168,100 1,681 $986 $1,071 $1,029 $0.61 -10.02%
3BD/3BA 62 0.2% 126,046 2,033 $1,853 $2,076 $1,965 $0.97 16.42%
TOTALS 31,128 100.0% 28,513,915 1,159 $933 $1,046 $990 $0.86 -4.12%
Mid Mid Year 2010
Year 2011
Page 5
© 2010, CB Richard Ellis, Inc.
- 6. CBRE Capital Markets Detroit Multi-Housing Group
:: W. Keith Johnson :: Bill O’Connor
Director Senior Vice President
248.351.2076 248.351.2045
Detroit Semi-Annual Apartment Survey & Report
keith.johnson@cbre.com bill.oconnor@cbre.com
:: Jason Brown :: Greg Cooksey
Vice President Vice President
248.351.2089 248.936.6839
jason.brown@cbre.com gregory.cooksey@cbre.com
Despite ongoing turbulence in the capital markets, CBRE us to market, transact, and finance assets even during
Detroit continues to provide leadership and expertise this complex economic environment.
in the execution of multi-housing transactions. With For more information or to participate in the CBRE
the industry’s leading investment sales and finance Detroit Semi-Annual Apartment Survey, please feel free
professionals, our Group’s seamless integration enables to contact us.
Submarket Map
Mid Mid Year 2010
© 2011 CB Richard Ellis, Inc. This information has been obtained from sources believed reliable. We have not verified it and make no guarantee,
warranty or representation about it. Any projections, opinions, assumptions or estimates used are for example only and do not represent the current
Year 2011
or future performance of the property. You and your advisors should conduct a careful, independent investigation of the property to determine to
your satisfaction the suitability of the property for your needs.
Page 6
© 2010, CB Richard Ellis, Inc.