1. NIRMA LIMITED-Capital Structure
Equity:
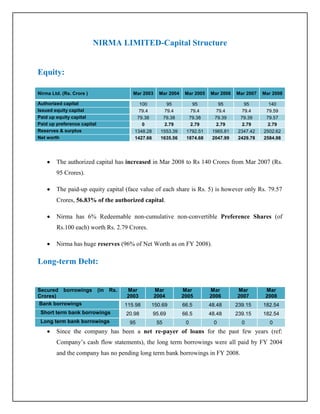
Nirma Ltd. (Rs. Crore ) Mar 2003 Mar 2004 Mar 2005 Mar 2006 Mar 2007 Mar 2008
Authorized capital 100 95 95 95 95 140
Issued equity capital 79.4 79.4 79.4 79.4 79.4 79.59
Paid up equity capital 79.38 79.38 79.38 79.39 79.39 79.57
Paid up preference capital 0 2.79 2.79 2.79 2.79 2.79
Reserves & surplus 1348.28 1553.39 1792.51 1965.81 2347.42 2502.62
Net worth 1427.66 1635.56 1874.68 2047.99 2429.78 2584.98
The authorized capital has increased in Mar 2008 to Rs 140 Crores from Mar 2007 (Rs.
95 Crores).
The paid-up equity capital (face value of each share is Rs. 5) is however only Rs. 79.57
Crores, 56.83% of the authorized capital.
Nirma has 6% Redeemable non-cumulative non-convertible Preference Shares (of
Rs.100 each) worth Rs. 2.79 Crores.
Nirma has huge reserves (96% of Net Worth as on FY 2008).
Long-term Debt:
Secured borrowings (in Rs. Mar Mar Mar Mar Mar Mar
Crores) 2003 2004 2005 2006 2007 2008
Bank borrowings 115.98 150.69 66.5 48.48 239.15 182.54
Short term bank borrowings 20.98 95.69 66.5 48.48 239.15 182.54
Long term bank borrowings 95 55 0 0 0 0
Since the company has been a net re-payer of loans for the past few years (ref:
Company’s cash flow statements), the long term borrowings were all paid by FY 2004
and the company has no pending long term bank borrowings in FY 2008.
2. The short term borrowing (in FY 2008) from banks are secured on pari passu basis (Pari
passu – a legal term referring to the equal treatment of two or more parties in an
agreement, extracted from: http://mba.tuck.dartmouth.edu/pecenter/resources/ glossary
_p_r.html), by a first charge, by way of hypothecation of specified stock of raw materials,
stock in process, finished goods, other merchandise being movable, book debts, both
present and future and by way of second charge on specified fixed assets, both present
and future, of the Company.
Nirma’s Cash flow from operations was pretty healthy till FY 2007, when it fell to
172.49 crores from 373.55 crores last year. The company also did not issue any other
debt instruments in FY 2007; rather, it borrowed from banks in this year. This might
explain the rise in borrowings from bank in FY 2007 to Rs. 239.15 Crores.
The company has reduced its Bank Borrowings (Secured Loans) in FY 2008 by around
23% as compared to FY 2007.
Mar Mar Mar Mar Mar Mar
Unsecured borrowings (in Rs. Crores)
2003 2004 2005 2006 2007 2008
Short-term loans from banks in foreign
140.08 0 0 0 43.57 87.94
currency
Non-Convertible debentures 140 25 0 0 0 140.00
Borrowings from corporate bodies 0 28.94 10.89 2.16 41.12 33.37
Deferred credit 3.83 3.07 2.35 1.63 0.96 0.04
The short-term loans from banks in foreign currency have nearly doubled from FY 2007
to FY 2008. This might be to support the acquisition of Searles Valley Minerals Inc.
(SVM) and Searles Valley Minerals Operations Inc. (SMVO), the USA based Soda Ash
producer in FY 2008.
Privately placed Floating Rate Non-Convertible Debentures worth Rs. 140 Crores
were issued by Nirma in FY 2008 to raise money for the above mentioned acquisition.
The borrowings from other corporate bodies decreased by around 19 % from FY 2007 to
FY 2008.
3. The total unsecured borrowings in FY 2008 (Rs. 261.35 Crores) is triple than that in the
year 2007 (Rs. 85.65 Crores)
Mar Mar Mar Mar Mar Mar
Nirma Ltd. (Rs. Crore)
2003 2004 2005 2006 2007 2008
Secured Borrowings 450.01 570.91 564.46 344.3 239.15 182.54
Unsecured Borrowings 143.83 108.36 13.24 3.79 85.65 261.35
Total Borrowings 593.84 679.27 577.7 348.09 324.8 443.89
Secured : Unsecured
3.13 5.27 42.63 90.84 2.79 0.70
Borrowings
The ratio of secured borrowings to unsecured borrowings was lowest in FY 2008. From
an investor point of view, this is not a healthy sign as unsecured borrowing outweighs
secured borrowings. This might indicate the company’s credibility might have gone down
as far as secured borrowings are concerned and hence it has to opt for unsecured
borrowings to fund its projects and acquisitions.
The aggregate level of loan funds increased from Rs.324.85 crores in the previous year to
Rs.443.94 crores at the end of 31st March 2008.
The debt to equity ratio of the Company is 0.17 in FY 2008 indicating that Nirma is
nearly and all-equity (or zero-debt) company.
Nirma is predominantly all-equity based company with very little loans ( Pd= 0.099)
Hence, the Wacc of Nirma is higher (since cost of equity is higher than cost of debt)
Nirma also has preference shares issued with cost of preference share of 6% (and Pps=
0.0066)
Since Nirma has very low debt, it is nearly risk-free.
4. HENKEL INDIA
Equity:
Dec Dec Dec Dec Dec Dec
Henkel India Ltd. (all fig. in Rs. Crore)
2002 2003 2004 2005 2006 2007
Authorized capital 1.4 1.4 172 172 172 172
Issued equity capital 0.8 0.8 116.46 116.46 116.46 116.46
Paid up equity capital (net of forfeited
0.8 0.8 116.46 116.46 116.46 116.46
capital)
Paid up preference capital (net of forfeited
0.1 0.1 68 68 68 68
capital)
Reserves & surplus 13.62 15 17.78 22.86 27.39 37.86
Net worth 14.52 15.9 202.24 207.32 211.85 222.32
Henkel’s capital structure hasn’t changed in recent years.
Henkel also has preference shares worth Rs. 68 Crores like Nirma Ltd. however,
Henkel’s preference shares are like the following:
9% Redeemable Non–Cumulative Preference Shares (of Rs 10 each) worth Rs. 28 Crores
4% Redeemable – Cumulative Preference Shares (of Rs 10 each) worth 40 Crores
The paid-up equity capital (face value of each share is Rs. 10) is however only Rs.
116.46 Crores, 67.70% of the authorized capital of Rs. 172 Crores.
Henkel has very less reserves (only 17% of the Net Worth as on Dec. 2007)
Long-term Debt:
Henkel India Ltd. ( All Fig. in Rs. Crore) Dec 2004 Dec 2005 Dec 2006 Dec 2007
Secured borrowings 31.89 15.74 15.55 10.18
Unsecured borrowings 168.25 150.02 171.13 282.1
Bank borrowings 125.95 110.78 186.68 292.28
Short term bank borrowings 125.95 110.78 186.68 292.28
Total Borrowings 200.14 165.76 186.68 292.28
Henkel India has no long term borrowings as on Dec 2007.
5. All borrowings are short-term bank borrowings.
However, the borrowings are greater than the net worth clearly indicating that Henkel is
levered to a large extent.
Henkel is a well balanced company (Net-Worth nearly equal to liabilities).
The Wacc of Henkel is lower than Nirma (as it is well-balanced)
Higher short-term loans however have a higher cost of debt.
Henkel has high debt and hence is more risky.
Comparisons between Nirma Ltd. and Henkel Ltd:
Mar-04 Mar-05 Mar-06 Mar-07 Mar-08
Nirma Ltd. Debt-equity ratio 0.42 0.31 0.17 0.13 0.17
Henkel India Ltd. Debt-equity ratio 0.89 0.99 0.8 0.88 1.31
Nirma’s debt-to-equity ratio is very less as compared to that of Henkel India.
Henkel India shows a more aggressive financing as compared to the stable approach by
Nirma Ltd. Textiles.
Nirma is not raising much debt because it has huge reserves (96% of Net Worth as on
FY 2008).
Nirma is a well-established brand in detergents and its cost of debt is lower as compared
to Henkel whose cost of debt will be higher because it has only short-term loans.