1. A method of examination of sample microstructure
The invention relates to optics. The purpose is to examine the microstructure of the sample
interior. To reduce the size of the region of luminescence created by the exterior light, which
determines the resolution limits of scanning microscopes, an additional radiation field is generated,
and this field contains a component that reduces the excited state population of the substance.
Several standing waves intersect at a preset point, at which for every pair of coherent progressive
waves, which compose the standing wave, the following conditions are satisfied: I1 = I2; 1 - 2 = ,
where I1 and I2 are progressive wave intensities; 1 and 1 are phases of the progressive wave
component that reduces the excited state population of the substance. The size of the luminescence
region obtained and the attainable resolution of the scanning microscope are determined by the
relationship Δr λ/2π B/cI where λ is the wavelength of additional radiation; B is probability of
spontaneous transitions from the excited state; cI is probability of forced transitions from the excited
state at the points of maximum intensities of additional radiation.
The invention relates to optics and can be used in high-resolution microscopy in biological,
physical, and technological studies.
The purpose of the invention is to examine the microstructure of the sample interior.
The proposed method is illustrated by a diagram.
The essence of the invention is as follows. Luminescence is excited in a sample placed in the
field of several standing light waves, which cause luminescence quenching because of forced
transitions from the luminescing state to short-lived state everywhere except in small neighborhoods
of the points at which the component of the standing wave field causing transitions to the short-lived
state (the forcing component of the field) vanishes. The sizes of the neighborhoods of the points at
which luminescence quenching does not occur are decreased with an increase in the intensity of the
standing wave field; and the positions of the points at which no luminescence decrease occurs are
defined by the condition that the two progressive coherent waves that form each of the standing
waves have antiphase forcing components.
The size of the luminescence region obtained can be determined as
λ
Δr B/cI
2π
where λ is the wavelength of additional radiation; B is probability of spontaneous transitions from
the excited state; cI is probability of forced transitions from the excited state.
Forcing additional radiation of standing waves can be used to create a small luminescence
region in the samples in which, for certain types of molecules, excited state population can be
reduced by exposure to light. Such samples must be at least partially transparent for initiating
(exciting) radiation, quenching additional radiation, and spontaneous luminescence radiation. Many
different substances have the necessary properties. These are crystals, glass, organic dye solutions,
etc. Among them are substances similar to those used in the active medium of the laser.
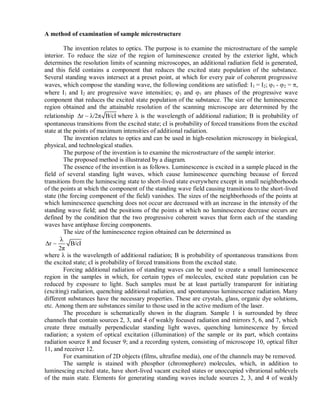
The procedure is schematically shown in the diagram. Sample 1 is surrounded by three
channels that contain sources 2, 3, and 4 of weakly focused radiation and mirrors 5, 6, and 7, which
create three mutually perpendicular standing light waves, quenching luminescence by forced
radiation; a system of optical excitation (illumination) of the sample or its part, which contains
radiation source 8 and focuser 9; and a recording system, consisting of microscope 10, optical filter
11, and receiver 12.
For examination of 2D objects (films, ultrafine media), one of the channels may be removed.
The sample is stained with phosphor (chromophore) molecules, which, in addition to
luminescing excited state, have short-lived vacant excited states or unoccupied vibrational sublevels
of the main state. Elements for generating standing waves include sources 2, 3, and 4 of weakly
2. focused coherent radiation and mirrors 5, 6, and 7, positioned perpendicular to the axes of coherent
radiation beams. Determination of the minimum necessary length of coherence, LMIN, is based on
the requirement of the stable position of the stable wave null planes:
minL =Iλ/Δr
where l is the distance from the mirror to the object, λ is the wavelength, and ∆r is the maximum
permissible size.
For instance, at λ = 6000 Å, l = 1 cm, ∆r = 60 Å, LMIN = 100 cm. For the null planes of
standing waves to be sufficiently stable, the maximum angle of fluctuations of the direction of light
beams from sources 2, 3, and 4 must be equal to
maxΔφ = Δr/4l
For instance, at ∆r = 60 Å, l = 1 cm, one needs maxΔφ 3·10-4
rad. Radiation from sources 2,
3, and 4 must be within the emission band of the dye used but outside its absorption band. For
instance, if aqueous solution of rhodamine 6G is used, wavelength λ of sources 2, 3, and 4 must be
within a range of 620 nm < λ < 700 nm; for fluorescein – Na – within a range of 500 nm < λ < 600
nm; for acetyl-aminopyrene-trisulfate – within a range of 450 nm < λ < 500 nm.
Mirrors 5, 6, and 7 are placed on electrostriction devices that enable slight preset
displacements of the mirrors. A system for optical excitation turns on radiation source 8 and focuser
9. The wavelength of the radiation source must be within the absorption band of the dye used. For
instance, for rhodamine 6G, the absorption maximum is at 510 nm, for fluorescein – Na – 480 nm,
and for acetyl-aminopyrene-trisulfate – 360 nm. The luminescence recording system consists of
microscope 10, optical filter (monochromator) 11, and receiver 12. Optical filter 11 only transmits
light in the emission (fluorescence) band of the dye, within a shorter wavelength region than the
wavelength region of the emission from sources 2-4 and in a longer wavelength region than the
emission range of source 8.
Example. The method is used as follows.
In order to determine the density of phosphor molecules, mirrors 5, 6, and 7 are installed in
the neighborhood of a certain point of the sample in such a way that nodal planes of the three
standing waves contain a certain point of the sample. The long-focus devices – components of
sources 2-4 of the weakly focused coherent radiation – are adjusted for the converging beams of the
rays reflected from mirrors 5-7, which have somewhat lower power than the incident radiation
beams (the reflection factors of mirrors 5-7 are below 1), to have radiation density in the
neighborhood of the required point of the sample that would be similar to the radiation density of the
incident beam in this neighborhood.
During measurement, source of short-wave illumination 8 is turned on, which induces
excitation of phosphor molecules in sample 1, and sources 2-7 of longer-wave forcing radiation are
turned on too, after which system 10-12 records spontaneous radiation of the defined small region of
the sample, which is proportional to the phosphor density in this region.
Having determined the density of phosphor molecules at one point of the sample, one should
apply a voltage to the electrostriction devices with the attached mirrors, shift the mirrors over a
defined distance along the axes of the light beams from sources 2-4, and measure the density of
phosphor molecules at a point positioned at such a distance from the previous one that the distance
to the mirrors should remain unchanged. The 3D map of the density of the molecules absorbing at
the wavelength of source 8 and emitting in the sensitivity range of the receiver will be the resulting
image of the object.
Invention formula
This is a method of examination of the microstructure of the sample by creating in it a
luminescence region of a size much smaller than the wavelength of exciting radiation, which
includes light excitation of the region that contains the defined point of the sample surface. This is
3. an innovation since the microstructure of the sample interior is examined by creating an additional
radiation field that contains a component reducing the excited state population of the substance
through the intersection of a few standing waves at a defined point, at which for every pair of
coherent progressive waves, which compose the standing wave, the following conditions are
satisfied:
I1 = I2; 1 - 2 = ,
where I1 and I2 are progressive wave intensities; 1 and 1 are phases of the progressive wave
component that reduces the excited state population of the substance.