1. Contacts:
Tele Nordeste Celular Participações S.A. Thomson Financial IR
Mario Roberto Gomes Isabel Vieira
55.81.216.2591 212.701.1823
Fabíola Almeida isabel.vieira@thomsonir.com
55.81.216.2594 Rick Huber
fabiola.almeida@timnordeste.com.br 212.701.1830
richard.huber@thomsonir.com
HYPERLINKHYPERLINK
TELE NORDESTE CELULAR PARTICIPAÇÕES S.A.
ANNOUNCES SECOND QUARTER 2000 RESULTS (UNAUDITED)
Recife, Brazil (August 1, 2000) – Tele Nordeste Celular Participações S.A. (NYSE: TND,
BOVESPA: TNEP3, TNEP4) (“Tele Nordeste” or “the Company”), the holding company
controlling the operating companies serving Band A cellular telecommunication clients in the
states of Piauí, Ceará, Rio Grande do Norte, Paraíba, Pernambuco and Alagoas, announced
today its results for the second quarter of 2000 in accordance with Brazilian GAAP (unaudited).
The translation to US dollars has been presented solely for the convenience of the reader. This
conversion does not imply that real amounts actually represent such US dollar amounts or may
be converted to US dollars at the rate indicated. The US dollar amounts have been converted
from reais at the commercial selling rate published by the Central Bank of Brazil at June 30,
2000, which was R$1.80 to US$1.00.
Operational Highlights
Marketing activities during the second quarter 2000 resulted in the gross addition of 165,364
clients (of which 127,953, or 77%, were prepaid). Gross additions for the first half 2000 totaled
349,454, of which 248,707 (71%) were prepaid. Subscribers’ acquisition cost (SAC) for the
second quarter 2000 was R$128, compared with R$139 for the first quarter 2000; SAC for the
first half 2000 was R$134, compared with R$157 for the year 1999. The Company had
1,362,000 clients at June 30, 2000, of which 843,000 (62%) were contract clients and 519,000
(38%) were prepaid clients. The market share at the end of the second quarter of 2000 was
estimated at 65%, compared to 69% at March 31, 2000.
The new billing system implemented in the second half of 1999 at the six operating companies
has now been normalized and collection activities have been strengthened. As a result,
management expects better performance in these activities and lower bad debt expenses in the
second half of 2000. Also, disconnection of overdue accounts has been reinforced. In the
second quarter, approximately 50,000 post-paid lines were disconnected due to non-payment.
www.timnordeste.com.br 1
2. At June 30, 2000, Tele Nordeste and its subsidiaries completed a restructuring which resulted in
the transfer of the goodwill paid in the privatization auction, from Bitel Participações S.A. to each
individual operating company. This restructuring aims at taking advantage of tax reductions
estimated at R$200 million over 8 years, until 2008, which will be capitalized by the operating
companies and will provide significant financial benefits for the company. The proposal to merge
the operating companies is pending approval from the regulatory agency, Anatel.
On June 13, 2000, Tele Nordeste formed, together with Tele Celular Sul Participações S.A.
(NYSE: TSU) an internet company, TimNet.com S.A., to provide internet-based, value-added
services to their respective clients. The initial investment totals US$10 million and this new
company will be operational by the end of the third quarter 2000.
SMS (Short Message System) was launched in July 2000, initially to postpaid clients. For the
first two months the service will be offered for free. After the introductory period, SMS will be
offered to all clients. The company estimates that WAP technology will be operational by the
end of the year, as TDMA WAP handsets become available in the market.
Financial Highlights
Tele Nordeste’s consolidated net income for the second quarter 2000 was R$0.9 million
(US$0.5 million) resulting in a consolidated net income of R$12.1 million (US$6.7 million) for the
first half of 2000, or R$0.036 (US$0.02) per thousand shares, compared to a consolidated net
income of R$2.9 million (US$1.6 million) for the second quarter 1999 and R$16.5 million
(US$9.2 million) for the first half of 1999.
Consolidated net operating revenue for the second quarter 2000 reached R$210.8 million
(US$117.1 million), resulting in a total of R$425.3 million (US$236.3 million) for the first half of
2000, compared to R$150.4 million (US$83.6 million) for the second quarter 1999 and R$290.9
million (US$161.6 million) for the first half of 1999. Compared with the first quarter 2000, net
operating revenues decreased by 1.7%, comprised of a decrease in traffic revenue of 5% and
an increase in sales of handsets of 23%. The reduction in traffic revenue was caused by
seasonality, and also by more strict credit control implemented in April 2000.
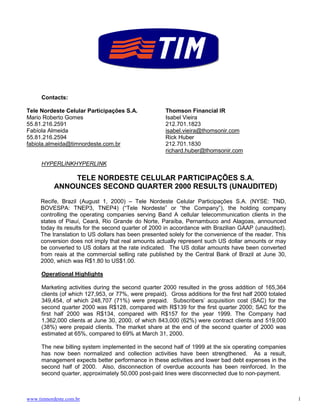
For the second quarter 2000, the Company reported consolidated EBITDA and EBIT of R$52.9
million (US$29.4 million) and R$21.4 million (US$11.9 million), respectively, representing a n
EBITDA margin of 25% and an EBIT margin of 10% over net operating revenues, compared to
the R$49.5 million (US$27.5 million) EBITDA and R$20.3 million (US$11.3 million) EBIT,
representing an EBITDA margin of 33% and an EBIT margin of 14% over net operating
revenues, reported for the second quarter 1999.
For the first half of 2000, EBITDA and EBIT were R$126.2 million (US$70.1 million) and R$68.7
million (US$38.2 million), representing an EBITDA and EBIT margin over the net operating
revenues of 30% and 16%, respectively, compared to the R$110.6 million (US$61.4 million)
EBITDA and R$53.1 million (US$29.5 million) EBIT, representing a 38% EBITDA margin and an
EBIT margin of 18% over net operating revenues, reported for the first half of 1999.
E B I T D A (i n R $ 0 0 0 )
8 0 ,0
6 0 ,0
4 0 ,0
2 0 ,0
0 ,0
1 Q9 8 2 Q9 8 3 Q9 8 4 Q9 8 1 Q9 9 2 Q9 9 3 Q9 9 4 Q9 9 1 Q0 0 2 Q0 0
www.timnordeste.com.br 2
3. Consolidated bad debt expenses, net, for the second quarter 2000, were R$29 million (US$16.1
million), representing 11% of gross revenues for that quarter and reflected adjustments made
following the normalization of the new billing system; bad debt expenses are expected to
decrease in the second half of this year, after disconnection of post-paid clients and the
implementation of new and more effective collection procedures. Also impacting net result for
the second quarter was the write off of R$5.2 million of undetected, fraudulent international calls
(cloning) that were paid to the long-distance carriers and not billed to the clients. The anti-fraud
procedures have also been strengthened during the second quarter to minimize this type of risk.
Interest on Equity
In accordance with the Annual Shareholders’ Meeting held on April 27, 2000, the Company has
started paying 1999 dividends, in the form of interest on equity, totaling R$9.9 million (US$5.5
million).
Interest on Equity (per thousand shares)
Net Value (in reais)
Exempt Taxable
Common Preferred Common Preferred
Interest on equity 0.0299 0.0299 0.0254 0.0254
Tele Nordeste’s subsidiaries, in accordance with their Annual Shareholders’ Meetings, started
paying dividends and interest on equity based on their results for the year ended December 31,
1999, on June 26, 2000, totaling R$14.6 million (US$8.1 million).
Selected Consolidated Financial Data (in thousands of Reais)
nd st
2 Qtr. 1 Half
2000 1999 2000 1999
Revenue
- Usage charges 120,184 94,287 251,572 188,307
- Monthly subscription payments 38,523 35,552 90,717 67,367
- Activation fees - - - 81
- Network usage charges 66,597 36,941 128,108 77,048
- Sale of handsets 38,550 23,573 69,925 35,154
- Other 1,657 863 4,405 1,838
Subtotal 265,511 191,216 544,727 369,795
- Value added and other indirect taxes (54,719) (40,858) (119,457) (78,903)
Net Operating Revenue 210,792 150,358 425,270 290,892
Cost of services and of goods sold
- Depreciation and amortization (27,368) (28,720) (51,725) (56,662)
- Personnel (1,315) (1,178) (4,058) (1,743)
- Materials and services (1.692) 1,839 (3,221) (3,302)
- Circuit leasing and related expenses (32,652) (23,968) (66,771) (55,292)
- Leases and insurance (2,246) (1,507) (4,468) (2,972)
- Cellular handset costs (36,793) (27,520) (68,514) (34,353)
- Fistel and other 5,616 (5,016) (588) (9,809)
Subtotal (96,450) (86,070) (199,345) (164,133)
Gross profit 114,342 64,288 225,925 126,759
Consolidated net operating revenue for the second quarter 2000 increased 40% when
compared with the same quarter of the previous year. This increase is primarily due to the
substantial increase in the number of clients during the period. The average number of clients in
the second quarter 2000 increased 80% (from 729,000 to 1,315,000) over the same quarter of
1999. Consolidated net operating revenue for the first half of 2000 increased 46% over the first
www.timnordeste.com.br 3
4. half of 1999. Incoming traffic revenues (network usage charges) increased 80% year-over-year,
due to the substantial increase in prepaid clients.
N e t R e v e n u e (i n R $ 0 0 0 )
2 5 0 ,0
2 0 0 ,0
1 5 0 ,0
1 0 0 ,0
5 0 ,0
0 ,0
1 Q9 8 2 Q9 8 3 Q9 8 4 Q9 8 1 Q9 9 2 Q9 9 3 Q9 9 4 Q9 9 1 Q0 0 2 Q0 0
Consolidated gross profit increased 78% when compared to the second quarter of 1999 and
78% over the first half of last year, primarily as a result of higher usage by the clients (incoming
and outgoing calls). Fistel tax was reclassified to marketing expenses in the second quarter
2000.
G r o ss P r o fi t (i n R $ 0 0 0 )
1 2 0 ,0
1 0 0 ,0
8 0 ,0
6 0 ,0
4 0 ,0
2 0 ,0
0 ,0
1 Q9 8 2 Q9 8 3 Q9 8 4 Q9 8 1 Q9 9 2 Q9 9 3 Q9 9 4 Q9 9 1 Q0 0 2 Q0 0
Selected Consolidated Financial Data (in thousands of Reais)
nd st
2 Qtr 1 Half
2000 1999 2000 1999
Operating Expenses
- Selling 62,768 24,928 109,333 41,822
- General and administrative 24,221 19,134 42,468 31,181
- Other operating expenses, net 6,306 (630) 5,940 (2,452)
Subtotal 93,295 43,432 157,741 70,551
- Net financing expenses 22,363 9,627 43,336 16,094
Total 115,658 53,059 201,077 86,645
Consolidated net operating expenses increased substantially during the second quarter
compared to the same period of the prior year, to R$115.7 million (US$64.3 million) from
R$53.1 million (US$29.5 million) in 1999. This increase in operating expenses resulted
primarily from higher bad debt expenses, write off of fraudulent international calls and higher
financing expenses.
Consolidated bad debt expense for the second quarter 2000 reached R$29 million (US$16.1
million), compared with R$11.6 million (US$6.4 million) in the same quarter of 1999,
representing 11% of gross revenue for the quarter. Year-to-date bad debt expenses amount to
R$49.8 million (US$27.7 million), or 9% of gross revenues.
Financing expenses reflect the higher level of indebtedness to finance the expansion projects.
Consolidated debt-to-equity ratio at June 30, 2000, was 0.7.
www.timnordeste.com.br 4
5. Consolidated Statistics
2Q, 2000 1Q, 2000 4Q, 1999 3Q, 1999 2Q, 1999
Clients
- Postpaid 842,569 886,085 860,529 782,353 737,388
- Prepaid 519,100 427,167 327,383 169,704 55,134
- Total 1,361,669 1,313,252 1,187,912 952,057 792,522
Growth over same period of the previous 71.8 90.4 93.4 86.3 69.8
year (%)
Estimated population of region (in millions) 26.2 26.1 26.1 26.0 26.0
Penetration rate (%)
- Tele Nordeste 5.2 5.0 4.6 3.7 3.0
- Total 8.0 7.3 6.6 4.8 4.1
Switches 12 12 12 12 12
Radio base stations 773 762 737 652 640
Mini-cells 63 62 59 58 58
Employees (full-time, interns and temporary) 1,646 1,277 1,283 1,275 1,177
Clients per employee 827 1,028 926 747 673
The digitalization project reached 66% of voice channels at June 30, 2000, and 82% of the
customer base were already using digital handsets. The total coverage reached 74% of the
population and 28% of the area.
ARPU
The blended average revenue per user (ARPU), net of taxes, for the second quarter of 2000,
was R$45 (US$25) per month, compared to R$62 (US$34) per month for the second quarter of
1999. This reduction was caused by the addition of low use, prepaid clients as of May, 1999,
and the stricter credit control procedures which were resumed in April 2000 (i.e. call blocking).
The blended ARPU for the first half of 2000 was R$48 (US$27), compared to R$65 (US$36) for
the same period of the prior year.
Postpaid ARPU in 2000 has been negatively affected by the increase in blocked lines for credit
reasons, which was resumed at the end of the second quarter. Blocking is done on a partial
basis, and therefore, just incoming traffic revenues are generated by those clients.
Competition
The Company estimates that its market share at the end of the second quarter of 2000 was
approximately 65%, in terms of number of lines. The penetration rate in the region at the end of
June 2000 was estimated at 8%, compared to Brazil’s penetration rate of approximately 11%
(18.5 million accesses).
In the second quarter 2000 two promotional campaigns (Mothers’ Day and Valentines’ Day)
featured interest-free financing of handsets and subsidies linked to one-year contracts with
minimum usage. General subsidies have been discontinued as of March, 2000.
Debt
Consolidated debt at June 30, 2000, was R$392.7 million (US$218.1 million), with R$350.7
(US$194.8 million) maturing in the short-term. The debt is totally denominated in Reais, in line
with the Company’s policy of minimizing exposure to foreign currency fluctuations.
www.timnordeste.com.br 5
6. The Company is in the process of closing long-term financing contracts with the European
Investment Bank – EIB (third quarter) and Banco Nacional de Desenvolvimento Econômico e
Social – BNDES (fourth quarter).
i
Capital Expenditures
During the second quarter of 2000, Tele Nordeste and its subsidiaries invested R$80.4 million
(US$44.7 million), totaling R$116.5 million (US$64.7 million) for the first half of the year. These
investments are primarily focused on network digitalization.
The capex program for 2000 amounts to R$215 million and includes enhancements to the
Company’s systems, new services and Internet facilities.
This press release contains forward-looking statements. The Company and its representatives may also make forward-
looking statements in press releases and oral statements. Statements that are not statements of historical fact, including
statements about the beliefs and expectations of the Company’s management, are forward-looking statements. The words
“anticipates,” “believes,” “estimates,” “expects,” forecasts,” predicts,” “projects” and similar words are intended to
identify these statements, which necessarily involve known and unknown risks and uncertainties. Known risks and
uncertainties, some of which are discussed at pages 14-17 herein, include those resulting from the short history of the
Company’s operations as an independent, private sector, as well as those relating to the cost and availability of financing,
the performance of the Brazilian economy generally, the levels of exchange rates between Brazilian and foreign currencies
and the Federal Government’s telecommunications policy. Accordingly, the actual results of operations of the Company
may be different from the Company’s current expectations, and the reader should not place undue reliance on these
forward-looking statements. Forward-looking statements speak only as of the date they are made, and the Company does
not undertake any obligation to update them in light of new information or future developments.
www.timnordeste.com.br 6
7. Balance Sheet
At June 30, and March 31, 2000
(In thousands of Reais)
Parent Company Consolidated
06.30.2000 03.31.2000 06.30.2000 03.31.2000
Assets
Current assets
Cash and cash equivalents 524 1,424 10,475 7,624
Trade accounts receivable – Clients - - 182,022 169,630
Inventories 37 15 13,678 44,578
Telecommunications companies - - 30,670 36,462
Trade accounts receivable – Subsidiaries 14,456 - - -
Recoverable taxes 2,957 1,937 44,077 14,758
Deferred income and social contribution taxes 332 1,082 24,970 21,677
Dividends and interest on shareholders’ equity 4,079 9,632 - -
Prepaid expenses 66 17 10,728 -
Other assets 1,634 1,597 16,783 67,505
24,084 15,704 333,405 362,234
Noncurrent assets
Loan to subsidiaries 5,293 27,232 - -
Tax incentives - - 2,791 2,746
5,293 27,232 2,791 2,746
Permanent assets
Investments 544,312 341,111 1 -
Property, plant and equipment 5,297 4,901 704,239 654,269
Deferred asset - - 202,300 -
549,609 346,012 906,540 654,269
578,987 388,948 1,242,736 1,019,250
www.timnordeste.com.br 7
8. Balance Sheet
At June 30, and March 31, 2000
(In thousands of Reais)
Parent Company Consolidated
06.30.2000 03.31.2000 06.30.2000 03.31.2000
Liabilities and Shareholders’ Equity
Current liabilities
Suppliers 926 504 74,753 76,898
Loans and financing - - 350,740 332,370
Taxes payable 902 594 51,098 45,796
Salaries and vacation pay 1,573 1,205 7,322 5,885
Subsidiaries 100 10,641 - -
Telecommunication companies 2 3 14,118 9,843
Dividends and interest on shareholders’ equity 2,400 10,373 7,586 4,401
Other liabilities 1,459 376 19,979 32,161
7,362 23,698 524,415 507,354
Noncurrent liabilities
Loans and financing - - 41,920 45,376
Other liabilities - - 1,972 93
- - 43,892 45,469
Minority interest - - 101,623 101,176
Shareholders’ equity
Capital 108,843 108,943 108,843 108,943
Special reserves 204,068 - 204,068 -
Earnings reserves 178,922 178,922 178,922 178,922
Retained earnings 79,792 77,386 79,792 77,386
571,625 365,251 571,625 365,251
578,987 388,948 1,242,736 1,019,250
www.timnordeste.com.br 8
9. Statement of Income
For the quarters and semesters ended June 30, 2000 and June 30, 1999
(In thousands of Reais)
Parent Company Consolidated
Quarter Semester Quarter Semester Quarter Semester Quarter Semester
ended ended ended ended ended ended ended ended
06.30.2000 06.30.2000 06.30.1999 06.30.1999 06.30.2000 06.30.2000 06.30.1999 06.30.1999
Revenue
Telecommunications services and
sale of goods - - - - 265,511 544,727 191,216 369,795
Deductions
(taxes and discounts) - - - - (54,718) (119,457) (40,858) (78,903)
Net Revenue - - - - 210,793 425,270 150,358 290,892
Cost of goods sold and
services rendered - - - - (96,450) (199,345) (86,070) (164,133)
Gross profit - - - - 114,343 225,925 64,288 126,759
Operating revenues (expenses)
Selling expenses - - - - (62,768) (109,333) (24,928) (41,822)
Administrative and general
expenses (1,156) (2,963) (7,345) (10,597) (24,221) (42,469) (19,134) (31,181)
Financial expenses (173) (230) (499) (1,189) (22,827) (47,832) (12,272) (26,179)
Financial income 1,409 2,143 1,799 4,119 464 4,496 2,645 10,085
Equity in income of subsidiaries 3,866 15,774 8,938 24,155 - - - -
Other operating income - - - - 2,872 3,690 2,579 5,635
Other operating expenses (1,085) (1,159) (7) (7) (9,178) (9,629) (1,949) (3,183)
Operating income (loss) 2,861 13,565 2,886 16,481 (1,316) 24,848 11,229 40,114
Nonoperating income (17) - - - 724 1,029 - -
Nonoperating expenses - - - - (347) (545) (558) (3,106)
Income before income and
social contribution taxes 2,844 13,565 2,886 16,481 (939) 25,332 10,671 37,008
Income and social contribution
taxes (439) - - - 1,407 (10,183) (5,077) (13,355)
Reversal of interest on
shareholders’ equity - - - - 1,227 1,227 - -
Net income before minority
interest 2,405 13,565 2,886 16,481 1,695 16,376 5,594 23,653
Minority interest - - - - (779) (4,300) (2,708) (7,172)
Net income (loss) 2,405 13,565 2,886 16,481 916 12,076 2,886 16,481
Net income (loss) per lot of a
thousand shares (R$) 0.0072 0.0406 0.00863 0.0493
Number of shares at
June 30, 2000 (thousands) 334,399,028 334,399,028 334,399,028 334,399,028
www.timnordeste.com.br 9