SlideShare a Scribd company logo
1 of 27
Download to read offline
For All TREB Member Inquiries:
                                                                                                                                       (416) 443-8152

                                                                                                                         For All Media/Public Inquiries:
July 2012                                                                                                                               (416) 443-8158

Economic Indicators GTA Home Prices Up in July                                                                                                TorontoMLS Sales Activity1,7
                                                   TORONTO, August 3, 2012 – Greater Toronto REALTORS® reported 7,570 sales in July
Real GDP Growthi
                                                   2012, representing a decline of 1.5 per cent compared to 7,683 sales reported in July
       Q1 2012 t                  1.9%             2011. The decline was most pronounced in the condominium apartment segment in
                                                   the City of Toronto. Total sales in the rest of the Greater Toronto Area (GTA) were up
Toronto Employment Growthi i                       compared to the same period last year.
      June 2012 t     0.2%                         “Very strong annual sales growth in the first half of 2012 and an earlier peak in sales          7,570        7,683
                                                   this spring compared to 2011 help explain more moderate sales this summer. New
Toronto Unemployment Rate
                                                   mortgage lending guidelines and the additional upfront cost of the City of Toronto land
      June 2012 q     8.6%                         transfer tax also prompted some households to put their buying decision on hold,” said
                                        ii         Toronto Real Estate Board (TREB) President Ann Hannah.
Inflation (Yr./Yr. CPI Growth)
                                                   The average selling price in July 2012 was $476,947 – up by four per cent compared to
        June 2012 t        1.5%                    July 2011. The MLS® Home Price Index (MLS® HPI)* composite index, which allows for             July 2012     July 2011
                                             iii   an apples-to-apples comparison of benchmark home prices from one year to the next,
Bank of Canada Overnight Rate                      was up by 7.1 per cent year-over-year.
       July 2012 q       1.0%                      “The GTA housing market became better-supplied in recent months. Buyers benefitted         TorontoMLS Average Price1,7
              iv                                   from more choice in the market place, resulting in less upward pressure on the average
Prime Rate                                         home price in July,” said Jason Mercer, TREB’s Senior Manager of Market Analysis.
       July 2012          q       3.0%             “The mix of homes sold in July 2012 versus July 2011 also appears to have changed,
                                   iv              further influencing the average selling price. This is evidenced by the different annual
Mortgage Rates (July 2012)                         rates of growth between the overall average price and the MLS HPI®,” continued


                                                                                                                                                     $476,947


                                                                                                                                                                  $458,646
Chartered Bank Fixed Rates                         Mercer.
         1 Year u 3.10%
                                                                                                                                 1,7
         3 Year q 3.95%                             Sales & Average Price By Major Home Type
         5 Year q 5.24%
                                                    July 2012
Sources and Notes:                                                                   Sales                       Average Price
i
Statistics Canada, Quarter-over-quarter                                    416        905       Total        416     905       Total              July 2012     July 2011
growth, annualized
                                                    Detached               852       2,729      3,581      $752,431 $552,239 $599,869
ii
 Statistics Canada, Year-over-year growth                                                                                                                                      1,7
for the most recently reported month
                                                     Yr./Yr. % Change      -4%        -1%        -2%          8%       5%       6%            Year-Over-Year Summary
                                                    Semi-Detached          272        509        781       $526,979 $389,592 $437,440                  2012    2011          % Chg.
iii
 Bank of Canada, Rate from most recent
                                                     Yr./Yr. % Change     -14%        2%         -4%          5%       5%       4%    Sales            7,570   7,683         -1.5%
Bank of Canada announcement

iv
                                                    Townhouse              323        980       1,303      $416,084 $357,166 $371,771 New Listings    13,888  12,407         11.9%
 Bank of Canada, Rates for most recently
completed month                                      Yr./Yr. % Change      -5%        24%       15%           3%       5%       4%    Active Listings 20,318  17,515         16.0%
                                                    Condo Apartment       1,246       507       1,753      $347,996 $279,603 $328,216 Average Price $476,947 $458,646         4.0%
                                                     Yr./Yr. % Change     -13%        -2%       -10%         -1%       1%      -1%    Average DOM        26     26           -0.1%
Toronto Real Estate Board

SALES BY PRICE RANGE AND HOUSE TYPE1,7                                                                                                                            JULY 2012

       Price Range         Detached   Semi-Detached   Att/Row/Twnhouse   Condo Townhouse     Condo Apt     Link     Co-op Apt      Det Condo   Co-ownership Apt      Total
$0 to $99,999                 12           0                 0                  4                10        0           1              0               0                27
$100,000 to $199,999          55           14                7                  77              226        1           4              0               0               384
$200,000 to $299,999         290           54               96                 205              617        30          1              4               4              1,301
$300,000 to $399,999         575          267               204                261              537        21          0              2               0              1,867
$400,000 to $499,999         748          274               199                 90              210        47          2              0               1              1,571
$500,000 to $599,999         623           92               73                  26               69        28          1              0               0               912
$600,000 to $699,999         439           43               23                  8                41        4           0              0               0               558
$700,000 to $799,999         275           21                4                  7                13        0           1              0               0               321
$800,000 to $899,999         167           9                 8                  1                6         0           0              0               0               191
$900,000 to $999,999          95           3                 4                  1                7         0           0              0               0               110
$1,000,000 to $1,249,999     123           2                 1                  0                10        0           0              0               0               136
$1,250,000 to $1,499,999      78           1                 1                  1                5         0           0              0               0                86
$1,500,000 to $1,749,999      29           1                 1                  0                1         0           0              0               0                32
$1,750,000 to $1,999,999      25           0                 0                  0                1         0           0              0               0                26
$2,000,000 +                  47           0                 1                  0                0         0           0              0               0                48
Total Sales                 3,581         781               622                681             1,753       131         10             6               5              7,570
Share of Total Sales        47.3%        10.3%              8.2%              9.0%             23.2%      1.7%        0.1%           0.1%           0.1%               -
Average Price              $599,869     $437,440          $422,567          $325,376          $328,216   $416,713   $313,300       $286,750        $299,260         $476,947


SALES BY PRICE RANGE AND HOUSE TYPE1,7                                                                                                         YEAR-TO-DATE, 2012

       Price Range         Detached   Semi-Detached   Att/Row/Twnhouse   Condo Townhouse     Condo Apt     Link     Co-op Apt      Det Condo   Co-ownership Apt      Total
$0 to $99,999                 30            1                 4                 14              145         0          4              0              5                 203
$100,000 to $199,999         420           118               40                489             1,671        8          27             0              6                2,779
$200,000 to $299,999        2,048          421              781               1,501            4,326       260         18             12             27               9,394
$300,000 to $399,999        4,403         2,020            1,447              1,631            4,013       192         19             22             7               13,754
$400,000 to $499,999        5,410         2,135            1,297               548             1,653       260         10             7              6               11,326
$500,000 to $599,999        4,840          770              521                158              599        220         4              3              0                7,115
$600,000 to $699,999        3,571          378              247                 87              302         59         1              4              0                4,649
$700,000 to $799,999        2,356          210               80                 62              131         7          3              1              0                2,850
$800,000 to $899,999        1,538          116               58                 22               81         0          0              0              0                1,815
$900,000 to $999,999         871            57               23                 6                43         0          0              0              0                1,000
$1,000,000 to $1,249,999    1,095           49               21                 11               77         2          2              1              0                1,258
$1,250,000 to $1,499,999     708            32                7                 2                32         0          0              0              0                 781
$1,500,000 to $1,749,999     373            11                7                 1                22         0          0              0              0                 414
$1,750,000 to $1,999,999     223            5                 2                 0                6          0          0              0              0                 236
$2,000,000 +                 456            2                 2                 1                15         0          0              0              0                 476
Total Sales                 28,342        6,325            4,537              4,533            13,116     1,008        88             50             51              58,050
Share of Total Sales        48.8%        10.9%              7.8%              7.8%             22.6%      1.7%        0.2%           0.1%           0.1%               -
Average Price              $630,762     $458,212          $424,331          $328,523          $337,582   $414,214   $308,686       $400,698        $259,998         $501,212


                                                                                           Page 3                                                                  July 2010
                                                                                                                             Market Watch, July 2012                           2
Toronto Real Estate Board
                                                                                                                                                       ALL HOME TYPES, JULY 2012
SUMMARY OF EXISTING HOME TRANSACTIONS
                                                                                                                                                                 ALL TREB AREAS
                              Number of Sales   Dollar Volume1   Average Price1   Median Price1    New Listings2   SNLR (Trend) 8   Active Listings3   Mos. Inv. (Trend)9   Avg. SP/LP 4    Avg. DOM5
TREB Total                        7,570         $3,610,492,389     $476,947         $410,000            13,888        58.0%             20,318                2.2              98%             26
Halton Region                      484          $247,931,095       $512,254         $466,000             775          60.2%             1,289                 2.3              98%             24
 Burlington                         75           $33,524,400       $446,992         $385,000             123          60.0%              223                  2.5              98%             28
 Halton Hills                       77           $35,488,550       $460,890         $432,500              94          69.7%              174                  2.3              98%             28
 Milton                            169           $78,570,045       $464,912         $447,000             260          61.9%              307                  1.6              98%             19
 Oakville                          163          $100,348,100       $615,633         $560,000             298          55.9%              585                  2.8              98%             25
Peel Region                       1,801         $790,917,716       $439,155         $395,000            3,294         57.4%             4,287                 2.1              98%             24
 Brampton                          777          $314,738,144       $405,068         $380,400            1,467         56.3%             1,752                 2.0              98%             23
 Caledon                            88           $49,329,300       $560,560         $501,250             119          56.7%              269                  3.5              97%             33
 Mississauga                       936          $426,850,272       $456,037         $406,000            1,708         58.4%             2,266                 2.0              98%             24
City of Toronto                   2,721         $1,363,040,705     $500,934         $410,000            5,537         55.5%             8,385                 2.3              98%             26

! TURN PAGE FOR CITY OF TORONTO
TABLES OR CLICK HERE:

York Region                       1,341         $794,512,875       $592,478         $525,000            2,545         59.5%             3,654                 2.1              98%             24
 Aurora                             81           $47,180,350       $582,473         $499,900             106          68.5%              155                  1.7              97%             24
 E. Gwillimbury                     33           $15,822,500       $479,470         $424,900              49          62.6%               88                  2.9              96%             24
 Georgina                           70           $21,189,705       $302,710         $275,250              99          67.4%              240                  3.0              98%             36
 King                               22           $16,945,425       $770,247         $677,500              55          51.3%              145                  5.6              96%             35
 Markham                           379          $226,902,366       $598,687         $535,000             758          57.6%              981                  1.9              98%             21
 Newmarket                         121           $55,699,441       $460,326         $432,500             177          75.0%              197                  1.2              99%             19
 Richmond Hill                     252          $165,676,118       $657,445         $595,000             577          56.5%              763                  1.8              98%             21
 Vaughan                           326          $207,061,259       $635,157         $560,000             603          57.6%              860                  2.1              97%             27
 Whitchurch-Stouffville             57           $38,035,711       $667,293         $505,000             121          57.1%              225                  3.0              97%             31
Durham Region                      967          $326,944,270       $338,102         $315,000            1,398         62.7%             1,958                 2.2              98%             26
 Ajax                              181           $67,917,696       $375,236         $357,500             236          66.6%              243                  1.6              99%             23
 Brock                              13            $3,325,500       $255,808         $260,000              39          41.1%              151                  8.5              96%             57
 Clarington                        127           $36,938,490       $290,854         $276,000             193          62.9%              325                  2.4              97%             32
 Oshawa                            257           $66,845,540       $260,099         $247,000             339          64.0%              442                  2.1              98%             27
 Pickering                         135           $53,116,925       $393,459         $380,000             207          60.6%              254                  2.0              99%             24
 Scugog                             37           $14,392,575       $388,989         $348,000              52          55.4%              130                  4.3              97%             52
 Uxbridge                           29           $13,944,550       $480,847         $455,000              53          52.1%              129                  4.6              98%             50
 Whitby                            188           $70,462,994       $374,803         $348,500             279          65.3%              284                  1.7              99%             17
Dufferin County                     70           $24,308,225       $347,260         $321,000             61           71.7%              105                  2.5              98%             32
 Orangeville                        70           $24,308,225       $347,260         $321,000             61           71.7%              105                  2.5              98%             32
Simcoe County                      186           $62,837,503       $337,836         $312,625             278          62.8%              640                  3.6              97%             50
  Adjala-Tosorontio                 16            $5,938,900       $371,181         $347,500              21          52.6%               87                  6.3              97%             67
  Bradford West Gwillimbury         47           $19,616,167       $417,365         $374,000              75          73.5%              104                  1.9              98%             32
  Essa                              26            $7,188,800       $276,492         $241,000              35          57.9%               98                  4.6              97%             64
  Innisfil                          63           $19,940,436       $316,515         $305,000              81          54.8%              203                  4.6              97%             59
  New Tecumseth                     34           $10,153,200       $298,624         $283,500              66          68.7%              148                  3.1              97%             37

                                                                                               Page 3                                                                                      July 2010
                                                                                                                                           Market Watch, July 2012                                  3
Toronto Real Estate Board


                                                                                                                                             ALL HOME TYPES, JULY 2012
SUMMARY OF EXISTING HOME TRANSACTIONS
                                                                                                                                CITY OF TORONTO MUNICIPAL BREAKDOWN
                                                          1                   1                  1                 2                  8                     3                                     4               5
                        Number of Sales   Dollar Volume       Average Price       Median Price       New Listings      SNLR (Trend)       Active Listings       Mos. Inv. (Trend)9   Avg. SP/LP        Avg. DOM

TREB Total                  7,570         $3,610,492,389        $476,947            $410,000              13,888          58.0%               20,318                   2.2              98%               26
City of Toronto Total       2,721         $1,363,040,705        $500,934            $410,000              5,537           55.5%               8,385                    2.3              98%               26
Toronto West                 705          $324,642,124          $460,485            $401,500              1,292           57.1%               2,020                    2.5              99%               27
 Toronto W01                  40           $19,989,350          $499,734            $404,950                93            53.0%                139                     2.3              100%              21
 Toronto W02                  50           $30,475,246          $609,505            $544,500                93            65.4%                108                     1.3              98%               20
 Toronto W03                  57           $21,944,000          $384,982            $397,000                81            67.9%                 95                     1.7              100%              25
 Toronto W04                  78           $29,914,511          $383,519            $403,500               120            58.3%                198                     2.6              98%               29
 Toronto W05                  94           $32,624,277          $347,067            $375,000               177            57.4%                315                     3.0              98%               29
 Toronto W06                 123           $55,606,165          $452,083            $399,900               249            46.3%                415                     3.4              98%               33
 Toronto W07                  19           $13,311,500          $700,605            $750,000                34            67.1%                 35                     1.4              101%              25
 Toronto W08                 108           $74,312,400          $688,078            $565,000               213            59.0%                349                     2.4              98%               27
 Toronto W09                  48           $18,877,815          $393,288            $399,500                75            57.0%                124                     2.7              98%               23
 Toronto W10                  88           $27,586,860          $313,487            $271,500               157            55.1%                242                     2.9              98%               22
Toronto Central             1,172         $679,569,290          $579,837            $424,500              2,727           52.2%               4,432                    2.5              98%               29
 Toronto C01                 337          $146,717,026          $435,362            $387,000               885            48.0%               1,435                    3.0              98%               31
 Toronto C02                  43           $42,797,500          $995,291            $800,000               104            48.5%                236                     3.4              97%               32
 Toronto C03                  41           $48,703,500         $1,187,890           $580,000                42            61.0%                 82                     2.1              96%               29
 Toronto C04                  58           $62,299,975         $1,074,138           $964,750               114            56.3%                191                     2.1              97%               26
 Toronto C06                  20           $10,724,990          $536,250            $582,500                43            55.4%                 74                     2.3              97%               32
 Toronto C07                  95           $49,558,868          $521,672            $378,000               242            51.3%                366                     2.3              98%               25
 Toronto C08                 122           $49,290,488          $404,020            $374,550               297            54.9%                455                     2.4              98%               30
 Toronto C09                  19           $18,193,000          $957,526            $731,000                27            57.3%                 56                     2.5              99%               25
 Toronto C10                  50           $28,713,189          $574,264            $449,250                83            63.2%                125                     1.6              98%               29
 Toronto C11                  40           $26,224,500          $655,613            $469,750                67            62.1%                 86                     1.9              98%               30
 Toronto C12                  27           $35,251,400         $1,305,607           $850,000                71            49.3%                157                     3.6              95%               42
 Toronto C13                  62           $34,583,817          $557,804            $420,750               136            60.5%                179                     1.8              99%               23
 Toronto C14                 122           $59,268,048          $485,804            $379,500               348            50.6%                574                     2.3              98%               25
 Toronto C15                 136           $67,242,989          $494,434            $416,250               268            50.8%                416                     2.4              98%               27
Toronto East                 844          $358,829,291          $425,153            $396,000              1,518           60.1%               1,933                    1.9              99%               22
 Toronto E01                  61           $33,148,955          $543,425            $530,000               110            61.9%                107                     1.5              101%              15
 Toronto E02                  73           $52,151,067          $714,398            $645,000                82            64.2%                 85                     1.3              100%              12
 Toronto E03                  85           $46,520,548          $547,301            $510,000               143            60.7%                167                     1.5              99%               18
 Toronto E04                 106           $36,206,215          $341,568            $344,000               180            60.4%                250                     2.0              100%              23
 Toronto E05                  92           $36,933,562          $401,452            $334,500               154            66.0%                183                     1.4              99%               21
 Toronto E06                  28           $13,275,500          $474,125            $419,250                58            56.8%                 61                     1.6              99%               21
 Toronto E07                  74           $26,090,780          $352,578            $356,000               190            56.8%                250                     2.3              99%               26
 Toronto E08                  59           $24,731,766          $419,182            $390,000                84            61.0%                126                     2.3              97%               32
 Toronto E09                 118           $37,390,222          $316,866            $321,400               226            56.0%                334                     2.4              99%               26
 Toronto E10                  61           $25,108,628          $411,617            $420,000               109            62.4%                129                     1.8              99%               19
 Toronto E11                  87           $27,272,048          $313,472            $285,000               182            56.6%                241                     2.3              98%               23


                                                                                                 Page 3                                                                                               July 2010
                                                                                                                                                  Market Watch, July 2012                                      4
Toronto Real Estate Board
                                                                                                      ALL HOME TYPES, YEAR-TO-DATE 2012
              SUMMARY OF EXISTING HOME TRANSACTIONS
                                                                                                                         ALL TREB AREAS
                                            Number of Sales   Dollar Volume1    Average Price1   Median Price1   New Listings2    Avg. SP/LP 4   Avg. DOM5

              TREB Total                        58,050        $29,095,333,243     $501,212         $421,000        104,424           99%            23
              Halton Region                     3,733         $2,089,110,904      $559,633         $472,000         6,332            98%            23
               Burlington                        516           $245,493,932       $475,763         $407,250          900             98%            27
               Halton Hills                      589           $272,981,000       $463,465         $430,000          846             98%            27
               Milton                           1,159          $535,276,170       $461,843         $430,000         1,920            99%            17
               Oakville                         1,469         $1,035,359,802      $704,806         $599,900         2,666            97%            26
              Peel Region                       12,701        $5,582,011,424      $439,494         $399,000         22,848           98%            22
               Brampton                          5,465        $2,209,962,591      $404,385         $383,000          9,808           98%            21
               Caledon                            539          $302,190,466       $560,650         $483,000           983            97%            31
               Mississauga                       6,697        $3,069,858,367      $458,393         $410,000         12,057           98%            21
              City of Toronto                   21,934        $11,997,812,778     $546,996         $429,000         42,022           100%           22

              ! TURN PAGE FOR CITY OF TORONTO
              TABLES OR CLICK HERE:

              York Region                       10,843        $6,441,500,441      $594,070         $538,888         19,335           99%            21
               Aurora                             623          $353,985,391       $568,195         $515,000           959            99%            19
               E. Gwillimbury                     213          $107,170,981       $503,150         $433,300           347            98%            30
               Georgina                           565          $177,143,990       $313,529         $292,000           897            98%            33
               King                               196          $159,000,179       $811,225         $699,950           383            96%            52
               Markham                           2,997        $1,817,930,410      $606,583         $553,000          5,438           100%           19
               Newmarket                         1,000         $449,203,794       $449,204         $425,000          1,420           99%            17
               Richmond Hill                     2,125        $1,412,860,310      $664,875         $603,000          4,109           99%            18
               Vaughan                           2,637        $1,664,880,750      $631,354         $577,000          4,865           99%            21
               Whitchurch-Stouffville             487          $299,324,636       $614,630         $527,500           917            98%            30
              Durham Region                     7,001         $2,350,733,258      $335,771         $312,500         11,031           98%            26
               Ajax                             1,330          $492,606,307       $370,381         $355,000          1,956           99%            21
               Brock                             126           $33,355,640        $264,727         $236,250           304            96%            79
               Clarington                       1,122          $328,920,681       $293,156         $274,900          1,735           98%            29
               Oshawa                           1,682          $432,783,640       $257,303         $243,000          2,563           98%            26
               Pickering                         915           $361,609,293       $395,201         $370,000          1,547           99%            23
               Scugog                            201           $75,734,358        $376,788         $330,000           386            97%            45
               Uxbridge                          207           $100,556,311       $485,779         $454,000           407            97%            45
               Whitby                           1,418          $525,167,028       $370,358         $349,900          2,133           99%            20
              Dufferin County                    428           $147,607,665       $344,878         $320,000          567             98%            37
               Orangeville                       428           $147,607,665       $344,878         $320,000          567             98%            37
              Simcoe County                     1,410          $486,556,773       $345,076         $318,000         2,289            98%            45
                Adjala-Tosorontio                 97            $41,186,350       $424,602         $402,250          202             97%            76
                Bradford West Gwillimbury        378           $155,665,025       $411,812         $380,838          524             98%            28
                Essa                             205            $59,901,366       $292,202         $260,000          359             98%            56
                Innisfil                         349           $110,069,284       $315,385         $297,000          649             97%            50
                New Tecumseth                    381           $119,734,748       $314,264         $290,000          555             98%            45

                                                                                       Page 3                                                                July 2010
                                                                                                                                 Market Watch, July 2012            5
Toronto Real Estate Board


                                                                                                     ALL HOME TYPES, YEAR-TO-DATE 2012
              SUMMARY OF EXISTING HOME TRANSACTIONS
                                                                                                CITY OF TORONTO MUNICIPAL BREAKDOWN
                                                                        1                   1                   1               2                 4              5
                                      Number of Sales   Dollar Volume       Average Price        Median Price       New Listings     Avg. SP/LP       Avg. DOM

              TREB Total                  58,050        $29,095,333,243       $501,212             $421,000           104,424           99%              23
              City of Toronto Total       21,934        $11,997,812,778       $546,996             $429,000            42,022           100%             22
              Toronto West                5,706         $2,714,878,789        $475,794             $415,000            10,321           100%             24
               Toronto W01                 365           $222,024,243         $608,286             $550,000              784            103%             17
               Toronto W02                 578           $357,278,756         $618,129             $580,150              884            104%             15
               Toronto W03                 508           $198,111,351         $389,983             $380,000              726            100%             21
               Toronto W04                 547           $204,603,874         $374,047             $365,000              944            99%              27
               Toronto W05                 709           $245,287,067         $345,962             $370,000             1,307           98%              30
               Toronto W06                 806           $364,467,492         $452,193             $423,000             1,827           99%              30
               Toronto W07                 204           $141,804,943         $695,122             $650,000              299            102%             18
               Toronto W08                1,060          $656,917,709         $619,734             $525,000             1,861           99%              24
               Toronto W09                 344           $145,150,265         $421,948             $442,217              613            99%              26
               Toronto W10                 585           $179,233,089         $306,381             $321,000             1,076           98%              25
              Toronto Central             9,868         $6,503,611,809        $659,061             $458,000            20,801           100%             23
               Toronto C01                2,566         $1,167,535,720        $455,002             $394,000             6,100           99%              26
               Toronto C02                 465           $467,108,001        $1,004,533            $807,000             1,017           99%              24
               Toronto C03                 366           $365,637,385         $999,009             $640,000              598            100%             20
               Toronto C04                 644           $718,709,213        $1,116,008           $1,030,000            1,161           101%             19
               Toronto C06                 216           $136,064,047         $629,926             $636,500              402            101%             21
               Toronto C07                 763           $449,364,547         $588,944             $457,000             1,639           99%              21
               Toronto C08                 975           $423,372,874         $434,229             $390,000             2,018           99%              24
               Toronto C09                 199           $257,158,956        $1,292,256            $915,000              356            98%              23
               Toronto C10                 453           $305,234,156         $673,806             $599,000              750            102%             16
               Toronto C11                 288           $190,710,900         $662,191             $382,307              475            101%             21
               Toronto C12                 283           $499,550,564        $1,765,196           $1,489,000             622            98%              29
               Toronto C13                 540           $318,654,901         $590,102             $450,000              954            102%             20
               Toronto C14                1,089          $653,186,131         $599,804             $431,800             2,534           100%             22
               Toronto C15                1,021          $551,324,414         $539,985             $420,800             2,175           100%             24
              Toronto East                6,360         $2,779,322,180        $437,000             $414,000            10,900           101%             20
               Toronto E01                 580           $336,729,801         $580,569             $556,228              921            104%             13
               Toronto E02                 519           $348,242,613         $670,988             $603,000              827            102%             12
               Toronto E03                 684           $367,591,142         $537,414             $510,750             1,162           103%             15
               Toronto E04                 737           $259,155,136         $351,635             $375,000             1,273           100%             23
               Toronto E05                 661           $273,114,833         $413,184             $368,000             1,062           101%             18
               Toronto E06                 260           $129,590,193         $498,424             $425,000              488            101%             17
               Toronto E07                 614           $223,488,082         $363,987             $319,919             1,092           101%             26
               Toronto E08                 424           $169,206,449         $399,072             $387,500              722            98%              25
               Toronto E09                 795           $258,106,978         $324,663             $320,000             1,465           99%              25
               Toronto E10                 461           $205,933,465         $446,710             $431,000              723            100%             19
               Toronto E11                 625           $208,163,488         $333,062             $320,000             1,165           99%              22


                                                                                   Page 3                                                                            July 2010
                                                                                                                                    Market Watch, July 2012                 6
Toronto Real Estate Board
                                                                                                                  DETACHED HOUSES, JULY 2012
                                                                                                                              Industrial Leasing
         SUMMARY OF EXISTING HOME TRANSACTIONS
                                                                                                                             ALL TREB AREAS
                                      Sales1   Dollar Volume1   Average Price1    Median Price1   New Listings2   Active Listings3   Avg. SP/LP 4   Avg. DOM5
        TREB Total                    3,581
                                         -     $2,148,132,149
                                                      -           $599,869
                                                                     -              $517,000
                                                                                       -             6,409
                                                                                                        -             9,580
                                                                                                                        -               98%
                                                                                                                                         -             26
                                                                                                                                                        -
        Halton Region                  277      $168,559,883      $608,519          $552,500          466              908              98%            26
         Burlington                     35       $20,126,700      $575,049          $562,500           64              159              98%            32
         Halton Hills                   57       $29,515,150      $517,810          $501,000           73              149              98%            30
         Milton                         89       $47,855,433      $537,701          $505,000          144              204              98%            20
         Oakville                       96
                                         -       $71,062,600
                                                      -           $740,235
                                                                     -              $645,000
                                                                                       -              185
                                                                                                        -              396
                                                                                                                        -               98%
                                                                                                                                         -             27
                                                                                                                                                        -
        Peel Region                    806     $459,375,685       $569,945          $520,500         1,569            2,152             98%            25
         Brampton                      419     $201,107,341       $479,970          $460,000          844             1,064             98%            25
         Caledon                        72      $42,945,800       $596,469          $547,500          105              257              97%            37
         Mississauga                   315
                                         -     $215,322,544
                                                     -            $683,564
                                                                     -              $607,000
                                                                                       -              620
                                                                                                       -               831
                                                                                                                        -               98%
                                                                                                                                         -             22
                                                                                                                                                        -
        City of Toronto                852     $641,071,616       $752,431          $589,500         1,548            1,993             98%            21

        ! TURN PAGE FOR CITY OF TORONTO
        TABLES OR CLICK HERE:
                                         -           -               -                 -                -                -               -              -
        York Region                    768     $552,534,994       $719,447          $655,450         1,529            2,358             97%            25
         Aurora                         50      $34,946,200       $698,924          $588,800           63              107              97%            26
         E. Gwillimbury                 28      $14,219,000       $507,821          $450,000           44               84              96%            23
         Georgina                       61      $18,746,815       $307,325          $275,500           93              235              97%            37
         King                           22      $16,945,425       $770,247          $677,500           52              133              96%            35
         Markham                       172     $135,842,650       $789,783          $718,500          369              462              98%            20
         Newmarket                      79      $40,401,041       $511,406          $475,000          109              130              99%            21
         Richmond Hill                 143     $119,232,118       $833,791          $760,000          362              497              98%            20
         Vaughan                       170     $139,692,934       $821,723          $699,500          338              509              97%            30
         Whitchurch-Stouffville         43
                                         -      $32,508,811
                                                     -            $756,019
                                                                     -              $576,000
                                                                                       -               99
                                                                                                        -              201
                                                                                                                         -              97%
                                                                                                                                         -             34
                                                                                                                                                        -
        Durham Region                  678     $254,403,418       $375,226          $360,000         1,010            1,507             98%            27
         Ajax                          114      $48,448,596       $424,988          $413,500          162              165              99%            22
         Brock                          12       $3,198,000       $266,500          $262,000           37              143              96%            61
         Clarington                     89      $28,045,840       $315,122          $299,900          136              246              97%            34
         Oshawa                        185      $53,757,088       $290,579          $279,000          249              321              98%            25
         Pickering                      86      $39,113,475       $454,808          $430,000          123              163              99%            24
         Scugog                         36      $14,150,575       $393,072          $349,000           49              128              97%            53
         Uxbridge                       26      $13,261,800       $510,069          $469,450           51              121              98%            51
         Whitby                        130
                                         -      $54,428,044
                                                      -           $418,677
                                                                     -              $385,000
                                                                                       -              203
                                                                                                        -              220
                                                                                                                        -               99%
                                                                                                                                         -             17
                                                                                                                                                        -
        Dufferin County                54       $20,499,200       $379,615          $338,000           51               81              98%            30
         Orangeville                   54
                                        -       $20,499,200
                                                     -            $379,615
                                                                     -              $338,000
                                                                                       -               51
                                                                                                        -               81
                                                                                                                         -              98%
                                                                                                                                         -             30
                                                                                                                                                        -
        Simcoe County                  146      $51,687,353       $354,023          $337,500          236              581              97%            56
          Adjala-Tosorontio             16       $5,938,900       $371,181          $347,500           21               87              97%            67
          Bradford West Gwillimbury     29      $13,783,017       $475,276          $417,500           65               99              97%            40
          Essa                          22       $6,195,900       $281,632          $241,000           30               91              96%            70
          Innisfil                      58      $18,877,936       $325,482          $322,250           77              198              97%            59
          New Tecumseth                 21       $6,891,600       $328,171          $305,000           43              106              97%            44

                                                                                 Page 3                                                                         July 2010
                                                                                                                             Market Watch, July 2012                   7
Toronto Real Estate Board

                                                                                                        DETACHED HOUSES, JULY 2012
                                                                                                                                       Industrial Leasing
         SUMMARY OF EXISTING HOME TRANSACTIONS
                                                                                             CITY OF TORONTO MUNICIPAL BREAKDOWN
                                 Sales1   Dollar Volume1   Average Price1    Median Price1    New Listings2   Active Listings3   Avg. SP/LP 4   Avg. DOM5
         TREB Total              3,581    $2,148,132,149     $599,869          $517,000          6,409            9,580             98%            26
         City of Toronto Total    852     $641,071,616       $752,431          $589,500          1,548            1,993             98%            21
         Toronto West             266     $174,284,441       $655,205          $530,000           436              556              99%            23
          Toronto W01              5        $4,283,000       $856,600          $600,500            17               21              98%            21
          Toronto W02              16      $14,143,000       $883,938          $863,000            29               33              98%            20
          Toronto W03              26      $10,749,500       $413,442          $404,750            42               50              100%           27
          Toronto W04              41      $19,524,611       $476,210          $452,000            64               90              98%            31
          Toronto W05              16       $8,490,800       $530,675          $495,000            37               56              98%            23
          Toronto W06              37      $22,179,215       $599,438          $503,000            52               55              98%            25
          Toronto W07              14      $10,726,500       $766,179          $764,750            23               25              101%           22
          Toronto W08              52      $55,166,000      $1,060,885         $947,500            74              110              98%            23
          Toronto W09              22      $12,187,815       $553,992          $559,000            26               34              99%            14
          Toronto W10              37      $16,834,000       $454,973          $435,000            72               82              97%            17
         Toronto Central          226     $266,400,113      $1,178,762         $941,088           469              751              97%            24
          Toronto C01              4        $3,634,500       $908,625          $807,250            11               12              105%           30
          Toronto C02              10      $13,479,000      $1,347,900        $1,375,000           8                21              97%            25
          Toronto C03              25      $39,976,000      $1,599,040        $1,008,000           26               48              96%            31
          Toronto C04              40      $50,897,175      $1,272,429        $1,102,500           71              117              97%            24
          Toronto C06              10       $7,556,500       $755,650          $702,000            19               31              98%            26
          Toronto C07              29      $25,386,650       $875,402          $797,800            85              128              99%            18
          Toronto C08               -            -               -                 -               2                5                 -             -
          Toronto C09              5        $9,018,000      $1,803,600        $1,900,000           7                19              98%            24
          Toronto C10              7        $6,529,500       $932,786          $837,500            11               16              97%            17
          Toronto C11              15      $18,413,000      $1,227,533        $1,272,000           17               16              97%            22
          Toronto C12              13      $26,479,000      $2,036,846        $2,100,000           46              112              95%            60
          Toronto C13              22      $21,050,200       $956,827          $763,250            43               49              99%            19
          Toronto C14              16      $17,782,000      $1,111,375        $1,086,000           64              109              96%            24
          Toronto C15              30      $26,198,588       $873,286          $852,500            59               68              97%            17
         Toronto East             360     $200,387,062       $556,631          $485,250           643              686              99%            17
          Toronto E01              13       $8,518,900       $655,300          $700,900            17               15              101%           22
          Toronto E02              31      $28,229,900       $910,642          $830,000            42               38              99%            15
          Toronto E03              59      $35,372,048       $599,526          $540,000            83               91              99%            18
          Toronto E04              43      $19,697,277       $458,076          $446,000            84               78              101%           9
          Toronto E05              26      $16,813,500       $646,673          $680,000            36               41              99%            17
          Toronto E06              26      $12,615,500       $485,212          $421,750            52               52              99%            20
          Toronto E07              20      $10,453,600       $522,680          $526,000            68               74              99%            19
          Toronto E08              30      $18,084,066       $602,802          $496,183            43               54              97%            24
          Toronto E09              52      $20,989,572       $403,646          $401,000            81               83              100%           16
          Toronto E10              36      $18,368,800       $510,244          $486,500            79               89              100%           15
          Toronto E11              24      $11,243,899       $468,496          $442,500            58               71              98%            26


                                                                            Page 3                                                                          July 2010
                                                                                                                       Market Watch, July 2012                     8
Toronto Real Estate Board
                                                                                                            SEMI-DETACHED HOUSES, JULY 2012
                                                                                                                             Industrial Leasing
         SUMMARY OF EXISTING HOME TRANSACTIONS
                                                                                                                            ALL TREB AREAS
                                      Sales1   Dollar Volume1   Average Price1    Median Price1   New Listings2   Active Listings3   Avg. SP/LP 4   Avg. DOM5
        TREB Total                     781
                                         -     $341,640,534
                                                     -            $437,440
                                                                     -              $415,000
                                                                                       -             1,287
                                                                                                        -             1,261
                                                                                                                         -              99%
                                                                                                                                          -            18
                                                                                                                                                        -
        Halton Region                   39     $15,826,788        $405,815          $405,000           64               64              99%            14
         Burlington                     5       $1,916,000        $383,200          $379,000           9                7               100%           22
         Halton Hills                   4       $1,330,000        $332,500          $352,500           4                3               98%            15
         Milton                         23      $9,636,288        $418,969          $417,000           40               40              99%            13
         Oakville                       7-      $2,944,500
                                                     -            $420,643
                                                                     -              $407,000
                                                                                       -               11
                                                                                                        -               14
                                                                                                                         -              99%
                                                                                                                                          -            14
                                                                                                                                                        -
        Peel Region                    314     $123,805,717       $394,286          $385,000          556              515              98%            19
         Brampton                      161      $57,687,401       $358,307          $354,000          319              316              98%            20
         Caledon                        11       $4,482,500       $407,500          $405,500           7                4               100%           13
         Mississauga                   142
                                         -      $61,635,816
                                                      -           $434,055
                                                                     -              $432,500
                                                                                       -              230
                                                                                                       -               195
                                                                                                                        -               98%
                                                                                                                                          -            18
                                                                                                                                                        -
        City of Toronto                272     $143,338,171       $526,979          $487,650          417              424              100%           17

        ! TURN PAGE FOR CITY OF TORONTO
        TABLES OR CLICK HERE:
                                        -             -              -                 -                -                -                -             -
        York Region                    85       $39,845,988       $468,776          $474,000          158              164              99%            14
         Aurora                        7         $2,707,000       $386,714          $390,500           10               7               100%           17
         E. Gwillimbury                 -             -              -                 -                -                -                -             -
         Georgina                      1          $312,000        $312,000          $312,000           2                1               99%            5
         King                           -             -              -                 -                -                -                -             -
         Markham                       28       $13,659,488       $487,839          $475,944           47               47              100%           14
         Newmarket                     11        $4,098,400       $372,582          $382,000           25               28              99%            18
         Richmond Hill                 6         $2,808,000       $468,000          $490,000           19               21              100%           12
         Vaughan                       28       $14,615,600       $521,986          $526,250           46               49              98%            13
         Whitchurch-Stouffville        4-        $1,645,500
                                                      -           $411,375
                                                                     -              $406,250
                                                                                       -               9-               11
                                                                                                                         -              100%
                                                                                                                                          -            14
                                                                                                                                                        -
        Durham Region                  64       $16,899,870       $264,060          $273,450           79               81              99%            20
         Ajax                          17        $5,702,800       $335,459          $334,900           23               17              100%           15
         Brock                         1          $127,500        $127,500          $127,500           1                1               95%            12
         Clarington                    3          $574,000        $191,333          $205,000           7                6               97%            11
         Oshawa                        25        $4,941,920       $197,677          $200,000           30               43              98%            25
         Pickering                     13        $4,170,500       $320,808          $315,000           12               11              99%            25
         Scugog                        1          $242,000        $242,000          $242,000           2                1               99%            8
         Uxbridge                       -             -              -                 -                -                -                -             -
         Whitby                        4-        $1,141,150
                                                      -           $285,288
                                                                     -              $279,625
                                                                                       -               4-               2-              98%
                                                                                                                                          -            8-
        Dufferin County                 4        $918,250         $229,563          $232,875           6                 5              97%            20
         Orangeville                    4
                                        -        $918,250
                                                    -             $229,563
                                                                     -              $232,875
                                                                                       -               6
                                                                                                       -                 5
                                                                                                                         -              97%
                                                                                                                                         -             20
                                                                                                                                                        -
        Simcoe County                   3       $1,005,750        $335,250          $355,000           7                 8              99%            12
          Adjala-Tosorontio             -            -               -                 -               -                 -               -              -
          Bradford West Gwillimbury     3       $1,005,750        $335,250          $355,000           3                 3              99%            12
          Essa                          -            -               -                 -               1                 1               -              -
          Innisfil                      -            -               -                 -               -                 -               -              -
          New Tecumseth                 -            -               -                 -               3                 4               -              -

                                                                                 Page 3                                                                         July 2010
                                                                                                                             Market Watch, July 2012                   9
Toronto Real Estate Board

                                                                                                   SEMI-DETACHED HOUSES, JULY 2012
                                                                                                                                       Industrial Leasing
         SUMMARY OF EXISTING HOME TRANSACTIONS
                                                                                             CITY OF TORONTO MUNICIPAL BREAKDOWN
                                 Sales1   Dollar Volume1   Average Price1    Median Price1    New Listings2   Active Listings3   Avg. SP/LP 4   Avg. DOM5
         TREB Total               781     $341,640,534       $437,440          $415,000          1,287            1,261             99%            18
         City of Toronto Total    272     $143,338,171       $526,979          $487,650           417              424              100%           17
         Toronto West             91       $43,711,235       $480,343          $426,500           129              148              100%           19
          Toronto W01             8         $5,992,800       $749,100          $731,450            8                6               105%           11
          Toronto W02             14        $7,858,658       $561,333          $544,500            20               20              98%            16
          Toronto W03             18        $7,400,500       $411,139          $416,000            25               30              100%           19
          Toronto W04             7         $3,253,000       $464,714          $445,000            6                7               102%           23
          Toronto W05             34       $14,328,277       $421,420          $399,950            50               67              98%            23
          Toronto W06             4         $2,508,500       $627,125          $615,750            8                9               99%            27
          Toronto W07              -             -              -                 -                 -                -                -             -
          Toronto W08              -             -              -                 -                1                1                 -             -
          Toronto W09             2          $829,000        $414,500          $414,500            4                3               99%            10
          Toronto W10             4         $1,540,500       $385,125          $377,000            7                5               99%            8
         Toronto Central          72       $44,664,046       $620,334          $583,000           109              118              99%            21
          Toronto C01             13        $9,151,518       $703,963          $640,500            23               22              99%            16
          Toronto C02             4         $4,535,000      $1,133,750        $1,130,000           11               20              98%            35
          Toronto C03             10        $4,849,500       $484,950          $459,500            7                6               99%            20
          Toronto C04             7         $5,325,500       $760,786          $718,000            7                4               100%           12
          Toronto C06              -             -               -                 -               1                1                 -             -
          Toronto C07             5         $2,622,300       $524,460          $520,000            7                9               98%            24
          Toronto C08             1          $650,000        $650,000          $650,000            4                7               100%           15
          Toronto C09              -             -               -                 -               4                5                 -             -
          Toronto C10             3         $2,112,888       $704,296          $718,888            2                6               97%            44
          Toronto C11             4         $2,598,000       $649,500          $627,500            6                3               97%            21
          Toronto C12             2         $1,261,500       $630,750          $630,750            2                 -              102%           6
          Toronto C13             6         $2,748,540       $458,090          $443,220            11               15              100%           20
          Toronto C14              -             -               -                 -                -                -                -             -
          Toronto C15             17        $8,809,300       $518,194          $513,000            24               20              98%            23
         Toronto East             109      $54,962,890       $504,247          $458,000           179              158              101%           13
          Toronto E01              29      $16,635,955       $573,654          $570,000            45               30              103%           12
          Toronto E02              25      $14,023,617       $560,945          $550,000            25               18              102%           10
          Toronto E03              17       $9,361,000       $550,647          $540,000            30               28              100%           14
          Toronto E04              8        $2,867,988       $358,499          $344,000            13               12              100%           20
          Toronto E05              3        $1,339,500       $446,500          $456,000            11               13              99%            9
          Toronto E06              1         $425,000        $425,000          $425,000            4                5               98%            43
          Toronto E07              9        $3,768,180       $418,687          $410,800            15               17              102%           13
          Toronto E08               -            -              -                 -                1                1                 -             -
          Toronto E09              2         $685,000        $342,500          $342,500            7                6               97%            22
          Toronto E10              4        $1,570,500       $392,625          $416,250            2                3               101%           12
          Toronto E11              11       $4,286,150       $389,650          $415,000            26               25              99%            10


                                                                            Page 3                                                                          July 2010
                                                                                                                       Market Watch, July 2012                    10
Toronto Real Estate Board
                                                                                                  CONDOMINIUM TOWNHOUSES, JULY 2012
                                                                                                                     Industrial Leasing
         SUMMARY OF EXISTING HOME TRANSACTIONS
                                                                                                                    ALL TREB AREAS
                                      Sales1   Dollar Volume1   Average Price1    Median Price1    New Listings2   Active Listings3   Avg. SP/LP 4   Avg. DOM5
        TREB Total                     681
                                         -     $221,581,197
                                                     -            $325,376
                                                                     -              $317,000
                                                                                       -               901
                                                                                                         -             1,194
                                                                                                                          -              98%
                                                                                                                                          -             25
                                                                                                                                                         -
        Halton Region                   40     $14,040,000        $351,000          $331,000            49               65              99%            24
         Burlington                     16      $5,542,500        $346,406          $331,000            20               20              99%            31
         Halton Hills                   8       $1,793,200        $224,150          $233,450            11               10              99%            18
         Milton                         2        $550,000         $275,000          $275,000            4                4               99%            18
         Oakville                       14
                                         -      $6,154,300
                                                     -            $439,593
                                                                     -              $414,250
                                                                                       -                14
                                                                                                         -               31
                                                                                                                          -              98%
                                                                                                                                          -             21
                                                                                                                                                         -
        Peel Region                    257      $84,493,989       $328,770          $323,000           335              394              98%            23
         Brampton                       59      $15,209,402       $257,786          $237,100            77               94              98%            24
         Caledon                         -           -               -                 -                1                4                -              -
         Mississauga                   198
                                         -      $69,284,587
                                                     -            $349,922
                                                                     -              $342,250
                                                                                       -               257
                                                                                                         -              296
                                                                                                                          -              98%
                                                                                                                                          -             23
                                                                                                                                                         -
        City of Toronto                228      $79,044,601       $346,687          $330,450           322              476              99%            25

        ! TURN PAGE FOR CITY OF TORONTO
        TABLES OR CLICK HERE:
                                        -             -              -                 -                 -                -               -              -
        York Region                    71       $26,813,200       $377,651          $370,000           101              129              98%            26
         Aurora                        3          $996,000        $332,000          $333,500            11               16              97%            17
         E. Gwillimbury                 -             -              -                 -                 -                -               -              -
         Georgina                      2          $650,900        $325,450          $325,450             -                -              97%            57
         King                           -             -              -                 -                 -                -               -              -
         Markham                       31       $11,868,200       $382,845          $365,000            53               66              98%            24
         Newmarket                     8         $2,363,400       $295,425          $291,250            7                9               98%            27
         Richmond Hill                 16        $6,576,700       $411,044          $422,000            21               24              98%            20
         Vaughan                       9         $3,716,500       $412,944          $418,000            9                14              97%            33
         Whitchurch-Stouffville        2-         $641,500
                                                      -           $320,750
                                                                     -              $320,750
                                                                                       -                 -
                                                                                                         -                -
                                                                                                                          -              98%
                                                                                                                                          -             43
                                                                                                                                                         -
        Durham Region                  77       $15,685,332       $203,706          $213,000            86              119              98%            33
         Ajax                          16        $3,875,800       $242,238          $244,000            13               15              98%            25
         Brock                          -             -              -                 -                1                7                -              -
         Clarington                    5         $1,067,900       $213,580          $169,900            6                10              98%            53
         Oshawa                        28        $4,020,032       $143,573          $141,000            31               39              98%            42
         Pickering                     15        $3,796,100       $253,073          $245,000            25               31              98%            23
         Scugog                         -             -              -                 -                 -                -               -              -
         Uxbridge                      1          $280,000        $280,000          $280,000            2                6               99%            59
         Whitby                        12
                                        -        $2,645,500
                                                      -           $220,458
                                                                     -              $223,000
                                                                                       -                8-               11
                                                                                                                          -              98%
                                                                                                                                          -             26
                                                                                                                                                         -
        Dufferin County                 4        $662,475         $165,619          $169,738            3                 5              93%            17
         Orangeville                    4
                                        -        $662,475
                                                    -             $165,619
                                                                     -              $169,738
                                                                                       -                3
                                                                                                        -                 5
                                                                                                                          -              93%
                                                                                                                                          -             17
                                                                                                                                                         -
        Simcoe County                   4        $841,600         $210,400          $204,800            5                 6              98%            20
          Adjala-Tosorontio             -           -                -                 -                -                 -               -              -
          Bradford West Gwillimbury     2        $471,000         $235,500          $235,500            2                 1              99%            19
          Essa                          -           -                -                 -                -                 -               -              -
          Innisfil                      -           -                -                 -                -                 -               -              -
          New Tecumseth                 2        $370,600         $185,300          $185,300            3                 5              97%            21

                                                                                 Page 3                                                                          July 2010
                                                                                                                              Market Watch, July 2012                  11
Toronto Real Estate Board

                                                                                             CONDOMINIUM TOWNHOUSES, JULY 2012
                                                                                                                                       Industrial Leasing
         SUMMARY OF EXISTING HOME TRANSACTIONS
                                                                                             CITY OF TORONTO MUNICIPAL BREAKDOWN
                                 Sales1   Dollar Volume1   Average Price1    Median Price1    New Listings2   Active Listings3   Avg. SP/LP 4   Avg. DOM5
         TREB Total               681     $221,581,197       $325,376          $317,000           901             1,194             98%            25
         City of Toronto Total    228      $79,044,601       $346,687          $330,450           322              476              99%            25
         Toronto West             61       $17,469,550       $286,386          $262,000            80              116              99%            28
          Toronto W01             4         $1,590,150       $397,538          $379,125            5                7               98%            25
          Toronto W02             4         $1,586,300       $396,575          $394,200            9                8               100%           10
          Toronto W03              -             -              -                 -                1                1                 -             -
          Toronto W04             12        $3,395,500       $282,958          $266,000            12               14              98%            26
          Toronto W05             15        $3,165,600       $211,040          $198,000            28               49              97%            32
          Toronto W06             3         $1,460,000       $486,667          $510,000            5                9               98%            11
          Toronto W07             1          $268,000        $268,000          $268,000            1                1               97%            12
          Toronto W08             9         $3,047,500       $338,611          $315,000            7                6               102%           36
          Toronto W09             3         $1,003,000       $334,333          $335,000            4                7               98%            22
          Toronto W10             10        $1,953,500       $195,350          $224,000            8                14              97%            35
         Toronto Central          90       $38,940,118       $432,668          $409,500           126              190              99%            21
          Toronto C01             20       $10,294,300       $514,715          $508,500            30               41              98%            21
          Toronto C02             1          $778,000        $778,000          $778,000            2                14              99%            39
          Toronto C03              -             -              -                 -                 -               3                 -             -
          Toronto C04              -             -              -                 -                1                1                 -             -
          Toronto C06              -             -              -                 -                 -               2                 -             -
          Toronto C07             6         $2,247,218       $374,536          $371,259            11               16              100%           22
          Toronto C08             5         $2,050,900       $410,180          $379,000            16               17              99%            17
          Toronto C09             1          $755,000        $755,000          $755,000            1                3               101%           17
          Toronto C10             4         $2,380,500       $595,125          $596,500            3                6               98%            10
          Toronto C11             6         $1,825,000       $304,167          $298,250            8                4               103%           22
          Toronto C12             2         $1,181,000       $590,500          $590,500            3                10              95%            40
          Toronto C13             3         $1,241,000       $413,667          $400,000            3                3               99%            11
          Toronto C14             10        $3,746,500       $374,650          $354,000            15               25              100%           27
          Toronto C15             32       $12,440,700       $388,772          $382,500            33               45              99%            20
         Toronto East             77       $22,634,933       $293,960          $295,800           116              170              98%            27
          Toronto E01             2          $753,900        $376,950          $376,950            4                4               99%            9
          Toronto E02             1          $642,000        $642,000          $642,000            1                6               99%            23
          Toronto E03              -             -              -                 -                2                4                -              -
          Toronto E04             16        $5,327,550       $332,972          $332,200            14               17              98%            24
          Toronto E05             16        $5,032,784       $314,549          $316,000            24               35              99%            18
          Toronto E06              -             -              -                 -                 -                -               -              -
          Toronto E07             5         $1,564,800       $312,960          $308,000            10               16              97%            36
          Toronto E08             8         $2,251,900       $281,488          $286,450            10               12              98%            39
          Toronto E09             6         $1,245,000       $207,500          $220,000            13               21              99%            25
          Toronto E10             7         $1,607,000       $229,571          $210,000            13               16              97%            47
          Toronto E11             16        $4,209,999       $263,125          $259,000            25               39              97%            24


                                                                            Page 3                                                                          July 2010
                                                                                                                       Market Watch, July 2012                    12
Greater Toronto REALTORS Release Market Watch for July 2012

More Related Content

More from Richard Silver, Certified International REALTOR®

More from Richard Silver, Certified International REALTOR® (20)

FIABCI USA International Symposium : Gateway Cities 2017
 FIABCI USA International Symposium : Gateway Cities 2017 FIABCI USA International Symposium : Gateway Cities 2017
FIABCI USA International Symposium : Gateway Cities 2017
 
Torontoism Team at Sotheby's International Realty Canada
Torontoism Team at Sotheby's International Realty CanadaTorontoism Team at Sotheby's International Realty Canada
Torontoism Team at Sotheby's International Realty Canada
 
Emerge Presentation 2016
Emerge Presentation 2016Emerge Presentation 2016
Emerge Presentation 2016
 
Becoming Paperless for Real Estate:
Becoming Paperless for Real Estate: Becoming Paperless for Real Estate:
Becoming Paperless for Real Estate:
 
Becoming Paperless
Becoming PaperlessBecoming Paperless
Becoming Paperless
 
Asia Trip 2015
Asia Trip 2015 Asia Trip 2015
Asia Trip 2015
 
10 things international buyers should know
10 things international buyers should know10 things international buyers should know
10 things international buyers should know
 
Becoming paperless for Ontario REALTORS
Becoming paperless for Ontario REALTORSBecoming paperless for Ontario REALTORS
Becoming paperless for Ontario REALTORS
 
Gander 2015 Presentation
Gander 2015 PresentationGander 2015 Presentation
Gander 2015 Presentation
 
RETechTalk 2015 Apps.
RETechTalk 2015 Apps.RETechTalk 2015 Apps.
RETechTalk 2015 Apps.
 
Top Tier Trends Across Canada
Top Tier Trends Across CanadaTop Tier Trends Across Canada
Top Tier Trends Across Canada
 
Toronto Central Community Market Charts for the 4th Quarter 2012
Toronto Central Community Market Charts for the 4th Quarter 2012Toronto Central Community Market Charts for the 4th Quarter 2012
Toronto Central Community Market Charts for the 4th Quarter 2012
 
Casey House Celebrates 25 Years!!
Casey House Celebrates 25 Years!! Casey House Celebrates 25 Years!!
Casey House Celebrates 25 Years!!
 
Yorkville Hazelton Heritage Conservation District
Yorkville Hazelton Heritage Conservation DistrictYorkville Hazelton Heritage Conservation District
Yorkville Hazelton Heritage Conservation District
 
Market Watch for January 2013
Market Watch for January 2013Market Watch for January 2013
Market Watch for January 2013
 
Toronto REALTORS Rental Market Report 4th Quarter 2012. Toronto Real Estate B...
Toronto REALTORS Rental Market Report 4th Quarter 2012. Toronto Real Estate B...Toronto REALTORS Rental Market Report 4th Quarter 2012. Toronto Real Estate B...
Toronto REALTORS Rental Market Report 4th Quarter 2012. Toronto Real Estate B...
 
Greater Toronto REALTORS 4Th Quarter Condo Sales 2012. Condominium Sales in T...
Greater Toronto REALTORS 4Th Quarter Condo Sales 2012. Condominium Sales in T...Greater Toronto REALTORS 4Th Quarter Condo Sales 2012. Condominium Sales in T...
Greater Toronto REALTORS 4Th Quarter Condo Sales 2012. Condominium Sales in T...
 
Market Watch December 2012
Market Watch December 2012Market Watch December 2012
Market Watch December 2012
 
TREB Housing Market Charts for December 2012
TREB Housing Market Charts for December 2012TREB Housing Market Charts for December 2012
TREB Housing Market Charts for December 2012
 
International Buyer/Seller Referral Form
International Buyer/Seller Referral FormInternational Buyer/Seller Referral Form
International Buyer/Seller Referral Form
 

Recently uploaded

Low Rate ↬Call Girls in Trilokpuri Delhi ↫8447779280}Escorts Service In Delhi
Low Rate ↬Call Girls in Trilokpuri Delhi ↫8447779280}Escorts Service In DelhiLow Rate ↬Call Girls in Trilokpuri Delhi ↫8447779280}Escorts Service In Delhi
Low Rate ↬Call Girls in Trilokpuri Delhi ↫8447779280}Escorts Service In Delhiasmaqueen5
 
2k Shot Call girls Karol Bagh Delhi 9205541914
2k Shot Call girls Karol Bagh Delhi 92055419142k Shot Call girls Karol Bagh Delhi 9205541914
2k Shot Call girls Karol Bagh Delhi 9205541914Delhi Call girls
 
Call Girls In Laxmi Nagar Delhi +91-8447779280! !Best Woman Seeking Man Escor...
Call Girls In Laxmi Nagar Delhi +91-8447779280! !Best Woman Seeking Man Escor...Call Girls In Laxmi Nagar Delhi +91-8447779280! !Best Woman Seeking Man Escor...
Call Girls In Laxmi Nagar Delhi +91-8447779280! !Best Woman Seeking Man Escor...asmaqueen5
 
M3M 129 E Brochure Noida Expressway, Sector 129, Noida
M3M 129 E Brochure Noida Expressway, Sector 129, NoidaM3M 129 E Brochure Noida Expressway, Sector 129, Noida
M3M 129 E Brochure Noida Expressway, Sector 129, Noidasarak0han45400
 
Listing Turkey Sylvana Istanbul - Bahcesehir
Listing Turkey Sylvana Istanbul - BahcesehirListing Turkey Sylvana Istanbul - Bahcesehir
Listing Turkey Sylvana Istanbul - BahcesehirListing Turkey
 
Maha Mauka Squarefeet Brochure |Maha Mauka Squarefeet PDF Brochure|
Maha Mauka Squarefeet Brochure |Maha Mauka Squarefeet PDF Brochure|Maha Mauka Squarefeet Brochure |Maha Mauka Squarefeet PDF Brochure|
Maha Mauka Squarefeet Brochure |Maha Mauka Squarefeet PDF Brochure|AkshayJoshi575980
 
TENANT SCREENING REPORT SERVICES​ How Tenant Screening Reports Work
TENANT SCREENING REPORT SERVICES​ How Tenant Screening Reports WorkTENANT SCREENING REPORT SERVICES​ How Tenant Screening Reports Work
TENANT SCREENING REPORT SERVICES​ How Tenant Screening Reports WorkTurbo Tenant
 
Girls in Kalyanpuri }Delhi↫8447779280↬Escort Service. In Delhi NCR
Girls in Kalyanpuri }Delhi↫8447779280↬Escort Service. In Delhi NCRGirls in Kalyanpuri }Delhi↫8447779280↬Escort Service. In Delhi NCR
Girls in Kalyanpuri }Delhi↫8447779280↬Escort Service. In Delhi NCRasmaqueen5
 
Premium Villa Projects in Sarjapur Road Bengaluru
Premium Villa Projects in Sarjapur Road BengaluruPremium Villa Projects in Sarjapur Road Bengaluru
Premium Villa Projects in Sarjapur Road BengaluruShivaSeo3
 
Call Girls in Noida Sector 11 Noida 💯Call Us 🔝 9582086666 🔝 South Delhi Escor...
Call Girls in Noida Sector 11 Noida 💯Call Us 🔝 9582086666 🔝 South Delhi Escor...Call Girls in Noida Sector 11 Noida 💯Call Us 🔝 9582086666 🔝 South Delhi Escor...
Call Girls in Noida Sector 11 Noida 💯Call Us 🔝 9582086666 🔝 South Delhi Escor...delhimodel235
 
9990771857 Call Girls in Dwarka Sector 3 Delhi (Call Girls) Delhi
9990771857 Call Girls in Dwarka Sector 3 Delhi (Call Girls) Delhi9990771857 Call Girls in Dwarka Sector 3 Delhi (Call Girls) Delhi
9990771857 Call Girls in Dwarka Sector 3 Delhi (Call Girls) Delhidelhimodel235
 
9990771857 Call Girls in Dwarka Sector 1 Delhi (Call Girls) Delhi
9990771857 Call Girls in Dwarka Sector 1 Delhi (Call Girls) Delhi9990771857 Call Girls in Dwarka Sector 1 Delhi (Call Girls) Delhi
9990771857 Call Girls in Dwarka Sector 1 Delhi (Call Girls) Delhidelhimodel235
 
3D Architectural Rendering Company by Panoram CGI
3D Architectural Rendering Company by Panoram CGI3D Architectural Rendering Company by Panoram CGI
3D Architectural Rendering Company by Panoram CGIPanoram CGI
 
Properties for Sale in Istanbul with Schools and Parks | Antalya Development
Properties for Sale in Istanbul with Schools and Parks | Antalya DevelopmentProperties for Sale in Istanbul with Schools and Parks | Antalya Development
Properties for Sale in Istanbul with Schools and Parks | Antalya DevelopmentAntalya Development
 
Majestique Viman Nagar Pune Brochure.pdf
Majestique Viman Nagar Pune Brochure.pdfMajestique Viman Nagar Pune Brochure.pdf
Majestique Viman Nagar Pune Brochure.pdfBabyrudram
 
Call Girls in Noida Sector 77 Noida 💯Call Us 🔝 9582086666 🔝 South Delhi Escor...
Call Girls in Noida Sector 77 Noida 💯Call Us 🔝 9582086666 🔝 South Delhi Escor...Call Girls in Noida Sector 77 Noida 💯Call Us 🔝 9582086666 🔝 South Delhi Escor...
Call Girls in Noida Sector 77 Noida 💯Call Us 🔝 9582086666 🔝 South Delhi Escor...delhimodel235
 
Call Girls in shastri nagar Delhi 8264348440 ✅ call girls ❤️
Call Girls in shastri nagar Delhi 8264348440 ✅ call girls ❤️Call Girls in shastri nagar Delhi 8264348440 ✅ call girls ❤️
Call Girls in shastri nagar Delhi 8264348440 ✅ call girls ❤️soniya singh
 
Call Girls In Vasant Vihar Delhi 💯Call Us 🔝8264348440🔝
Call Girls In Vasant Vihar Delhi 💯Call Us 🔝8264348440🔝Call Girls In Vasant Vihar Delhi 💯Call Us 🔝8264348440🔝
Call Girls In Vasant Vihar Delhi 💯Call Us 🔝8264348440🔝soniya singh
 
Call Girls In Mayur Vihar Delhi ☆↫8447779280 ❤Escorts Service In Delhi
Call Girls In Mayur Vihar Delhi ☆↫8447779280 ❤Escorts Service In DelhiCall Girls In Mayur Vihar Delhi ☆↫8447779280 ❤Escorts Service In Delhi
Call Girls In Mayur Vihar Delhi ☆↫8447779280 ❤Escorts Service In Delhiasmaqueen5
 
BDSM⚡Call Girls in Sector 57 Noida Escorts >༒8448380779 Escort Service
BDSM⚡Call Girls in Sector 57 Noida Escorts >༒8448380779 Escort ServiceBDSM⚡Call Girls in Sector 57 Noida Escorts >༒8448380779 Escort Service
BDSM⚡Call Girls in Sector 57 Noida Escorts >༒8448380779 Escort ServiceDelhi Call girls
 

Recently uploaded (20)

Low Rate ↬Call Girls in Trilokpuri Delhi ↫8447779280}Escorts Service In Delhi
Low Rate ↬Call Girls in Trilokpuri Delhi ↫8447779280}Escorts Service In DelhiLow Rate ↬Call Girls in Trilokpuri Delhi ↫8447779280}Escorts Service In Delhi
Low Rate ↬Call Girls in Trilokpuri Delhi ↫8447779280}Escorts Service In Delhi
 
2k Shot Call girls Karol Bagh Delhi 9205541914
2k Shot Call girls Karol Bagh Delhi 92055419142k Shot Call girls Karol Bagh Delhi 9205541914
2k Shot Call girls Karol Bagh Delhi 9205541914
 
Call Girls In Laxmi Nagar Delhi +91-8447779280! !Best Woman Seeking Man Escor...
Call Girls In Laxmi Nagar Delhi +91-8447779280! !Best Woman Seeking Man Escor...Call Girls In Laxmi Nagar Delhi +91-8447779280! !Best Woman Seeking Man Escor...
Call Girls In Laxmi Nagar Delhi +91-8447779280! !Best Woman Seeking Man Escor...
 
M3M 129 E Brochure Noida Expressway, Sector 129, Noida
M3M 129 E Brochure Noida Expressway, Sector 129, NoidaM3M 129 E Brochure Noida Expressway, Sector 129, Noida
M3M 129 E Brochure Noida Expressway, Sector 129, Noida
 
Listing Turkey Sylvana Istanbul - Bahcesehir
Listing Turkey Sylvana Istanbul - BahcesehirListing Turkey Sylvana Istanbul - Bahcesehir
Listing Turkey Sylvana Istanbul - Bahcesehir
 
Maha Mauka Squarefeet Brochure |Maha Mauka Squarefeet PDF Brochure|
Maha Mauka Squarefeet Brochure |Maha Mauka Squarefeet PDF Brochure|Maha Mauka Squarefeet Brochure |Maha Mauka Squarefeet PDF Brochure|
Maha Mauka Squarefeet Brochure |Maha Mauka Squarefeet PDF Brochure|
 
TENANT SCREENING REPORT SERVICES​ How Tenant Screening Reports Work
TENANT SCREENING REPORT SERVICES​ How Tenant Screening Reports WorkTENANT SCREENING REPORT SERVICES​ How Tenant Screening Reports Work
TENANT SCREENING REPORT SERVICES​ How Tenant Screening Reports Work
 
Girls in Kalyanpuri }Delhi↫8447779280↬Escort Service. In Delhi NCR
Girls in Kalyanpuri }Delhi↫8447779280↬Escort Service. In Delhi NCRGirls in Kalyanpuri }Delhi↫8447779280↬Escort Service. In Delhi NCR
Girls in Kalyanpuri }Delhi↫8447779280↬Escort Service. In Delhi NCR
 
Premium Villa Projects in Sarjapur Road Bengaluru
Premium Villa Projects in Sarjapur Road BengaluruPremium Villa Projects in Sarjapur Road Bengaluru
Premium Villa Projects in Sarjapur Road Bengaluru
 
Call Girls in Noida Sector 11 Noida 💯Call Us 🔝 9582086666 🔝 South Delhi Escor...
Call Girls in Noida Sector 11 Noida 💯Call Us 🔝 9582086666 🔝 South Delhi Escor...Call Girls in Noida Sector 11 Noida 💯Call Us 🔝 9582086666 🔝 South Delhi Escor...
Call Girls in Noida Sector 11 Noida 💯Call Us 🔝 9582086666 🔝 South Delhi Escor...
 
9990771857 Call Girls in Dwarka Sector 3 Delhi (Call Girls) Delhi
9990771857 Call Girls in Dwarka Sector 3 Delhi (Call Girls) Delhi9990771857 Call Girls in Dwarka Sector 3 Delhi (Call Girls) Delhi
9990771857 Call Girls in Dwarka Sector 3 Delhi (Call Girls) Delhi
 
9990771857 Call Girls in Dwarka Sector 1 Delhi (Call Girls) Delhi
9990771857 Call Girls in Dwarka Sector 1 Delhi (Call Girls) Delhi9990771857 Call Girls in Dwarka Sector 1 Delhi (Call Girls) Delhi
9990771857 Call Girls in Dwarka Sector 1 Delhi (Call Girls) Delhi
 
3D Architectural Rendering Company by Panoram CGI
3D Architectural Rendering Company by Panoram CGI3D Architectural Rendering Company by Panoram CGI
3D Architectural Rendering Company by Panoram CGI
 
Properties for Sale in Istanbul with Schools and Parks | Antalya Development
Properties for Sale in Istanbul with Schools and Parks | Antalya DevelopmentProperties for Sale in Istanbul with Schools and Parks | Antalya Development
Properties for Sale in Istanbul with Schools and Parks | Antalya Development
 
Majestique Viman Nagar Pune Brochure.pdf
Majestique Viman Nagar Pune Brochure.pdfMajestique Viman Nagar Pune Brochure.pdf
Majestique Viman Nagar Pune Brochure.pdf
 
Call Girls in Noida Sector 77 Noida 💯Call Us 🔝 9582086666 🔝 South Delhi Escor...
Call Girls in Noida Sector 77 Noida 💯Call Us 🔝 9582086666 🔝 South Delhi Escor...Call Girls in Noida Sector 77 Noida 💯Call Us 🔝 9582086666 🔝 South Delhi Escor...
Call Girls in Noida Sector 77 Noida 💯Call Us 🔝 9582086666 🔝 South Delhi Escor...
 
Call Girls in shastri nagar Delhi 8264348440 ✅ call girls ❤️
Call Girls in shastri nagar Delhi 8264348440 ✅ call girls ❤️Call Girls in shastri nagar Delhi 8264348440 ✅ call girls ❤️
Call Girls in shastri nagar Delhi 8264348440 ✅ call girls ❤️
 
Call Girls In Vasant Vihar Delhi 💯Call Us 🔝8264348440🔝
Call Girls In Vasant Vihar Delhi 💯Call Us 🔝8264348440🔝Call Girls In Vasant Vihar Delhi 💯Call Us 🔝8264348440🔝
Call Girls In Vasant Vihar Delhi 💯Call Us 🔝8264348440🔝
 
Call Girls In Mayur Vihar Delhi ☆↫8447779280 ❤Escorts Service In Delhi
Call Girls In Mayur Vihar Delhi ☆↫8447779280 ❤Escorts Service In DelhiCall Girls In Mayur Vihar Delhi ☆↫8447779280 ❤Escorts Service In Delhi
Call Girls In Mayur Vihar Delhi ☆↫8447779280 ❤Escorts Service In Delhi
 
BDSM⚡Call Girls in Sector 57 Noida Escorts >༒8448380779 Escort Service
BDSM⚡Call Girls in Sector 57 Noida Escorts >༒8448380779 Escort ServiceBDSM⚡Call Girls in Sector 57 Noida Escorts >༒8448380779 Escort Service
BDSM⚡Call Girls in Sector 57 Noida Escorts >༒8448380779 Escort Service
 

Greater Toronto REALTORS Release Market Watch for July 2012

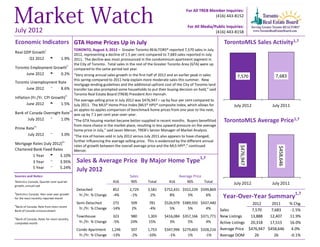
  • 1. For All TREB Member Inquiries: (416) 443-8152 For All Media/Public Inquiries: July 2012 (416) 443-8158 Economic Indicators GTA Home Prices Up in July TorontoMLS Sales Activity1,7 TORONTO, August 3, 2012 – Greater Toronto REALTORS® reported 7,570 sales in July Real GDP Growthi 2012, representing a decline of 1.5 per cent compared to 7,683 sales reported in July Q1 2012 t 1.9% 2011. The decline was most pronounced in the condominium apartment segment in the City of Toronto. Total sales in the rest of the Greater Toronto Area (GTA) were up Toronto Employment Growthi i compared to the same period last year. June 2012 t 0.2% “Very strong annual sales growth in the first half of 2012 and an earlier peak in sales 7,570 7,683 this spring compared to 2011 help explain more moderate sales this summer. New Toronto Unemployment Rate mortgage lending guidelines and the additional upfront cost of the City of Toronto land June 2012 q 8.6% transfer tax also prompted some households to put their buying decision on hold,” said ii Toronto Real Estate Board (TREB) President Ann Hannah. Inflation (Yr./Yr. CPI Growth) The average selling price in July 2012 was $476,947 – up by four per cent compared to June 2012 t 1.5% July 2011. The MLS® Home Price Index (MLS® HPI)* composite index, which allows for July 2012 July 2011 iii an apples-to-apples comparison of benchmark home prices from one year to the next, Bank of Canada Overnight Rate was up by 7.1 per cent year-over-year. July 2012 q 1.0% “The GTA housing market became better-supplied in recent months. Buyers benefitted TorontoMLS Average Price1,7 iv from more choice in the market place, resulting in less upward pressure on the average Prime Rate home price in July,” said Jason Mercer, TREB’s Senior Manager of Market Analysis. July 2012 q 3.0% “The mix of homes sold in July 2012 versus July 2011 also appears to have changed, iv further influencing the average selling price. This is evidenced by the different annual Mortgage Rates (July 2012) rates of growth between the overall average price and the MLS HPI®,” continued $476,947 $458,646 Chartered Bank Fixed Rates Mercer. 1 Year u 3.10% 1,7 3 Year q 3.95% Sales & Average Price By Major Home Type 5 Year q 5.24% July 2012 Sources and Notes: Sales Average Price i Statistics Canada, Quarter-over-quarter 416 905 Total 416 905 Total July 2012 July 2011 growth, annualized Detached 852 2,729 3,581 $752,431 $552,239 $599,869 ii Statistics Canada, Year-over-year growth 1,7 for the most recently reported month Yr./Yr. % Change -4% -1% -2% 8% 5% 6% Year-Over-Year Summary Semi-Detached 272 509 781 $526,979 $389,592 $437,440 2012 2011 % Chg. iii Bank of Canada, Rate from most recent Yr./Yr. % Change -14% 2% -4% 5% 5% 4% Sales 7,570 7,683 -1.5% Bank of Canada announcement iv Townhouse 323 980 1,303 $416,084 $357,166 $371,771 New Listings 13,888 12,407 11.9% Bank of Canada, Rates for most recently completed month Yr./Yr. % Change -5% 24% 15% 3% 5% 4% Active Listings 20,318 17,515 16.0% Condo Apartment 1,246 507 1,753 $347,996 $279,603 $328,216 Average Price $476,947 $458,646 4.0% Yr./Yr. % Change -13% -2% -10% -1% 1% -1% Average DOM 26 26 -0.1%
  • 2. Toronto Real Estate Board SALES BY PRICE RANGE AND HOUSE TYPE1,7 JULY 2012 Price Range Detached Semi-Detached Att/Row/Twnhouse Condo Townhouse Condo Apt Link Co-op Apt Det Condo Co-ownership Apt Total $0 to $99,999 12 0 0 4 10 0 1 0 0 27 $100,000 to $199,999 55 14 7 77 226 1 4 0 0 384 $200,000 to $299,999 290 54 96 205 617 30 1 4 4 1,301 $300,000 to $399,999 575 267 204 261 537 21 0 2 0 1,867 $400,000 to $499,999 748 274 199 90 210 47 2 0 1 1,571 $500,000 to $599,999 623 92 73 26 69 28 1 0 0 912 $600,000 to $699,999 439 43 23 8 41 4 0 0 0 558 $700,000 to $799,999 275 21 4 7 13 0 1 0 0 321 $800,000 to $899,999 167 9 8 1 6 0 0 0 0 191 $900,000 to $999,999 95 3 4 1 7 0 0 0 0 110 $1,000,000 to $1,249,999 123 2 1 0 10 0 0 0 0 136 $1,250,000 to $1,499,999 78 1 1 1 5 0 0 0 0 86 $1,500,000 to $1,749,999 29 1 1 0 1 0 0 0 0 32 $1,750,000 to $1,999,999 25 0 0 0 1 0 0 0 0 26 $2,000,000 + 47 0 1 0 0 0 0 0 0 48 Total Sales 3,581 781 622 681 1,753 131 10 6 5 7,570 Share of Total Sales 47.3% 10.3% 8.2% 9.0% 23.2% 1.7% 0.1% 0.1% 0.1% - Average Price $599,869 $437,440 $422,567 $325,376 $328,216 $416,713 $313,300 $286,750 $299,260 $476,947 SALES BY PRICE RANGE AND HOUSE TYPE1,7 YEAR-TO-DATE, 2012 Price Range Detached Semi-Detached Att/Row/Twnhouse Condo Townhouse Condo Apt Link Co-op Apt Det Condo Co-ownership Apt Total $0 to $99,999 30 1 4 14 145 0 4 0 5 203 $100,000 to $199,999 420 118 40 489 1,671 8 27 0 6 2,779 $200,000 to $299,999 2,048 421 781 1,501 4,326 260 18 12 27 9,394 $300,000 to $399,999 4,403 2,020 1,447 1,631 4,013 192 19 22 7 13,754 $400,000 to $499,999 5,410 2,135 1,297 548 1,653 260 10 7 6 11,326 $500,000 to $599,999 4,840 770 521 158 599 220 4 3 0 7,115 $600,000 to $699,999 3,571 378 247 87 302 59 1 4 0 4,649 $700,000 to $799,999 2,356 210 80 62 131 7 3 1 0 2,850 $800,000 to $899,999 1,538 116 58 22 81 0 0 0 0 1,815 $900,000 to $999,999 871 57 23 6 43 0 0 0 0 1,000 $1,000,000 to $1,249,999 1,095 49 21 11 77 2 2 1 0 1,258 $1,250,000 to $1,499,999 708 32 7 2 32 0 0 0 0 781 $1,500,000 to $1,749,999 373 11 7 1 22 0 0 0 0 414 $1,750,000 to $1,999,999 223 5 2 0 6 0 0 0 0 236 $2,000,000 + 456 2 2 1 15 0 0 0 0 476 Total Sales 28,342 6,325 4,537 4,533 13,116 1,008 88 50 51 58,050 Share of Total Sales 48.8% 10.9% 7.8% 7.8% 22.6% 1.7% 0.2% 0.1% 0.1% - Average Price $630,762 $458,212 $424,331 $328,523 $337,582 $414,214 $308,686 $400,698 $259,998 $501,212 Page 3 July 2010 Market Watch, July 2012 2
  • 3. Toronto Real Estate Board ALL HOME TYPES, JULY 2012 SUMMARY OF EXISTING HOME TRANSACTIONS ALL TREB AREAS Number of Sales Dollar Volume1 Average Price1 Median Price1 New Listings2 SNLR (Trend) 8 Active Listings3 Mos. Inv. (Trend)9 Avg. SP/LP 4 Avg. DOM5 TREB Total 7,570 $3,610,492,389 $476,947 $410,000 13,888 58.0% 20,318 2.2 98% 26 Halton Region 484 $247,931,095 $512,254 $466,000 775 60.2% 1,289 2.3 98% 24 Burlington 75 $33,524,400 $446,992 $385,000 123 60.0% 223 2.5 98% 28 Halton Hills 77 $35,488,550 $460,890 $432,500 94 69.7% 174 2.3 98% 28 Milton 169 $78,570,045 $464,912 $447,000 260 61.9% 307 1.6 98% 19 Oakville 163 $100,348,100 $615,633 $560,000 298 55.9% 585 2.8 98% 25 Peel Region 1,801 $790,917,716 $439,155 $395,000 3,294 57.4% 4,287 2.1 98% 24 Brampton 777 $314,738,144 $405,068 $380,400 1,467 56.3% 1,752 2.0 98% 23 Caledon 88 $49,329,300 $560,560 $501,250 119 56.7% 269 3.5 97% 33 Mississauga 936 $426,850,272 $456,037 $406,000 1,708 58.4% 2,266 2.0 98% 24 City of Toronto 2,721 $1,363,040,705 $500,934 $410,000 5,537 55.5% 8,385 2.3 98% 26 ! TURN PAGE FOR CITY OF TORONTO TABLES OR CLICK HERE: York Region 1,341 $794,512,875 $592,478 $525,000 2,545 59.5% 3,654 2.1 98% 24 Aurora 81 $47,180,350 $582,473 $499,900 106 68.5% 155 1.7 97% 24 E. Gwillimbury 33 $15,822,500 $479,470 $424,900 49 62.6% 88 2.9 96% 24 Georgina 70 $21,189,705 $302,710 $275,250 99 67.4% 240 3.0 98% 36 King 22 $16,945,425 $770,247 $677,500 55 51.3% 145 5.6 96% 35 Markham 379 $226,902,366 $598,687 $535,000 758 57.6% 981 1.9 98% 21 Newmarket 121 $55,699,441 $460,326 $432,500 177 75.0% 197 1.2 99% 19 Richmond Hill 252 $165,676,118 $657,445 $595,000 577 56.5% 763 1.8 98% 21 Vaughan 326 $207,061,259 $635,157 $560,000 603 57.6% 860 2.1 97% 27 Whitchurch-Stouffville 57 $38,035,711 $667,293 $505,000 121 57.1% 225 3.0 97% 31 Durham Region 967 $326,944,270 $338,102 $315,000 1,398 62.7% 1,958 2.2 98% 26 Ajax 181 $67,917,696 $375,236 $357,500 236 66.6% 243 1.6 99% 23 Brock 13 $3,325,500 $255,808 $260,000 39 41.1% 151 8.5 96% 57 Clarington 127 $36,938,490 $290,854 $276,000 193 62.9% 325 2.4 97% 32 Oshawa 257 $66,845,540 $260,099 $247,000 339 64.0% 442 2.1 98% 27 Pickering 135 $53,116,925 $393,459 $380,000 207 60.6% 254 2.0 99% 24 Scugog 37 $14,392,575 $388,989 $348,000 52 55.4% 130 4.3 97% 52 Uxbridge 29 $13,944,550 $480,847 $455,000 53 52.1% 129 4.6 98% 50 Whitby 188 $70,462,994 $374,803 $348,500 279 65.3% 284 1.7 99% 17 Dufferin County 70 $24,308,225 $347,260 $321,000 61 71.7% 105 2.5 98% 32 Orangeville 70 $24,308,225 $347,260 $321,000 61 71.7% 105 2.5 98% 32 Simcoe County 186 $62,837,503 $337,836 $312,625 278 62.8% 640 3.6 97% 50 Adjala-Tosorontio 16 $5,938,900 $371,181 $347,500 21 52.6% 87 6.3 97% 67 Bradford West Gwillimbury 47 $19,616,167 $417,365 $374,000 75 73.5% 104 1.9 98% 32 Essa 26 $7,188,800 $276,492 $241,000 35 57.9% 98 4.6 97% 64 Innisfil 63 $19,940,436 $316,515 $305,000 81 54.8% 203 4.6 97% 59 New Tecumseth 34 $10,153,200 $298,624 $283,500 66 68.7% 148 3.1 97% 37 Page 3 July 2010 Market Watch, July 2012 3
  • 4. Toronto Real Estate Board ALL HOME TYPES, JULY 2012 SUMMARY OF EXISTING HOME TRANSACTIONS CITY OF TORONTO MUNICIPAL BREAKDOWN 1 1 1 2 8 3 4 5 Number of Sales Dollar Volume Average Price Median Price New Listings SNLR (Trend) Active Listings Mos. Inv. (Trend)9 Avg. SP/LP Avg. DOM TREB Total 7,570 $3,610,492,389 $476,947 $410,000 13,888 58.0% 20,318 2.2 98% 26 City of Toronto Total 2,721 $1,363,040,705 $500,934 $410,000 5,537 55.5% 8,385 2.3 98% 26 Toronto West 705 $324,642,124 $460,485 $401,500 1,292 57.1% 2,020 2.5 99% 27 Toronto W01 40 $19,989,350 $499,734 $404,950 93 53.0% 139 2.3 100% 21 Toronto W02 50 $30,475,246 $609,505 $544,500 93 65.4% 108 1.3 98% 20 Toronto W03 57 $21,944,000 $384,982 $397,000 81 67.9% 95 1.7 100% 25 Toronto W04 78 $29,914,511 $383,519 $403,500 120 58.3% 198 2.6 98% 29 Toronto W05 94 $32,624,277 $347,067 $375,000 177 57.4% 315 3.0 98% 29 Toronto W06 123 $55,606,165 $452,083 $399,900 249 46.3% 415 3.4 98% 33 Toronto W07 19 $13,311,500 $700,605 $750,000 34 67.1% 35 1.4 101% 25 Toronto W08 108 $74,312,400 $688,078 $565,000 213 59.0% 349 2.4 98% 27 Toronto W09 48 $18,877,815 $393,288 $399,500 75 57.0% 124 2.7 98% 23 Toronto W10 88 $27,586,860 $313,487 $271,500 157 55.1% 242 2.9 98% 22 Toronto Central 1,172 $679,569,290 $579,837 $424,500 2,727 52.2% 4,432 2.5 98% 29 Toronto C01 337 $146,717,026 $435,362 $387,000 885 48.0% 1,435 3.0 98% 31 Toronto C02 43 $42,797,500 $995,291 $800,000 104 48.5% 236 3.4 97% 32 Toronto C03 41 $48,703,500 $1,187,890 $580,000 42 61.0% 82 2.1 96% 29 Toronto C04 58 $62,299,975 $1,074,138 $964,750 114 56.3% 191 2.1 97% 26 Toronto C06 20 $10,724,990 $536,250 $582,500 43 55.4% 74 2.3 97% 32 Toronto C07 95 $49,558,868 $521,672 $378,000 242 51.3% 366 2.3 98% 25 Toronto C08 122 $49,290,488 $404,020 $374,550 297 54.9% 455 2.4 98% 30 Toronto C09 19 $18,193,000 $957,526 $731,000 27 57.3% 56 2.5 99% 25 Toronto C10 50 $28,713,189 $574,264 $449,250 83 63.2% 125 1.6 98% 29 Toronto C11 40 $26,224,500 $655,613 $469,750 67 62.1% 86 1.9 98% 30 Toronto C12 27 $35,251,400 $1,305,607 $850,000 71 49.3% 157 3.6 95% 42 Toronto C13 62 $34,583,817 $557,804 $420,750 136 60.5% 179 1.8 99% 23 Toronto C14 122 $59,268,048 $485,804 $379,500 348 50.6% 574 2.3 98% 25 Toronto C15 136 $67,242,989 $494,434 $416,250 268 50.8% 416 2.4 98% 27 Toronto East 844 $358,829,291 $425,153 $396,000 1,518 60.1% 1,933 1.9 99% 22 Toronto E01 61 $33,148,955 $543,425 $530,000 110 61.9% 107 1.5 101% 15 Toronto E02 73 $52,151,067 $714,398 $645,000 82 64.2% 85 1.3 100% 12 Toronto E03 85 $46,520,548 $547,301 $510,000 143 60.7% 167 1.5 99% 18 Toronto E04 106 $36,206,215 $341,568 $344,000 180 60.4% 250 2.0 100% 23 Toronto E05 92 $36,933,562 $401,452 $334,500 154 66.0% 183 1.4 99% 21 Toronto E06 28 $13,275,500 $474,125 $419,250 58 56.8% 61 1.6 99% 21 Toronto E07 74 $26,090,780 $352,578 $356,000 190 56.8% 250 2.3 99% 26 Toronto E08 59 $24,731,766 $419,182 $390,000 84 61.0% 126 2.3 97% 32 Toronto E09 118 $37,390,222 $316,866 $321,400 226 56.0% 334 2.4 99% 26 Toronto E10 61 $25,108,628 $411,617 $420,000 109 62.4% 129 1.8 99% 19 Toronto E11 87 $27,272,048 $313,472 $285,000 182 56.6% 241 2.3 98% 23 Page 3 July 2010 Market Watch, July 2012 4
  • 5. Toronto Real Estate Board ALL HOME TYPES, YEAR-TO-DATE 2012 SUMMARY OF EXISTING HOME TRANSACTIONS ALL TREB AREAS Number of Sales Dollar Volume1 Average Price1 Median Price1 New Listings2 Avg. SP/LP 4 Avg. DOM5 TREB Total 58,050 $29,095,333,243 $501,212 $421,000 104,424 99% 23 Halton Region 3,733 $2,089,110,904 $559,633 $472,000 6,332 98% 23 Burlington 516 $245,493,932 $475,763 $407,250 900 98% 27 Halton Hills 589 $272,981,000 $463,465 $430,000 846 98% 27 Milton 1,159 $535,276,170 $461,843 $430,000 1,920 99% 17 Oakville 1,469 $1,035,359,802 $704,806 $599,900 2,666 97% 26 Peel Region 12,701 $5,582,011,424 $439,494 $399,000 22,848 98% 22 Brampton 5,465 $2,209,962,591 $404,385 $383,000 9,808 98% 21 Caledon 539 $302,190,466 $560,650 $483,000 983 97% 31 Mississauga 6,697 $3,069,858,367 $458,393 $410,000 12,057 98% 21 City of Toronto 21,934 $11,997,812,778 $546,996 $429,000 42,022 100% 22 ! TURN PAGE FOR CITY OF TORONTO TABLES OR CLICK HERE: York Region 10,843 $6,441,500,441 $594,070 $538,888 19,335 99% 21 Aurora 623 $353,985,391 $568,195 $515,000 959 99% 19 E. Gwillimbury 213 $107,170,981 $503,150 $433,300 347 98% 30 Georgina 565 $177,143,990 $313,529 $292,000 897 98% 33 King 196 $159,000,179 $811,225 $699,950 383 96% 52 Markham 2,997 $1,817,930,410 $606,583 $553,000 5,438 100% 19 Newmarket 1,000 $449,203,794 $449,204 $425,000 1,420 99% 17 Richmond Hill 2,125 $1,412,860,310 $664,875 $603,000 4,109 99% 18 Vaughan 2,637 $1,664,880,750 $631,354 $577,000 4,865 99% 21 Whitchurch-Stouffville 487 $299,324,636 $614,630 $527,500 917 98% 30 Durham Region 7,001 $2,350,733,258 $335,771 $312,500 11,031 98% 26 Ajax 1,330 $492,606,307 $370,381 $355,000 1,956 99% 21 Brock 126 $33,355,640 $264,727 $236,250 304 96% 79 Clarington 1,122 $328,920,681 $293,156 $274,900 1,735 98% 29 Oshawa 1,682 $432,783,640 $257,303 $243,000 2,563 98% 26 Pickering 915 $361,609,293 $395,201 $370,000 1,547 99% 23 Scugog 201 $75,734,358 $376,788 $330,000 386 97% 45 Uxbridge 207 $100,556,311 $485,779 $454,000 407 97% 45 Whitby 1,418 $525,167,028 $370,358 $349,900 2,133 99% 20 Dufferin County 428 $147,607,665 $344,878 $320,000 567 98% 37 Orangeville 428 $147,607,665 $344,878 $320,000 567 98% 37 Simcoe County 1,410 $486,556,773 $345,076 $318,000 2,289 98% 45 Adjala-Tosorontio 97 $41,186,350 $424,602 $402,250 202 97% 76 Bradford West Gwillimbury 378 $155,665,025 $411,812 $380,838 524 98% 28 Essa 205 $59,901,366 $292,202 $260,000 359 98% 56 Innisfil 349 $110,069,284 $315,385 $297,000 649 97% 50 New Tecumseth 381 $119,734,748 $314,264 $290,000 555 98% 45 Page 3 July 2010 Market Watch, July 2012 5
  • 6. Toronto Real Estate Board ALL HOME TYPES, YEAR-TO-DATE 2012 SUMMARY OF EXISTING HOME TRANSACTIONS CITY OF TORONTO MUNICIPAL BREAKDOWN 1 1 1 2 4 5 Number of Sales Dollar Volume Average Price Median Price New Listings Avg. SP/LP Avg. DOM TREB Total 58,050 $29,095,333,243 $501,212 $421,000 104,424 99% 23 City of Toronto Total 21,934 $11,997,812,778 $546,996 $429,000 42,022 100% 22 Toronto West 5,706 $2,714,878,789 $475,794 $415,000 10,321 100% 24 Toronto W01 365 $222,024,243 $608,286 $550,000 784 103% 17 Toronto W02 578 $357,278,756 $618,129 $580,150 884 104% 15 Toronto W03 508 $198,111,351 $389,983 $380,000 726 100% 21 Toronto W04 547 $204,603,874 $374,047 $365,000 944 99% 27 Toronto W05 709 $245,287,067 $345,962 $370,000 1,307 98% 30 Toronto W06 806 $364,467,492 $452,193 $423,000 1,827 99% 30 Toronto W07 204 $141,804,943 $695,122 $650,000 299 102% 18 Toronto W08 1,060 $656,917,709 $619,734 $525,000 1,861 99% 24 Toronto W09 344 $145,150,265 $421,948 $442,217 613 99% 26 Toronto W10 585 $179,233,089 $306,381 $321,000 1,076 98% 25 Toronto Central 9,868 $6,503,611,809 $659,061 $458,000 20,801 100% 23 Toronto C01 2,566 $1,167,535,720 $455,002 $394,000 6,100 99% 26 Toronto C02 465 $467,108,001 $1,004,533 $807,000 1,017 99% 24 Toronto C03 366 $365,637,385 $999,009 $640,000 598 100% 20 Toronto C04 644 $718,709,213 $1,116,008 $1,030,000 1,161 101% 19 Toronto C06 216 $136,064,047 $629,926 $636,500 402 101% 21 Toronto C07 763 $449,364,547 $588,944 $457,000 1,639 99% 21 Toronto C08 975 $423,372,874 $434,229 $390,000 2,018 99% 24 Toronto C09 199 $257,158,956 $1,292,256 $915,000 356 98% 23 Toronto C10 453 $305,234,156 $673,806 $599,000 750 102% 16 Toronto C11 288 $190,710,900 $662,191 $382,307 475 101% 21 Toronto C12 283 $499,550,564 $1,765,196 $1,489,000 622 98% 29 Toronto C13 540 $318,654,901 $590,102 $450,000 954 102% 20 Toronto C14 1,089 $653,186,131 $599,804 $431,800 2,534 100% 22 Toronto C15 1,021 $551,324,414 $539,985 $420,800 2,175 100% 24 Toronto East 6,360 $2,779,322,180 $437,000 $414,000 10,900 101% 20 Toronto E01 580 $336,729,801 $580,569 $556,228 921 104% 13 Toronto E02 519 $348,242,613 $670,988 $603,000 827 102% 12 Toronto E03 684 $367,591,142 $537,414 $510,750 1,162 103% 15 Toronto E04 737 $259,155,136 $351,635 $375,000 1,273 100% 23 Toronto E05 661 $273,114,833 $413,184 $368,000 1,062 101% 18 Toronto E06 260 $129,590,193 $498,424 $425,000 488 101% 17 Toronto E07 614 $223,488,082 $363,987 $319,919 1,092 101% 26 Toronto E08 424 $169,206,449 $399,072 $387,500 722 98% 25 Toronto E09 795 $258,106,978 $324,663 $320,000 1,465 99% 25 Toronto E10 461 $205,933,465 $446,710 $431,000 723 100% 19 Toronto E11 625 $208,163,488 $333,062 $320,000 1,165 99% 22 Page 3 July 2010 Market Watch, July 2012 6
  • 7. Toronto Real Estate Board DETACHED HOUSES, JULY 2012 Industrial Leasing SUMMARY OF EXISTING HOME TRANSACTIONS ALL TREB AREAS Sales1 Dollar Volume1 Average Price1 Median Price1 New Listings2 Active Listings3 Avg. SP/LP 4 Avg. DOM5 TREB Total 3,581 - $2,148,132,149 - $599,869 - $517,000 - 6,409 - 9,580 - 98% - 26 - Halton Region 277 $168,559,883 $608,519 $552,500 466 908 98% 26 Burlington 35 $20,126,700 $575,049 $562,500 64 159 98% 32 Halton Hills 57 $29,515,150 $517,810 $501,000 73 149 98% 30 Milton 89 $47,855,433 $537,701 $505,000 144 204 98% 20 Oakville 96 - $71,062,600 - $740,235 - $645,000 - 185 - 396 - 98% - 27 - Peel Region 806 $459,375,685 $569,945 $520,500 1,569 2,152 98% 25 Brampton 419 $201,107,341 $479,970 $460,000 844 1,064 98% 25 Caledon 72 $42,945,800 $596,469 $547,500 105 257 97% 37 Mississauga 315 - $215,322,544 - $683,564 - $607,000 - 620 - 831 - 98% - 22 - City of Toronto 852 $641,071,616 $752,431 $589,500 1,548 1,993 98% 21 ! TURN PAGE FOR CITY OF TORONTO TABLES OR CLICK HERE: - - - - - - - - York Region 768 $552,534,994 $719,447 $655,450 1,529 2,358 97% 25 Aurora 50 $34,946,200 $698,924 $588,800 63 107 97% 26 E. Gwillimbury 28 $14,219,000 $507,821 $450,000 44 84 96% 23 Georgina 61 $18,746,815 $307,325 $275,500 93 235 97% 37 King 22 $16,945,425 $770,247 $677,500 52 133 96% 35 Markham 172 $135,842,650 $789,783 $718,500 369 462 98% 20 Newmarket 79 $40,401,041 $511,406 $475,000 109 130 99% 21 Richmond Hill 143 $119,232,118 $833,791 $760,000 362 497 98% 20 Vaughan 170 $139,692,934 $821,723 $699,500 338 509 97% 30 Whitchurch-Stouffville 43 - $32,508,811 - $756,019 - $576,000 - 99 - 201 - 97% - 34 - Durham Region 678 $254,403,418 $375,226 $360,000 1,010 1,507 98% 27 Ajax 114 $48,448,596 $424,988 $413,500 162 165 99% 22 Brock 12 $3,198,000 $266,500 $262,000 37 143 96% 61 Clarington 89 $28,045,840 $315,122 $299,900 136 246 97% 34 Oshawa 185 $53,757,088 $290,579 $279,000 249 321 98% 25 Pickering 86 $39,113,475 $454,808 $430,000 123 163 99% 24 Scugog 36 $14,150,575 $393,072 $349,000 49 128 97% 53 Uxbridge 26 $13,261,800 $510,069 $469,450 51 121 98% 51 Whitby 130 - $54,428,044 - $418,677 - $385,000 - 203 - 220 - 99% - 17 - Dufferin County 54 $20,499,200 $379,615 $338,000 51 81 98% 30 Orangeville 54 - $20,499,200 - $379,615 - $338,000 - 51 - 81 - 98% - 30 - Simcoe County 146 $51,687,353 $354,023 $337,500 236 581 97% 56 Adjala-Tosorontio 16 $5,938,900 $371,181 $347,500 21 87 97% 67 Bradford West Gwillimbury 29 $13,783,017 $475,276 $417,500 65 99 97% 40 Essa 22 $6,195,900 $281,632 $241,000 30 91 96% 70 Innisfil 58 $18,877,936 $325,482 $322,250 77 198 97% 59 New Tecumseth 21 $6,891,600 $328,171 $305,000 43 106 97% 44 Page 3 July 2010 Market Watch, July 2012 7
  • 8. Toronto Real Estate Board DETACHED HOUSES, JULY 2012 Industrial Leasing SUMMARY OF EXISTING HOME TRANSACTIONS CITY OF TORONTO MUNICIPAL BREAKDOWN Sales1 Dollar Volume1 Average Price1 Median Price1 New Listings2 Active Listings3 Avg. SP/LP 4 Avg. DOM5 TREB Total 3,581 $2,148,132,149 $599,869 $517,000 6,409 9,580 98% 26 City of Toronto Total 852 $641,071,616 $752,431 $589,500 1,548 1,993 98% 21 Toronto West 266 $174,284,441 $655,205 $530,000 436 556 99% 23 Toronto W01 5 $4,283,000 $856,600 $600,500 17 21 98% 21 Toronto W02 16 $14,143,000 $883,938 $863,000 29 33 98% 20 Toronto W03 26 $10,749,500 $413,442 $404,750 42 50 100% 27 Toronto W04 41 $19,524,611 $476,210 $452,000 64 90 98% 31 Toronto W05 16 $8,490,800 $530,675 $495,000 37 56 98% 23 Toronto W06 37 $22,179,215 $599,438 $503,000 52 55 98% 25 Toronto W07 14 $10,726,500 $766,179 $764,750 23 25 101% 22 Toronto W08 52 $55,166,000 $1,060,885 $947,500 74 110 98% 23 Toronto W09 22 $12,187,815 $553,992 $559,000 26 34 99% 14 Toronto W10 37 $16,834,000 $454,973 $435,000 72 82 97% 17 Toronto Central 226 $266,400,113 $1,178,762 $941,088 469 751 97% 24 Toronto C01 4 $3,634,500 $908,625 $807,250 11 12 105% 30 Toronto C02 10 $13,479,000 $1,347,900 $1,375,000 8 21 97% 25 Toronto C03 25 $39,976,000 $1,599,040 $1,008,000 26 48 96% 31 Toronto C04 40 $50,897,175 $1,272,429 $1,102,500 71 117 97% 24 Toronto C06 10 $7,556,500 $755,650 $702,000 19 31 98% 26 Toronto C07 29 $25,386,650 $875,402 $797,800 85 128 99% 18 Toronto C08 - - - - 2 5 - - Toronto C09 5 $9,018,000 $1,803,600 $1,900,000 7 19 98% 24 Toronto C10 7 $6,529,500 $932,786 $837,500 11 16 97% 17 Toronto C11 15 $18,413,000 $1,227,533 $1,272,000 17 16 97% 22 Toronto C12 13 $26,479,000 $2,036,846 $2,100,000 46 112 95% 60 Toronto C13 22 $21,050,200 $956,827 $763,250 43 49 99% 19 Toronto C14 16 $17,782,000 $1,111,375 $1,086,000 64 109 96% 24 Toronto C15 30 $26,198,588 $873,286 $852,500 59 68 97% 17 Toronto East 360 $200,387,062 $556,631 $485,250 643 686 99% 17 Toronto E01 13 $8,518,900 $655,300 $700,900 17 15 101% 22 Toronto E02 31 $28,229,900 $910,642 $830,000 42 38 99% 15 Toronto E03 59 $35,372,048 $599,526 $540,000 83 91 99% 18 Toronto E04 43 $19,697,277 $458,076 $446,000 84 78 101% 9 Toronto E05 26 $16,813,500 $646,673 $680,000 36 41 99% 17 Toronto E06 26 $12,615,500 $485,212 $421,750 52 52 99% 20 Toronto E07 20 $10,453,600 $522,680 $526,000 68 74 99% 19 Toronto E08 30 $18,084,066 $602,802 $496,183 43 54 97% 24 Toronto E09 52 $20,989,572 $403,646 $401,000 81 83 100% 16 Toronto E10 36 $18,368,800 $510,244 $486,500 79 89 100% 15 Toronto E11 24 $11,243,899 $468,496 $442,500 58 71 98% 26 Page 3 July 2010 Market Watch, July 2012 8
  • 9. Toronto Real Estate Board SEMI-DETACHED HOUSES, JULY 2012 Industrial Leasing SUMMARY OF EXISTING HOME TRANSACTIONS ALL TREB AREAS Sales1 Dollar Volume1 Average Price1 Median Price1 New Listings2 Active Listings3 Avg. SP/LP 4 Avg. DOM5 TREB Total 781 - $341,640,534 - $437,440 - $415,000 - 1,287 - 1,261 - 99% - 18 - Halton Region 39 $15,826,788 $405,815 $405,000 64 64 99% 14 Burlington 5 $1,916,000 $383,200 $379,000 9 7 100% 22 Halton Hills 4 $1,330,000 $332,500 $352,500 4 3 98% 15 Milton 23 $9,636,288 $418,969 $417,000 40 40 99% 13 Oakville 7- $2,944,500 - $420,643 - $407,000 - 11 - 14 - 99% - 14 - Peel Region 314 $123,805,717 $394,286 $385,000 556 515 98% 19 Brampton 161 $57,687,401 $358,307 $354,000 319 316 98% 20 Caledon 11 $4,482,500 $407,500 $405,500 7 4 100% 13 Mississauga 142 - $61,635,816 - $434,055 - $432,500 - 230 - 195 - 98% - 18 - City of Toronto 272 $143,338,171 $526,979 $487,650 417 424 100% 17 ! TURN PAGE FOR CITY OF TORONTO TABLES OR CLICK HERE: - - - - - - - - York Region 85 $39,845,988 $468,776 $474,000 158 164 99% 14 Aurora 7 $2,707,000 $386,714 $390,500 10 7 100% 17 E. Gwillimbury - - - - - - - - Georgina 1 $312,000 $312,000 $312,000 2 1 99% 5 King - - - - - - - - Markham 28 $13,659,488 $487,839 $475,944 47 47 100% 14 Newmarket 11 $4,098,400 $372,582 $382,000 25 28 99% 18 Richmond Hill 6 $2,808,000 $468,000 $490,000 19 21 100% 12 Vaughan 28 $14,615,600 $521,986 $526,250 46 49 98% 13 Whitchurch-Stouffville 4- $1,645,500 - $411,375 - $406,250 - 9- 11 - 100% - 14 - Durham Region 64 $16,899,870 $264,060 $273,450 79 81 99% 20 Ajax 17 $5,702,800 $335,459 $334,900 23 17 100% 15 Brock 1 $127,500 $127,500 $127,500 1 1 95% 12 Clarington 3 $574,000 $191,333 $205,000 7 6 97% 11 Oshawa 25 $4,941,920 $197,677 $200,000 30 43 98% 25 Pickering 13 $4,170,500 $320,808 $315,000 12 11 99% 25 Scugog 1 $242,000 $242,000 $242,000 2 1 99% 8 Uxbridge - - - - - - - - Whitby 4- $1,141,150 - $285,288 - $279,625 - 4- 2- 98% - 8- Dufferin County 4 $918,250 $229,563 $232,875 6 5 97% 20 Orangeville 4 - $918,250 - $229,563 - $232,875 - 6 - 5 - 97% - 20 - Simcoe County 3 $1,005,750 $335,250 $355,000 7 8 99% 12 Adjala-Tosorontio - - - - - - - - Bradford West Gwillimbury 3 $1,005,750 $335,250 $355,000 3 3 99% 12 Essa - - - - 1 1 - - Innisfil - - - - - - - - New Tecumseth - - - - 3 4 - - Page 3 July 2010 Market Watch, July 2012 9
  • 10. Toronto Real Estate Board SEMI-DETACHED HOUSES, JULY 2012 Industrial Leasing SUMMARY OF EXISTING HOME TRANSACTIONS CITY OF TORONTO MUNICIPAL BREAKDOWN Sales1 Dollar Volume1 Average Price1 Median Price1 New Listings2 Active Listings3 Avg. SP/LP 4 Avg. DOM5 TREB Total 781 $341,640,534 $437,440 $415,000 1,287 1,261 99% 18 City of Toronto Total 272 $143,338,171 $526,979 $487,650 417 424 100% 17 Toronto West 91 $43,711,235 $480,343 $426,500 129 148 100% 19 Toronto W01 8 $5,992,800 $749,100 $731,450 8 6 105% 11 Toronto W02 14 $7,858,658 $561,333 $544,500 20 20 98% 16 Toronto W03 18 $7,400,500 $411,139 $416,000 25 30 100% 19 Toronto W04 7 $3,253,000 $464,714 $445,000 6 7 102% 23 Toronto W05 34 $14,328,277 $421,420 $399,950 50 67 98% 23 Toronto W06 4 $2,508,500 $627,125 $615,750 8 9 99% 27 Toronto W07 - - - - - - - - Toronto W08 - - - - 1 1 - - Toronto W09 2 $829,000 $414,500 $414,500 4 3 99% 10 Toronto W10 4 $1,540,500 $385,125 $377,000 7 5 99% 8 Toronto Central 72 $44,664,046 $620,334 $583,000 109 118 99% 21 Toronto C01 13 $9,151,518 $703,963 $640,500 23 22 99% 16 Toronto C02 4 $4,535,000 $1,133,750 $1,130,000 11 20 98% 35 Toronto C03 10 $4,849,500 $484,950 $459,500 7 6 99% 20 Toronto C04 7 $5,325,500 $760,786 $718,000 7 4 100% 12 Toronto C06 - - - - 1 1 - - Toronto C07 5 $2,622,300 $524,460 $520,000 7 9 98% 24 Toronto C08 1 $650,000 $650,000 $650,000 4 7 100% 15 Toronto C09 - - - - 4 5 - - Toronto C10 3 $2,112,888 $704,296 $718,888 2 6 97% 44 Toronto C11 4 $2,598,000 $649,500 $627,500 6 3 97% 21 Toronto C12 2 $1,261,500 $630,750 $630,750 2 - 102% 6 Toronto C13 6 $2,748,540 $458,090 $443,220 11 15 100% 20 Toronto C14 - - - - - - - - Toronto C15 17 $8,809,300 $518,194 $513,000 24 20 98% 23 Toronto East 109 $54,962,890 $504,247 $458,000 179 158 101% 13 Toronto E01 29 $16,635,955 $573,654 $570,000 45 30 103% 12 Toronto E02 25 $14,023,617 $560,945 $550,000 25 18 102% 10 Toronto E03 17 $9,361,000 $550,647 $540,000 30 28 100% 14 Toronto E04 8 $2,867,988 $358,499 $344,000 13 12 100% 20 Toronto E05 3 $1,339,500 $446,500 $456,000 11 13 99% 9 Toronto E06 1 $425,000 $425,000 $425,000 4 5 98% 43 Toronto E07 9 $3,768,180 $418,687 $410,800 15 17 102% 13 Toronto E08 - - - - 1 1 - - Toronto E09 2 $685,000 $342,500 $342,500 7 6 97% 22 Toronto E10 4 $1,570,500 $392,625 $416,250 2 3 101% 12 Toronto E11 11 $4,286,150 $389,650 $415,000 26 25 99% 10 Page 3 July 2010 Market Watch, July 2012 10
  • 11. Toronto Real Estate Board CONDOMINIUM TOWNHOUSES, JULY 2012 Industrial Leasing SUMMARY OF EXISTING HOME TRANSACTIONS ALL TREB AREAS Sales1 Dollar Volume1 Average Price1 Median Price1 New Listings2 Active Listings3 Avg. SP/LP 4 Avg. DOM5 TREB Total 681 - $221,581,197 - $325,376 - $317,000 - 901 - 1,194 - 98% - 25 - Halton Region 40 $14,040,000 $351,000 $331,000 49 65 99% 24 Burlington 16 $5,542,500 $346,406 $331,000 20 20 99% 31 Halton Hills 8 $1,793,200 $224,150 $233,450 11 10 99% 18 Milton 2 $550,000 $275,000 $275,000 4 4 99% 18 Oakville 14 - $6,154,300 - $439,593 - $414,250 - 14 - 31 - 98% - 21 - Peel Region 257 $84,493,989 $328,770 $323,000 335 394 98% 23 Brampton 59 $15,209,402 $257,786 $237,100 77 94 98% 24 Caledon - - - - 1 4 - - Mississauga 198 - $69,284,587 - $349,922 - $342,250 - 257 - 296 - 98% - 23 - City of Toronto 228 $79,044,601 $346,687 $330,450 322 476 99% 25 ! TURN PAGE FOR CITY OF TORONTO TABLES OR CLICK HERE: - - - - - - - - York Region 71 $26,813,200 $377,651 $370,000 101 129 98% 26 Aurora 3 $996,000 $332,000 $333,500 11 16 97% 17 E. Gwillimbury - - - - - - - - Georgina 2 $650,900 $325,450 $325,450 - - 97% 57 King - - - - - - - - Markham 31 $11,868,200 $382,845 $365,000 53 66 98% 24 Newmarket 8 $2,363,400 $295,425 $291,250 7 9 98% 27 Richmond Hill 16 $6,576,700 $411,044 $422,000 21 24 98% 20 Vaughan 9 $3,716,500 $412,944 $418,000 9 14 97% 33 Whitchurch-Stouffville 2- $641,500 - $320,750 - $320,750 - - - - - 98% - 43 - Durham Region 77 $15,685,332 $203,706 $213,000 86 119 98% 33 Ajax 16 $3,875,800 $242,238 $244,000 13 15 98% 25 Brock - - - - 1 7 - - Clarington 5 $1,067,900 $213,580 $169,900 6 10 98% 53 Oshawa 28 $4,020,032 $143,573 $141,000 31 39 98% 42 Pickering 15 $3,796,100 $253,073 $245,000 25 31 98% 23 Scugog - - - - - - - - Uxbridge 1 $280,000 $280,000 $280,000 2 6 99% 59 Whitby 12 - $2,645,500 - $220,458 - $223,000 - 8- 11 - 98% - 26 - Dufferin County 4 $662,475 $165,619 $169,738 3 5 93% 17 Orangeville 4 - $662,475 - $165,619 - $169,738 - 3 - 5 - 93% - 17 - Simcoe County 4 $841,600 $210,400 $204,800 5 6 98% 20 Adjala-Tosorontio - - - - - - - - Bradford West Gwillimbury 2 $471,000 $235,500 $235,500 2 1 99% 19 Essa - - - - - - - - Innisfil - - - - - - - - New Tecumseth 2 $370,600 $185,300 $185,300 3 5 97% 21 Page 3 July 2010 Market Watch, July 2012 11
  • 12. Toronto Real Estate Board CONDOMINIUM TOWNHOUSES, JULY 2012 Industrial Leasing SUMMARY OF EXISTING HOME TRANSACTIONS CITY OF TORONTO MUNICIPAL BREAKDOWN Sales1 Dollar Volume1 Average Price1 Median Price1 New Listings2 Active Listings3 Avg. SP/LP 4 Avg. DOM5 TREB Total 681 $221,581,197 $325,376 $317,000 901 1,194 98% 25 City of Toronto Total 228 $79,044,601 $346,687 $330,450 322 476 99% 25 Toronto West 61 $17,469,550 $286,386 $262,000 80 116 99% 28 Toronto W01 4 $1,590,150 $397,538 $379,125 5 7 98% 25 Toronto W02 4 $1,586,300 $396,575 $394,200 9 8 100% 10 Toronto W03 - - - - 1 1 - - Toronto W04 12 $3,395,500 $282,958 $266,000 12 14 98% 26 Toronto W05 15 $3,165,600 $211,040 $198,000 28 49 97% 32 Toronto W06 3 $1,460,000 $486,667 $510,000 5 9 98% 11 Toronto W07 1 $268,000 $268,000 $268,000 1 1 97% 12 Toronto W08 9 $3,047,500 $338,611 $315,000 7 6 102% 36 Toronto W09 3 $1,003,000 $334,333 $335,000 4 7 98% 22 Toronto W10 10 $1,953,500 $195,350 $224,000 8 14 97% 35 Toronto Central 90 $38,940,118 $432,668 $409,500 126 190 99% 21 Toronto C01 20 $10,294,300 $514,715 $508,500 30 41 98% 21 Toronto C02 1 $778,000 $778,000 $778,000 2 14 99% 39 Toronto C03 - - - - - 3 - - Toronto C04 - - - - 1 1 - - Toronto C06 - - - - - 2 - - Toronto C07 6 $2,247,218 $374,536 $371,259 11 16 100% 22 Toronto C08 5 $2,050,900 $410,180 $379,000 16 17 99% 17 Toronto C09 1 $755,000 $755,000 $755,000 1 3 101% 17 Toronto C10 4 $2,380,500 $595,125 $596,500 3 6 98% 10 Toronto C11 6 $1,825,000 $304,167 $298,250 8 4 103% 22 Toronto C12 2 $1,181,000 $590,500 $590,500 3 10 95% 40 Toronto C13 3 $1,241,000 $413,667 $400,000 3 3 99% 11 Toronto C14 10 $3,746,500 $374,650 $354,000 15 25 100% 27 Toronto C15 32 $12,440,700 $388,772 $382,500 33 45 99% 20 Toronto East 77 $22,634,933 $293,960 $295,800 116 170 98% 27 Toronto E01 2 $753,900 $376,950 $376,950 4 4 99% 9 Toronto E02 1 $642,000 $642,000 $642,000 1 6 99% 23 Toronto E03 - - - - 2 4 - - Toronto E04 16 $5,327,550 $332,972 $332,200 14 17 98% 24 Toronto E05 16 $5,032,784 $314,549 $316,000 24 35 99% 18 Toronto E06 - - - - - - - - Toronto E07 5 $1,564,800 $312,960 $308,000 10 16 97% 36 Toronto E08 8 $2,251,900 $281,488 $286,450 10 12 98% 39 Toronto E09 6 $1,245,000 $207,500 $220,000 13 21 99% 25 Toronto E10 7 $1,607,000 $229,571 $210,000 13 16 97% 47 Toronto E11 16 $4,209,999 $263,125 $259,000 25 39 97% 24 Page 3 July 2010 Market Watch, July 2012 12