SlideShare a Scribd company logo
1 of 8
Download to read offline
Q3 2013 » Putnam Perspectives
Capital Markets Outlook
Putnam’s outlook
Arrows in the table indicate the change
from the previous quarter.
Underweight
Smallunderweight
Neutral
Smalloverweight
Overweight
Asset class
EQUITY
U.S. large cap l
U.S. small cap l
U.S. value l
U.S. growth l
Europe l
Japan l
Emerging markets l
FIXEDINCOME
U.S. government l
U.S. tax exempt l
U.S. investment-grade corporates l
U.S. mortgage-backed l
U.S. floating-rate bank loans l
U.S. high yield l
Non-U.S. developed country l
Emerging markets l
COMMODITIES l
CASH l
CURRENCY SNAPSHOT
Dollar vs. yen: Dollar
Dollar vs. euro: Dollar (from neutral last quarter)
Dollar vs. pound: Dollar (from neutral last quarter)
The Fed’s tapering talk could
cause more volatility.
If anyone doubted that policy moves markets,
skyrocketing bond yields in the second
quarter helped resolve the debate.
At the beginning of May, the yield of the
10-year Treasury was close to 1.6%, near
historic low levels. By the end of June, the yield
had risen to approximately 2.6%, still remark-
ably low in historical terms, but 57% higher in
the space of only seven weeks. Rising yields
caused volatility in spread sectors and global
bond markets, and eventually even dragged
the S&P 500 down from record high levels.
Yield movements like this are rare, espe-
cially when the economy is growing below
its capacity and generating little inflationary
pressure. The markets were reacting to
signals that the Fed might begin tapering
its monthly asset purchases of $85 billion. In
June, Fed Chairman Ben Bernanke announced
a possible reduction in these purchases by $10
billion each month, beginning later this year,
with the entire program ended by mid 2014, if
the economy continues to behave as the Fed
currently forecasts.
We regard the jump in yields during the
second quarter as an overreaction to the
tapering plan, given current economic perfor-
mance. It demonstrated just how much sway
policymakers have over the fortunes of inves-
tors in the near term.
The communication strategy employed
by the Fed will be a critical component
of monetary policy as we move forward.
Foreshadowing the introduction of tapering
was likely meant, at least in part, as a
deliberate way to reintroduce volatility to
the bond market. Volatility, like yields, had
Key takeaways
•	The Fed’s tapering talk could cause more volatility.
•	In a steady economy, deflation lurks.
•	Risk assets deserve the benefit of the doubt.
Jason R. Vaillancourt, CFA
Co-Head of Global Asset Allocation
2
Q3 2013 | Capital Markets Outlook
recently touched all-time lows in both realized and implied
terms. The Fed faces a task all the more daunting because
of its massive footprint in the bond market. Currently, the
Fed is on pace to own nearly a quarter of the liquid bond
market by mid 2014.
Despite an improving economy, as we get closer to
actual policy changes we anticipate a greater degree of
market turbulence than what investors may have grown
accustomed to over the past several quarters. We also
find the current setting attractive for identifying oppor-
tunities, because we have a long-term view and invest
actively to take advantage of changing market conditions.
In a steady economy, deflation lurks.
Based on its internal dynamics, the U.S. economy
continues to be one of the most attractive for investors.
One of the key pillars of support for the U.S. economy has
been the housing market. Dynamics of the housing market
include low prices, low mortgage rates, high pent-up
demand due to rising household formation, and institu-
tional investment into a strong rental market. Of these,
only mortgage rates have hit a bump in the road, as the
surge in bond yields has pushed rates higher. However,
rates still appear low when viewed over a longer time
horizon, and we think conditions favor continued strength.
The performance of the economy so far in 2013 is all the
more impressive because of the drag imposed by fiscal
policy contraction. Payroll taxes increased January 1, and
the federal budget sequester went into effect in March.
The sequester takes its biggest bites from GDP during
the third quarter, and so the ultimate impact on factors
like business investment, consumer spending, and the
job market would likely start to show up in the data very
shortly, if they are to show up at all.
Fortunately, credit channels to businesses have opened
wider as well, and this also encourages optimism. Credit
expansion constitutes a major difference between the
United States and Europe, where constrained credit
continues to inhibit recovery, particularly in peripheral
markets. Credit is also emerging as an issue in China, where
bank lending rates skyrocketed during the second quarter.
The biggest fundamental story for investors and policy
makers in 2013 continues to be the steady decline in the
unemployment rate. Although the final estimate of first-
quarter GDP was revised down by a significant amount,
the economy has on average produced monthly payroll
gains of over 200,000 per month in 2013. That has trans-
lated into a decline in the unemployment rate from 8.2% to
7.6% over the past year.
Figure 1. �The Fed’s words lifted yields
and bond market volatility
Yield of the 10-year Treasury and volatility
of the U.S. Treasury MOVE Index, 12/31/12–7/5/13
1.5%
2.0%
2.5%
3.0%
30
60
90
120
1/1312/31/12 4/133/132/13 5/13 6/13 7/5/13
U.S. 10-year Government
Bond Yield
U.S. Treasury Volatility Index
(MOVE Index)
We regard the jump in
yields during the second
quarter as an overreaction.
Source: Bloomberg. The MOVE© (Merrill Option
Volatility Expectations) Index reflects a market esti-
mate of future Treasury bond yield volatility, based on
the average implied volatility across a wide range of
outstanding options on the 2-, 5-, 10-, and 30-year U.S.
Treasury securities.
PUTNAM INVESTMENTS | putnam.com
3
One troubling trend behind this impressive decrease
in unemployment is that the labor force participation rate
has not risen, as it normally would at this point in the cycle.
This anomaly is likely due to the fact that the United
States, like most developed economies, is beginning to
experience the effects of an aging population. This key
statistic bears closer attention as we continue to be on the
lookout for signs of deflation.
Risk assets deserve the benefit of the doubt.
Viewing policy issues and market fundamentals together,
we favor continuity in investment positioning going
into the third quarter. Equities and high-yield credit, we
believe, offer more attractive total return potential than
other interest-rate risk and inflation-sensitive assets,
including TIPS and commodities. We also have a some-
what sanguine view of looming U.S. policy risks. Although
Congress and the President will likely face off again to
raise the debt ceiling, rising tax receipts have reduced
the political sensitivity of the deficit. We do not antici-
pate theatrics that will derail the economy. Similarly, any
tapering by the Fed — either real or implied — is unlikely to
raise the risk of recession.
On a global scale, we regard U.S. and Japanese
equities to be among the most promising assets. The
reforms launched by Japan’s prime minister Shinzo Abe
have sparked both controversy and volatility in equity,
currency, and debt markets. However, we believe Abe
appears poised to consolidate his grip on policy in July’s
elections to the Diet’s upper house, which should allow
him to follow through on the “third arrow” of his agenda,
adding structural reforms to the monetary and fiscal policy
changes already instituted. Given that structural change
would bring the deepest and most sustainable benefits,
we favor a tilt toward Japanese equities as these poli-
cies make their way into legislation over the next several
months. Importantly, expectations are low for true and
sweeping reforms, so any progress on this front would
likely generate a positive surprise.
We have less optimism for Europe and emerging
markets. While the threats of a European deleveraging
event or a hard landing in China remain severely dimin-
ished, we have some concerns about credit conditions in
European peripheral markets and in China’s banking sector.
Meanwhile, China’s economic deceleration is quite clear,
and has implications for a range of other emerging markets
linked to China by trade. One consequence has been a drop
in commodity prices this year, which has contributed to the
underperformance of emerging markets.
Overall, the world is still starved for yield-generating
investments as the major central banks keep policy rates
extremely accommodative. Their efforts are at least
partially in response to the fact that deflation remains a
threat to the global economy. So long as policy measures
can prevent deflation, portfolios should favor equity and
other risk assets over more interest-rate-sensitive bonds.
Figure 2. �Buying a home is easier today than
it has been in more than a generation
National Association of Realtors Home Affordability
Composite Index, 1/31/89–4/30/13
100
125
150
175
200
225
19921/31/89 200420001996 2008 2012 4/30/13
Dynamics of the housing
market include low prices,
low mortgage rates, high
pent-up demand, and insti-
tutional investment.
Sources: Bloomberg, National Association of Realtors. An
index above 100 signifies that a family earning the median
income has more than enough income to qualify for a loan
on a median-priced home.
4
Q3 2013 | Capital Markets Outlook
Asset class views
Equity
U.S. equity In late May, shortly after closing at an all-time
high, the S&P 500 Index pulled back sharply following a
Fed policy meeting that signaled a possible cutback in the
Fed’s bond-buying program. In the weeks that followed,
stocks declined more than 6% before recovering in the
final days of the quarter.
A notable shift from the previous quarter was a pull-
back in the performance of defensive stocks. As investors
became more confident about an improving U.S. economy,
they appeared willing to take on more risk, and cyclical
stocks rebounded. We regarded this development posi-
tively. As equity markets focus more on fundamentals and
valuations, the opportunity to achieve returns at the indi-
vidual stock level appears greater than it has for some time.
Despite relatively sluggish revenue growth for U.S. busi-
nesses, our outlook is constructive for corporate earnings.
In our view, the bulk of profitability is the result of struc-
tural improvement and is likely to be sustainable over time.
In addition, relatively low levels of durable-goods spending
and factory utilization suggest that profit margins have yet
to peak and can move higher from current levels.
While it is important to consider the potential impact of
rising interest rates on U.S. equities, we don’t view this as a
significant risk. At the close of the quarter, long-term rates
still remained near all-time lows, and rising short-term rates
can be beneficial for equity performance, in part because
they typically signal an improving economy. Despite
a slightly less bullish stance overall, our view remains
constructive for U.S. equities, and for the universe of
cyclical stocks in particular, which has yet to fully rebound
and continues to offer many exploitable opportunities.
Non-U.S. equity Rising interest rates, declines
among dividend-paying stocks, and an outflow of capital
from emerging markets all accelerated after the Fed’s
announcement in mid June, and sapped global equity
market strength.
Despite these macro fears, we see exciting funda-
mental developments among non-U.S. equities in terms of
product cycles, business model improvement, and break-
through technologies. Innovation is happening across a
variety of sectors, and may hold important implications
for companies’ top-line growth. This cuts across tradition-
ally innovation-driven areas, such as biotech, and newer
zones of innovation like “big data.” But it extends as well to
more stable industries, such as food and beverage, where
Figure 3. �People staying out of the job hunt
might be a sign of an aging workforce
U.S. Labor Force Participation Rate, 12/31/89–6/30/13
62%
64%
66%
68%
199212/31/89 200420001996 2008 2012 6/30/13
The labor force participation
rate has not risen as it
normally would at this point
of the cycle.
Source: Bureau of Labor Statistics. This rate represents the
percentage of the civilian population participating in the
labor market, either employed or seeking jobs.
PUTNAM INVESTMENTS | putnam.com
5
MARKET TRENDS
Index name (returns in USD) Q2 13
12 months
ended
6/30/13
EQUITY INDEXES
Dow Jones Industrial Average 2.92% 18.87%
S&P 500 2.91 20.60
MSCI World (ND) 0.64 18.58
MSCI EAFE (ND) -0.99 18.62
MSCI Europe (ND) -0.51 18.86
MSCI Emerging Markets (ND) -7.88 2.87
Tokyo Topix -0.05 16.64
Russell 1000 2.65 21.24
Russell 2000 3.08 24.21
Russell 3000 Growth 2.19 17.56
Russell 3000 Value 3.14 25.28
FIXED INCOME INDEXES
Barclays U.S. Aggregate Bond -2.33 -0.69
Barclays 10-Year Bellwether -4.57 -4.20
Barclays Government Bond -1.88 -1.51
Barclays MBS -1.96 -1.10
Barclays Municipal Bond -2.97 0.24
BofA ML 3-Month T-bill 0.02 0.11
CG World Government Bond ex-U.S. -3.44 -5.72
JPMorgan Developed High Yield -1.26 9.74
JPMorgan Global High Yield -1.76 9.47
JPMorgan Emerging Markets Global
Diversified -5.64 1.11
S&P LSTA Loan 0.19 7.32
COMMODITIES
S&P GSCI -5.93 2.04
It is not possible to invest directly in an index. Past performance is not
indicative of future results.
new products are having an enormous impact on compa-
nies’ future growth potential, and where new consumer
packaging ideas can revitalize mundane and well-worn
consumer products by changing how they are delivered to
customers.
Two zones of risk to watch are Japan and China, which
will rely on the sustainability of the weak yen and avoiding
an excessively damaging slowdown. We are also attentive
to risks in Europe, which we expect may experience flat
growth but could generate a positive economic surprise.
In short, despite potential bumps in the road to Europe’s
recovery, we believe there is an opportunity in the making
among European stocks.
Fixed income
U.S. fixed income The Fed’s comments about reducing
its asset purchase program generated significant
interest-rate volatility in the United States, changing
the opportunity set for fixed-income investors. Spread
sectors — meaning sectors that trade at a yield premium
to U.S. Treasuries — which had been buoyed by the
massive liquidity created by the Fed’s purchases, sold off,
with emerging-market bonds getting hit particularly hard.
Global government bonds also fell, although not to the
same degree as sectors with greater risk.
Despite the rapid increase in yields, we believe the
broader U.S. economic recovery remains on track and
should continue at a moderate pace, as recent data have
been a bit better than expected. We also believe that
the U.S. housing recovery will continue apace, although
mortgage rates moved higher during May and June. In
our view, home sales are improving because of stronger
economic activity and better consumer confidence, not
because of mortgage rates. In mortgage credit, following
the liquidity-driven sell-off, we have found opportunities
attractive enough in non-agency residential mortgage-
backed securities to begin rebuilding positions during
June, seeking to benefit from their improved relative value
supported by solid fundamentals.
As investors adjust their expectations about when
the Fed will actually begin tapering its asset purchases,
we expect continued volatility in interest rates and yield
spreads. However, we think it’s unlikely that they are going
to suddenly spike dramatically higher. As a result, we believe
the environment for corporate credit and other risk-based
fixed-income categories may continue to be favorable.
In term structure, we think the better opportunities
exist among short- to intermediate-maturity securities, as
opposed to long-term bonds. Within investment-grade
corporate credit, we like bonds issued by banks and other
financial institutions, as well as utilities. High-yield spreads,
after backing up during the second quarter, offer more
attractive value, we believe.
6
Q3 2013 | Capital Markets Outlook
Non-U.S. fixed income The global macroeconomic
environment, though less solid than the United States,
appears to be stable, with the exception of China, where
weaker growth and high consumer debt levels have
created challenges for a government that is trying to stim-
ulate domestic demand. We continue to see challenges
more broadly for developing economies, hampered by
both the strength of the U.S. dollar and the anticipation for
less stimulus from the Fed. In Europe, peripheral eurozone
economies have performed better than we anticipated,
thanks to sharply lower interest rates in those countries.
Core European economies were somewhat weaker
than we expected, but data near the end of the quarter
from Germany, the Netherlands, and Switzerland were
encouraging.
While we think the degree of increase in global rates
during the quarter was more than the current economic
environment warrants, leaving less impetus for near-term
increases, we continue to believe global rates are likely to
move higher over the medium- to longer-term horizon.
Tax exempt Although the municipal market experi-
enced a notable sell-off along with most fixed-income
asset classes from May into June, we continue to have
a constructive outlook and believe munis still offer a
good option for investors seeking tax-exempt income.
Although significant outflows have compounded the
sell-off in municipal bonds, typically in July and August
reinvestment demand becomes more favorable; and total
supply is down 11.5% year-over-year through the end of
June. This could bolster the supply/demand picture. Aside
from isolated credits such as Detroit and Puerto Rico,
fundamentals within the municipal market are generally
improving. It is likely that factors such as interest rates and
the direction of the economy could continue to influence
market activity.
A degree of uncertainty over tax policy has been
clarified, as income tax rates for 2013 are now certain.
However, other policy issues that can affect the value of
municipal bonds remain unresolved, including federal
budget sequestration, the debt ceiling, and the potential
for broader tax reform. We are monitoring developments
in these areas.
As has been our strategy for some time, we continued
to favor essential service revenue bonds over local
general obligation bonds. From a credit-quality perspec-
tive, overall default rates remain low. In our analysis, the
A-rated and BBB-rated segments of the market continue
to offer attractive relative value opportunities. We
generally favor higher-yielding sectors and issues with
below-average sensitivity to interest rates.
Commodities
Our commodity outlook has turned pessimistic. The
asset class generally behaves with more momentum than
reversion, and we are coming off a very weak second
quarter. Beyond the negative momentum, the weakness
in emerging markets represents a very problematic signal
for commodities.
While the outlook might be negative, there are two
major sources of upside risk. Geopolitical concerns are
at a high point in the Middle East, with political tensions
in Egypt and continued strife in Syria. Egypt represents a
risk above and beyond the general area instability, as any
disruption to the Suez Canal has the potential to cause
a supply shock for energy markets. The other source of
upside risk for commodities is the continued correlation
with equity markets. While they have fallen from recent
highs, the strong correlations suggest that commodities
will outperform as an asset class in the event of a risk rally.
To reconcile the two countering views, we advocate a
more modest underweight to the asset class.
Currency
We favor long positions in the U.S. dollar. Over the
medium term, the U.S. dollar should be supported by a
relatively better growth outlook, a gradual reduction in
the pace of accommodation by the Federal Open Market
Committee, and the effect of forward guidance about the
first rate hike in 2015.
For the euro, as well, we favor a slight long position, but
not against the U.S. dollar. The single currency remains
supported by healthy trade flows — the eurozone is set to
run a current account surplus exceeding 2% of GDP this
year. We are moderately pessimistic on the British pound
sterling given prospects for a continued easing policy. In
the Japanese yen, we expect renewed weakness. Over the
medium term, the Bank of Japan is expected to increase
easing, and this should provide further impetus for the
U.S. dollar to rally versus the yen.
Emerging-market currencies remain over-owned in
a world where the U.S. term structure is likely to grind
higher, we believe. Amid lower levels of global growth and
lower commodity prices and inflation, emerging-market
central banks have shifted into easing mode. With weaker
current account surpluses in emerging markets, large
capital outflows are a major risk for emerging-market
currencies.
PUTNAM INVESTMENTS | putnam.com
7
TheBarclaysGovernmentBondIndexisanunmanagedindexofU.S.Treasuryand
governmentagencybonds.
TheBarclaysMunicipalBondIndexisanunmanagedindexoflong-termfixed-rate
investment-gradetax-exemptbonds.
TheBarclays10-YearU.S.TreasuryBellwetherIndexisanunmanagedindexofU.S.
Treasurybondswith10years’maturity.
TheBarclaysU.S.AggregateBondIndexisanunmanagedindexusedasageneral
measureofU.S.fixed-incomesecurities.
TheBarclaysU.S.Mortgage-BackedSecurities(MBS)Indexcoversagency
mortgage-backedpass-throughsecurities(bothfixed-rateandhybridARM)issuedby
GinnieMae(GNMA),FannieMae(FNMA),andFreddieMac(FHLMC).
TheBofAMerrillLynchU.S.3-MonthTreasuryBillIndexconsistsofU.S.Treasurybills
maturingin90days.
TheCitigroupNon-U.S.WorldGovernmentBondIndexisanunmanagedindex
generallyconsideredtoberepresentativeoftheworldbondmarketexcludingthe
UnitedStates.
TheDowJonesIndustrialAverageIndex(DJIA)isanunmanagedindexcomposed
of30blue-chipstockswhoseonebindingsimilarityistheirhugeness—eachhassales
peryearthatexceed$7bil��lion.TheDJIAhasbeenprice-weightedsinceitsinception
onMay26,1896,reflectslarge-capcompaniesrepresentativeofU.S.industry,and
historicallyhasmovedintandemwithothermajormarketindexessuchastheS&P500.
TheJPMorganDevelopedHighYieldIndexisanunmanagedindexofhigh-yield
fixed-incomesecuritiesissuedindevelopedcountries.
TheJPMorganEmergingMarketsGlobalDiversifiedIndexiscomposedofU.S.
dollar-denominatedBradybonds,eurobonds,tradedloans,andlocalmarketdebt
instrumentsissuedbysovereignandquasi-sovereignentities.
JPMorganGlobalHighYieldIndexisanunmanagedindexofglobalhigh-yield
fixed-incomesecurities.
TheMSCIEAFEIndexisanunmanagedlistofequitysecuritiesfromEuropeand
Australasia,withallvaluesexpressedinU.S.dollars.
TheMSCIEmergingMarketsIndexisafree-float-adjustedmarket-capitalization-
weightedindexthatisdesignedtomeasureequitymarketperformanceintheglobal
emergingmarkets.
TheMSCIEuropeIndexisanunmanagedlistofequitysecuritiesoriginatinginanyof15
Europeancountries,withallvaluesexpressedinU.S.dollars.
TheMSCIWorldIndexisanunmanagedlistofsecuritiesfromdevelopedandemerging
markets,withallvaluesexpressedinU.S.dollars.
TheRussell1000Indexisanunmanagedindexofthe1,000largestU.S.companies.
TheRussell2000Indexisanunmanagedlistofcommonstocksthatisfrequentlyused
asageneralperformancemeasureofU.S.stocksofsmalland/ormidsizecompanies.
Russell3000GrowthIndexisanunmanagedindexofthosecompaniesinthebroad-
marketRussell3000Indexchosenfortheirgrowthorientation.
Russell3000ValueIndexisanunmanagedindexofthosecompaniesinthebroad-
marketRussell3000Indexchosenfortheirvalueorientation.
TheS&PGSCIisacompositeindexofcommoditysectorreturnsthatrepresentsa
broadlydiversified,unleveraged,long-onlypositionincommodityfutures.
TheS&P/LSTALeveragedLoanIndex(LLI)isanunmanagedindexofU.S.leveraged
loans.
TheS&P500Indexisanunmanagedlistofcommonstocksthatisfrequentlyusedasa
generalmeasureofU.S.stockmarketperformance.
TheTokyoStockExchangeIndex(TOPIX)isamarket-capitalization-weightedindexof
over1,100stockstradedintheJapanesemarket.
NOTES
This material is provided for limited purposes. It is not intended as an offer or solicitation for the purchase or sale of any financial instrument,
or any Putnam product or strategy. References to specific securities, asset classes, and financial markets are for illustrative purposes
only and are not intended to be, and should not be interpreted as, recommendations or investment advice. The opinions expressed in this
article represent the current, good-faith views of Putnam senior portfolio managers at the time of publication. The views are provided
for informational purposes only and are subject to change. This material does not take into account any investor’s particular investment
objectives, strategies, tax status, or investment horizon. The views and strategies described herein may not be suitable for all investors.
Investors should consult a financial advisor for advice suited to their individual financial needs. Putnam Investments cannot guarantee the
accuracy or completeness of any statements or data contained in the article. Predictions, opinions, and other information contained in
this article are subject to change. Any forward-looking statements speak only as of the date they are made, and Putnam assumes no duty
to update them. Forward-looking statements are subject to numerous assumptions, risks, and uncertainties. Actual results could differ
materially from those anticipated. Past performance is not a guarantee of future results. As with any investment, there is a potential for
profit as well as the possibility of loss.
This presentation or any portion hereof may not be reprinted, sold, or redistributed in whole or in part without the express written consent
of Putnam Investments. The information provided relates to Putnam Investments and its affiliates, which include The Putnam Advisory
Company, LLC and Putnam Investments Limited®.
Prepared for use in Canada by Putnam Investments Inc. [Investissements Putnam Inc.] (o/a Putnam Management in Manitoba). Where
permitted, advisory services are provided in Canada by Putnam Investments Inc. [Investissements Putnam Inc.] (o/a Putnam Management
in Manitoba) and its affiliate, The Putnam Advisory Company, LLC.
Diversification does not assure a profit or protect against loss. It is possible to lose money in a diversified portfolio.
In the United States, mutual funds are distributed by Putnam Retail Management.
putnam.com� CM0100 282203 7/13
Consider these risks before investing: International investing involves certain risks, such as currency fluctuations,
economic instability, and political developments. Investments in small and/or midsize companies increase the risk of
greater price fluctuations. Bond investments are subject to interest-rate risk, which means the prices of the fund’s bond
investments are likely to fall if interest rates rise. Bond investments also are subject to credit risk, which is the risk that the
issuer of the bond may default on payment of interest or principal. Interest-rate risk is generally greater for longer-term
bonds, and credit risk is generally greater for below-investment-grade bonds, which may be considered speculative.
Unlike bonds, funds that invest in bonds have ongoing fees and expenses. Lower-rated bonds may offer higher yields in
return for more risk. Funds that invest in government securities are not guaranteed. Mortgage-backed securities are subject
to prepayment risk. Commodities involve the risks of changes in market, political, regulatory, and natural conditions.
Scan code or visit putnam.com/outlook
for more insight on the global
investment landscape.
Visit putnam.com for news and information,
and our Perspectives blog for in-depth
analysis on a range of investment topics.
If you are a U.S. retail investor, please request a prospectus, or a summary prospectus if available, from your financial
representative or by calling Putnam at 1-800-225-1581. The prospectus includes investment objectives, risks, fees,
expenses, and other information that you should read and consider carefully before investing.

More Related Content

What's hot

Putnam Perspective: Fixed Income Outlook Q2 2014
Putnam Perspective: Fixed Income Outlook Q2 2014Putnam Perspective: Fixed Income Outlook Q2 2014
Putnam Perspective: Fixed Income Outlook Q2 2014Putnam Investments
 
Investment Mid year outlook by Linked Investments, Ltd
Investment Mid year outlook by Linked Investments, LtdInvestment Mid year outlook by Linked Investments, Ltd
Investment Mid year outlook by Linked Investments, LtdLinked Investments, Ltd.
 
Signs of an impending stock market crash
Signs of an impending stock market crashSigns of an impending stock market crash
Signs of an impending stock market crashSwapnilRege2
 
A Checklist for Wanna-be Helicopter Pilots
A Checklist for Wanna-be Helicopter PilotsA Checklist for Wanna-be Helicopter Pilots
A Checklist for Wanna-be Helicopter PilotsAndrea Iannelli
 
LBS Asset Allocation August Update - July 28, 2017
LBS Asset Allocation August Update - July 28, 2017LBS Asset Allocation August Update - July 28, 2017
LBS Asset Allocation August Update - July 28, 2017Mark MacIsaac
 
2013.10.10 accuvest bpv-q4
2013.10.10 accuvest bpv-q42013.10.10 accuvest bpv-q4
2013.10.10 accuvest bpv-q4advisorshares
 
Capital Market 1st Quarter 2010
Capital Market 1st Quarter 2010Capital Market 1st Quarter 2010
Capital Market 1st Quarter 2010pospime
 
Brent woyat q2 2014 pimg commentary jul2014
Brent woyat q2 2014 pimg commentary jul2014Brent woyat q2 2014 pimg commentary jul2014
Brent woyat q2 2014 pimg commentary jul2014bwoyat
 
FI Insights V17I1 Print Version
FI Insights V17I1 Print VersionFI Insights V17I1 Print Version
FI Insights V17I1 Print VersionDean Miller
 
Trekking markets & more with Investrekk
Trekking markets & more with InvestrekkTrekking markets & more with Investrekk
Trekking markets & more with InvestrekkInves Trekk
 
Global market perspective q3-2013
Global market perspective q3-2013Global market perspective q3-2013
Global market perspective q3-2013World Office Forum
 
Fasanara Capital | Investment Outlook | October 26th 2015
Fasanara Capital | Investment Outlook | October 26th 2015Fasanara Capital | Investment Outlook | October 26th 2015
Fasanara Capital | Investment Outlook | October 26th 2015Fasanara Capital ltd
 
Investor Compass - Portfolio Manager Viewpoints
Investor Compass - Portfolio Manager ViewpointsInvestor Compass - Portfolio Manager Viewpoints
Investor Compass - Portfolio Manager Viewpointsadvisorshares
 
To the Point, November 26 2009
To the Point, November 26 2009To the Point, November 26 2009
To the Point, November 26 2009Swedbank
 
Fasanara Capital | Investment Outlook | June 1st 2015
Fasanara Capital | Investment Outlook | June 1st 2015Fasanara Capital | Investment Outlook | June 1st 2015
Fasanara Capital | Investment Outlook | June 1st 2015Fasanara Capital ltd
 
Abstract from MARCH 2012 fasanara 'fat tail risk hedging programs' FTRHPs
Abstract from MARCH 2012 fasanara 'fat tail risk hedging programs' FTRHPsAbstract from MARCH 2012 fasanara 'fat tail risk hedging programs' FTRHPs
Abstract from MARCH 2012 fasanara 'fat tail risk hedging programs' FTRHPsFasanara Capital ltd
 
BMO-TCH-Mid-Q3-Update_FINAL
BMO-TCH-Mid-Q3-Update_FINALBMO-TCH-Mid-Q3-Update_FINAL
BMO-TCH-Mid-Q3-Update_FINALAdam Phillips
 
July 15 I Session 1 I GBIH
July 15 I Session 1 I GBIHJuly 15 I Session 1 I GBIH
July 15 I Session 1 I GBIHGBIHSupport
 

What's hot (20)

Putnam Perspective: Fixed Income Outlook Q2 2014
Putnam Perspective: Fixed Income Outlook Q2 2014Putnam Perspective: Fixed Income Outlook Q2 2014
Putnam Perspective: Fixed Income Outlook Q2 2014
 
Investment Mid year outlook by Linked Investments, Ltd
Investment Mid year outlook by Linked Investments, LtdInvestment Mid year outlook by Linked Investments, Ltd
Investment Mid year outlook by Linked Investments, Ltd
 
Signs of an impending stock market crash
Signs of an impending stock market crashSigns of an impending stock market crash
Signs of an impending stock market crash
 
A Checklist for Wanna-be Helicopter Pilots
A Checklist for Wanna-be Helicopter PilotsA Checklist for Wanna-be Helicopter Pilots
A Checklist for Wanna-be Helicopter Pilots
 
LBS Asset Allocation August Update - July 28, 2017
LBS Asset Allocation August Update - July 28, 2017LBS Asset Allocation August Update - July 28, 2017
LBS Asset Allocation August Update - July 28, 2017
 
2013.10.10 accuvest bpv-q4
2013.10.10 accuvest bpv-q42013.10.10 accuvest bpv-q4
2013.10.10 accuvest bpv-q4
 
Capital Market 1st Quarter 2010
Capital Market 1st Quarter 2010Capital Market 1st Quarter 2010
Capital Market 1st Quarter 2010
 
Brent woyat q2 2014 pimg commentary jul2014
Brent woyat q2 2014 pimg commentary jul2014Brent woyat q2 2014 pimg commentary jul2014
Brent woyat q2 2014 pimg commentary jul2014
 
FI Insights V17I1 Print Version
FI Insights V17I1 Print VersionFI Insights V17I1 Print Version
FI Insights V17I1 Print Version
 
2013 Mid Year Outlook
2013 Mid Year Outlook2013 Mid Year Outlook
2013 Mid Year Outlook
 
Trekking markets & more with Investrekk
Trekking markets & more with InvestrekkTrekking markets & more with Investrekk
Trekking markets & more with Investrekk
 
Global market perspective q3-2013
Global market perspective q3-2013Global market perspective q3-2013
Global market perspective q3-2013
 
Fasanara Capital | Investment Outlook | October 26th 2015
Fasanara Capital | Investment Outlook | October 26th 2015Fasanara Capital | Investment Outlook | October 26th 2015
Fasanara Capital | Investment Outlook | October 26th 2015
 
2009 Market Outlook
2009 Market Outlook2009 Market Outlook
2009 Market Outlook
 
Investor Compass - Portfolio Manager Viewpoints
Investor Compass - Portfolio Manager ViewpointsInvestor Compass - Portfolio Manager Viewpoints
Investor Compass - Portfolio Manager Viewpoints
 
To the Point, November 26 2009
To the Point, November 26 2009To the Point, November 26 2009
To the Point, November 26 2009
 
Fasanara Capital | Investment Outlook | June 1st 2015
Fasanara Capital | Investment Outlook | June 1st 2015Fasanara Capital | Investment Outlook | June 1st 2015
Fasanara Capital | Investment Outlook | June 1st 2015
 
Abstract from MARCH 2012 fasanara 'fat tail risk hedging programs' FTRHPs
Abstract from MARCH 2012 fasanara 'fat tail risk hedging programs' FTRHPsAbstract from MARCH 2012 fasanara 'fat tail risk hedging programs' FTRHPs
Abstract from MARCH 2012 fasanara 'fat tail risk hedging programs' FTRHPs
 
BMO-TCH-Mid-Q3-Update_FINAL
BMO-TCH-Mid-Q3-Update_FINALBMO-TCH-Mid-Q3-Update_FINAL
BMO-TCH-Mid-Q3-Update_FINAL
 
July 15 I Session 1 I GBIH
July 15 I Session 1 I GBIHJuly 15 I Session 1 I GBIH
July 15 I Session 1 I GBIH
 

Viewers also liked

Putnam Investments: Pathway to Independence
Putnam Investments: Pathway to IndependencePutnam Investments: Pathway to Independence
Putnam Investments: Pathway to IndependencePutnam Investments
 
Putnam Investments: Making your nest egg last
Putnam Investments: Making your nest egg lastPutnam Investments: Making your nest egg last
Putnam Investments: Making your nest egg lastPutnam Investments
 
Fostering innovation to improve retirement security
Fostering innovation to improve retirement securityFostering innovation to improve retirement security
Fostering innovation to improve retirement securityPutnam Investments
 
Putnam Equity Income Fund Q&A Q2 2013
Putnam Equity Income Fund Q&A Q2 2013Putnam Equity Income Fund Q&A Q2 2013
Putnam Equity Income Fund Q&A Q2 2013Putnam Investments
 
Putnam Global Income Trust Q&A Q2 2013
Putnam Global Income Trust Q&A Q2 2013Putnam Global Income Trust Q&A Q2 2013
Putnam Global Income Trust Q&A Q2 2013Putnam Investments
 
Solving America's Lifetime Income Challenge
Solving America's Lifetime Income ChallengeSolving America's Lifetime Income Challenge
Solving America's Lifetime Income ChallengePutnam Investments
 
Robert L. Reynolds: New thinking, new solutions
Robert L. Reynolds: New thinking, new solutionsRobert L. Reynolds: New thinking, new solutions
Robert L. Reynolds: New thinking, new solutionsPutnam Investments
 
Putnam Social Media Survey 2014
Putnam Social Media Survey 2014Putnam Social Media Survey 2014
Putnam Social Media Survey 2014Putnam Investments
 
Putnam Dynamic Risk Allocation Fund Q&A Q2 2013
Putnam Dynamic Risk Allocation Fund Q&A Q2 2013Putnam Dynamic Risk Allocation Fund Q&A Q2 2013
Putnam Dynamic Risk Allocation Fund Q&A Q2 2013Putnam Investments
 
Putnam Absolute Return Funds Q&A Q2 2013
Putnam Absolute Return Funds Q&A Q2 2013Putnam Absolute Return Funds Q&A Q2 2013
Putnam Absolute Return Funds Q&A Q2 2013Putnam Investments
 
Putnam Investment's 2015 Financial Advisors and Social Media Survey
Putnam Investment's 2015 Financial Advisors and Social Media SurveyPutnam Investment's 2015 Financial Advisors and Social Media Survey
Putnam Investment's 2015 Financial Advisors and Social Media SurveyPutnam Investments
 

Viewers also liked (11)

Putnam Investments: Pathway to Independence
Putnam Investments: Pathway to IndependencePutnam Investments: Pathway to Independence
Putnam Investments: Pathway to Independence
 
Putnam Investments: Making your nest egg last
Putnam Investments: Making your nest egg lastPutnam Investments: Making your nest egg last
Putnam Investments: Making your nest egg last
 
Fostering innovation to improve retirement security
Fostering innovation to improve retirement securityFostering innovation to improve retirement security
Fostering innovation to improve retirement security
 
Putnam Equity Income Fund Q&A Q2 2013
Putnam Equity Income Fund Q&A Q2 2013Putnam Equity Income Fund Q&A Q2 2013
Putnam Equity Income Fund Q&A Q2 2013
 
Putnam Global Income Trust Q&A Q2 2013
Putnam Global Income Trust Q&A Q2 2013Putnam Global Income Trust Q&A Q2 2013
Putnam Global Income Trust Q&A Q2 2013
 
Solving America's Lifetime Income Challenge
Solving America's Lifetime Income ChallengeSolving America's Lifetime Income Challenge
Solving America's Lifetime Income Challenge
 
Robert L. Reynolds: New thinking, new solutions
Robert L. Reynolds: New thinking, new solutionsRobert L. Reynolds: New thinking, new solutions
Robert L. Reynolds: New thinking, new solutions
 
Putnam Social Media Survey 2014
Putnam Social Media Survey 2014Putnam Social Media Survey 2014
Putnam Social Media Survey 2014
 
Putnam Dynamic Risk Allocation Fund Q&A Q2 2013
Putnam Dynamic Risk Allocation Fund Q&A Q2 2013Putnam Dynamic Risk Allocation Fund Q&A Q2 2013
Putnam Dynamic Risk Allocation Fund Q&A Q2 2013
 
Putnam Absolute Return Funds Q&A Q2 2013
Putnam Absolute Return Funds Q&A Q2 2013Putnam Absolute Return Funds Q&A Q2 2013
Putnam Absolute Return Funds Q&A Q2 2013
 
Putnam Investment's 2015 Financial Advisors and Social Media Survey
Putnam Investment's 2015 Financial Advisors and Social Media SurveyPutnam Investment's 2015 Financial Advisors and Social Media Survey
Putnam Investment's 2015 Financial Advisors and Social Media Survey
 

Similar to Putnam Outlook Q3 2013

2017 Investment Outlook & Issues_FINAL_booklet format
2017 Investment Outlook & Issues_FINAL_booklet format2017 Investment Outlook & Issues_FINAL_booklet format
2017 Investment Outlook & Issues_FINAL_booklet formatJuliane Morris, MBA, CWS
 
Quarterly investment Outlook Q3 2015
Quarterly investment Outlook Q3 2015Quarterly investment Outlook Q3 2015
Quarterly investment Outlook Q3 2015Graeme Cross
 
BlackRock: 2014 Outlook The List - What to Know, What to Do
BlackRock: 2014 Outlook The List - What to Know, What to DoBlackRock: 2014 Outlook The List - What to Know, What to Do
BlackRock: 2014 Outlook The List - What to Know, What to DoEcon Matters
 
2 william blair global market outlook - december 2013
2 william blair global market outlook - december 20132 william blair global market outlook - december 2013
2 william blair global market outlook - december 2013123jumpad
 
Pictet Asset Management Perspectives
Pictet Asset Management PerspectivesPictet Asset Management Perspectives
Pictet Asset Management PerspectivesForward Management
 
First Quarter Market Insight
First Quarter Market InsightFirst Quarter Market Insight
First Quarter Market InsightLarry Nordmann
 
The Fed's Asset Purchases
The Fed's Asset PurchasesThe Fed's Asset Purchases
The Fed's Asset PurchasesJeff Green
 
LPL Financial Research Outlook 2013
LPL Financial Research Outlook 2013LPL Financial Research Outlook 2013
LPL Financial Research Outlook 2013XML Financial Group
 
Arbuthnot Latham: Global Markets Report Q1 2019
Arbuthnot Latham: Global Markets Report Q1 2019Arbuthnot Latham: Global Markets Report Q1 2019
Arbuthnot Latham: Global Markets Report Q1 2019Siôn Puckle
 
Global Insight-Wake Me Up When September Begins
Global Insight-Wake Me Up When September BeginsGlobal Insight-Wake Me Up When September Begins
Global Insight-Wake Me Up When September BeginsDavid Apted
 
Welcome, President Obama
Welcome, President ObamaWelcome, President Obama
Welcome, President Obamajsalter78
 
Market Perspectives - December 2016
Market Perspectives - December 2016Market Perspectives - December 2016
Market Perspectives - December 2016Mark Biegel
 
Putnam municipal bond funds Q&A Q2 2013
Putnam municipal bond funds Q&A Q2 2013Putnam municipal bond funds Q&A Q2 2013
Putnam municipal bond funds Q&A Q2 2013Putnam Investments
 
Investors Lament
Investors LamentInvestors Lament
Investors Lamentpopeni
 
Investors Lament
Investors LamentInvestors Lament
Investors Lamentkvezino
 
Investors Lament
Investors LamentInvestors Lament
Investors LamentRlevinsohn
 
Current Thinking, Q1 2014
Current Thinking, Q1 2014Current Thinking, Q1 2014
Current Thinking, Q1 2014Kevin Lenox
 

Similar to Putnam Outlook Q3 2013 (20)

TAP QuarterlyLetter 201603
TAP QuarterlyLetter 201603TAP QuarterlyLetter 201603
TAP QuarterlyLetter 201603
 
2017 Investment Outlook & Issues_FINAL_booklet format
2017 Investment Outlook & Issues_FINAL_booklet format2017 Investment Outlook & Issues_FINAL_booklet format
2017 Investment Outlook & Issues_FINAL_booklet format
 
Mid-Year Outlook 2013
Mid-Year Outlook 2013Mid-Year Outlook 2013
Mid-Year Outlook 2013
 
Mid year update
Mid year updateMid year update
Mid year update
 
Quarterly investment Outlook Q3 2015
Quarterly investment Outlook Q3 2015Quarterly investment Outlook Q3 2015
Quarterly investment Outlook Q3 2015
 
BlackRock: 2014 Outlook The List - What to Know, What to Do
BlackRock: 2014 Outlook The List - What to Know, What to DoBlackRock: 2014 Outlook The List - What to Know, What to Do
BlackRock: 2014 Outlook The List - What to Know, What to Do
 
2 william blair global market outlook - december 2013
2 william blair global market outlook - december 20132 william blair global market outlook - december 2013
2 william blair global market outlook - december 2013
 
Pictet Asset Management Perspectives
Pictet Asset Management PerspectivesPictet Asset Management Perspectives
Pictet Asset Management Perspectives
 
First Quarter Market Insight
First Quarter Market InsightFirst Quarter Market Insight
First Quarter Market Insight
 
The Fed's Asset Purchases
The Fed's Asset PurchasesThe Fed's Asset Purchases
The Fed's Asset Purchases
 
LPL Financial Research Outlook 2013
LPL Financial Research Outlook 2013LPL Financial Research Outlook 2013
LPL Financial Research Outlook 2013
 
Arbuthnot Latham: Global Markets Report Q1 2019
Arbuthnot Latham: Global Markets Report Q1 2019Arbuthnot Latham: Global Markets Report Q1 2019
Arbuthnot Latham: Global Markets Report Q1 2019
 
Global Insight-Wake Me Up When September Begins
Global Insight-Wake Me Up When September BeginsGlobal Insight-Wake Me Up When September Begins
Global Insight-Wake Me Up When September Begins
 
Welcome, President Obama
Welcome, President ObamaWelcome, President Obama
Welcome, President Obama
 
Market Perspectives - December 2016
Market Perspectives - December 2016Market Perspectives - December 2016
Market Perspectives - December 2016
 
Putnam municipal bond funds Q&A Q2 2013
Putnam municipal bond funds Q&A Q2 2013Putnam municipal bond funds Q&A Q2 2013
Putnam municipal bond funds Q&A Q2 2013
 
Investors Lament
Investors LamentInvestors Lament
Investors Lament
 
Investors Lament
Investors LamentInvestors Lament
Investors Lament
 
Investors Lament
Investors LamentInvestors Lament
Investors Lament
 
Current Thinking, Q1 2014
Current Thinking, Q1 2014Current Thinking, Q1 2014
Current Thinking, Q1 2014
 

More from Putnam Investments

Putnam Lifetime Income Survey 2013
Putnam Lifetime Income Survey 2013Putnam Lifetime Income Survey 2013
Putnam Lifetime Income Survey 2013Putnam Investments
 
Putnam Fixed Income Outlook Q4 2013
Putnam Fixed Income Outlook Q4 2013Putnam Fixed Income Outlook Q4 2013
Putnam Fixed Income Outlook Q4 2013Putnam Investments
 
Putnam Income Fund Q&A Q2 2013
Putnam Income Fund Q&A Q2 2013Putnam Income Fund Q&A Q2 2013
Putnam Income Fund Q&A Q2 2013Putnam Investments
 
Putnam Lifetime Income Scores III
Putnam Lifetime Income Scores IIIPutnam Lifetime Income Scores III
Putnam Lifetime Income Scores IIIPutnam Investments
 
Taxes after the fiscal cliff: Planning opportunities in 2013
Taxes after the fiscal cliff: Planning opportunities in 2013Taxes after the fiscal cliff: Planning opportunities in 2013
Taxes after the fiscal cliff: Planning opportunities in 2013Putnam Investments
 
Putnam Investments: You can take it with you
Putnam Investments: You can take it with youPutnam Investments: You can take it with you
Putnam Investments: You can take it with youPutnam Investments
 

More from Putnam Investments (10)

The Parquet by the numbers
The Parquet by the numbersThe Parquet by the numbers
The Parquet by the numbers
 
Who is the social advisor?
Who is the social advisor?Who is the social advisor?
Who is the social advisor?
 
Putnam Lifetime Income Survey 2013
Putnam Lifetime Income Survey 2013Putnam Lifetime Income Survey 2013
Putnam Lifetime Income Survey 2013
 
Putnam Fixed Income Outlook Q4 2013
Putnam Fixed Income Outlook Q4 2013Putnam Fixed Income Outlook Q4 2013
Putnam Fixed Income Outlook Q4 2013
 
Putnam Social Media Survey
Putnam Social Media SurveyPutnam Social Media Survey
Putnam Social Media Survey
 
Putnam Income Fund Q&A Q2 2013
Putnam Income Fund Q&A Q2 2013Putnam Income Fund Q&A Q2 2013
Putnam Income Fund Q&A Q2 2013
 
Putnam Lifetime Income Scores III
Putnam Lifetime Income Scores IIIPutnam Lifetime Income Scores III
Putnam Lifetime Income Scores III
 
New Thinking, New Solutions
New Thinking, New Solutions New Thinking, New Solutions
New Thinking, New Solutions
 
Taxes after the fiscal cliff: Planning opportunities in 2013
Taxes after the fiscal cliff: Planning opportunities in 2013Taxes after the fiscal cliff: Planning opportunities in 2013
Taxes after the fiscal cliff: Planning opportunities in 2013
 
Putnam Investments: You can take it with you
Putnam Investments: You can take it with youPutnam Investments: You can take it with you
Putnam Investments: You can take it with you
 

Recently uploaded

Call Girls Near Me WhatsApp:+91-9833363713
Call Girls Near Me WhatsApp:+91-9833363713Call Girls Near Me WhatsApp:+91-9833363713
Call Girls Near Me WhatsApp:+91-9833363713Sonam Pathan
 
Quantitative Analysis of Retail Sector Companies
Quantitative Analysis of Retail Sector CompaniesQuantitative Analysis of Retail Sector Companies
Quantitative Analysis of Retail Sector Companiesprashantbhati354
 
Lundin Gold April 2024 Corporate Presentation v4.pdf
Lundin Gold April 2024 Corporate Presentation v4.pdfLundin Gold April 2024 Corporate Presentation v4.pdf
Lundin Gold April 2024 Corporate Presentation v4.pdfAdnet Communications
 
The Core Functions of the Bangko Sentral ng Pilipinas
The Core Functions of the Bangko Sentral ng PilipinasThe Core Functions of the Bangko Sentral ng Pilipinas
The Core Functions of the Bangko Sentral ng PilipinasCherylouCamus
 
(办理学位证)加拿大萨省大学毕业证成绩单原版一比一
(办理学位证)加拿大萨省大学毕业证成绩单原版一比一(办理学位证)加拿大萨省大学毕业证成绩单原版一比一
(办理学位证)加拿大萨省大学毕业证成绩单原版一比一S SDS
 
《加拿大本地办假证-寻找办理Dalhousie毕业证和达尔豪斯大学毕业证书的中介代理》
《加拿大本地办假证-寻找办理Dalhousie毕业证和达尔豪斯大学毕业证书的中介代理》《加拿大本地办假证-寻找办理Dalhousie毕业证和达尔豪斯大学毕业证书的中介代理》
《加拿大本地办假证-寻找办理Dalhousie毕业证和达尔豪斯大学毕业证书的中介代理》rnrncn29
 
Stock Market Brief Deck for "this does not happen often".pdf
Stock Market Brief Deck for "this does not happen often".pdfStock Market Brief Deck for "this does not happen often".pdf
Stock Market Brief Deck for "this does not happen often".pdfMichael Silva
 
SBP-Market-Operations and market managment
SBP-Market-Operations and market managmentSBP-Market-Operations and market managment
SBP-Market-Operations and market managmentfactical
 
AfRESFullPaper22018EmpiricalPerformanceofRealEstateInvestmentTrustsandShareho...
AfRESFullPaper22018EmpiricalPerformanceofRealEstateInvestmentTrustsandShareho...AfRESFullPaper22018EmpiricalPerformanceofRealEstateInvestmentTrustsandShareho...
AfRESFullPaper22018EmpiricalPerformanceofRealEstateInvestmentTrustsandShareho...yordanosyohannes2
 
Financial Leverage Definition, Advantages, and Disadvantages
Financial Leverage Definition, Advantages, and DisadvantagesFinancial Leverage Definition, Advantages, and Disadvantages
Financial Leverage Definition, Advantages, and Disadvantagesjayjaymabutot13
 
Classical Theory of Macroeconomics by Adam Smith
Classical Theory of Macroeconomics by Adam SmithClassical Theory of Macroeconomics by Adam Smith
Classical Theory of Macroeconomics by Adam SmithAdamYassin2
 
原版1:1复刻堪萨斯大学毕业证KU毕业证留信学历认证
原版1:1复刻堪萨斯大学毕业证KU毕业证留信学历认证原版1:1复刻堪萨斯大学毕业证KU毕业证留信学历认证
原版1:1复刻堪萨斯大学毕业证KU毕业证留信学历认证jdkhjh
 
chapter_2.ppt The labour market definitions and trends
chapter_2.ppt The labour market definitions and trendschapter_2.ppt The labour market definitions and trends
chapter_2.ppt The labour market definitions and trendslemlemtesfaye192
 
Current Economic situation of Pakistan .pptx
Current Economic situation of Pakistan .pptxCurrent Economic situation of Pakistan .pptx
Current Economic situation of Pakistan .pptxuzma244191
 
(中央兰开夏大学毕业证学位证成绩单-案例)
(中央兰开夏大学毕业证学位证成绩单-案例)(中央兰开夏大学毕业证学位证成绩单-案例)
(中央兰开夏大学毕业证学位证成绩单-案例)twfkn8xj
 
How Automation is Driving Efficiency Through the Last Mile of Reporting
How Automation is Driving Efficiency Through the Last Mile of ReportingHow Automation is Driving Efficiency Through the Last Mile of Reporting
How Automation is Driving Efficiency Through the Last Mile of ReportingAggregage
 
BPPG response - Options for Defined Benefit schemes - 19Apr24.pdf
BPPG response - Options for Defined Benefit schemes - 19Apr24.pdfBPPG response - Options for Defined Benefit schemes - 19Apr24.pdf
BPPG response - Options for Defined Benefit schemes - 19Apr24.pdfHenry Tapper
 
Authentic No 1 Amil Baba In Pakistan Authentic No 1 Amil Baba In Karachi No 1...
Authentic No 1 Amil Baba In Pakistan Authentic No 1 Amil Baba In Karachi No 1...Authentic No 1 Amil Baba In Pakistan Authentic No 1 Amil Baba In Karachi No 1...
Authentic No 1 Amil Baba In Pakistan Authentic No 1 Amil Baba In Karachi No 1...First NO1 World Amil baba in Faisalabad
 
fca-bsps-decision-letter-redacted (1).pdf
fca-bsps-decision-letter-redacted (1).pdffca-bsps-decision-letter-redacted (1).pdf
fca-bsps-decision-letter-redacted (1).pdfHenry Tapper
 

Recently uploaded (20)

Call Girls Near Me WhatsApp:+91-9833363713
Call Girls Near Me WhatsApp:+91-9833363713Call Girls Near Me WhatsApp:+91-9833363713
Call Girls Near Me WhatsApp:+91-9833363713
 
Quantitative Analysis of Retail Sector Companies
Quantitative Analysis of Retail Sector CompaniesQuantitative Analysis of Retail Sector Companies
Quantitative Analysis of Retail Sector Companies
 
Lundin Gold April 2024 Corporate Presentation v4.pdf
Lundin Gold April 2024 Corporate Presentation v4.pdfLundin Gold April 2024 Corporate Presentation v4.pdf
Lundin Gold April 2024 Corporate Presentation v4.pdf
 
The Core Functions of the Bangko Sentral ng Pilipinas
The Core Functions of the Bangko Sentral ng PilipinasThe Core Functions of the Bangko Sentral ng Pilipinas
The Core Functions of the Bangko Sentral ng Pilipinas
 
(办理学位证)加拿大萨省大学毕业证成绩单原版一比一
(办理学位证)加拿大萨省大学毕业证成绩单原版一比一(办理学位证)加拿大萨省大学毕业证成绩单原版一比一
(办理学位证)加拿大萨省大学毕业证成绩单原版一比一
 
《加拿大本地办假证-寻找办理Dalhousie毕业证和达尔豪斯大学毕业证书的中介代理》
《加拿大本地办假证-寻找办理Dalhousie毕业证和达尔豪斯大学毕业证书的中介代理》《加拿大本地办假证-寻找办理Dalhousie毕业证和达尔豪斯大学毕业证书的中介代理》
《加拿大本地办假证-寻找办理Dalhousie毕业证和达尔豪斯大学毕业证书的中介代理》
 
Stock Market Brief Deck for "this does not happen often".pdf
Stock Market Brief Deck for "this does not happen often".pdfStock Market Brief Deck for "this does not happen often".pdf
Stock Market Brief Deck for "this does not happen often".pdf
 
Monthly Economic Monitoring of Ukraine No 231, April 2024
Monthly Economic Monitoring of Ukraine No 231, April 2024Monthly Economic Monitoring of Ukraine No 231, April 2024
Monthly Economic Monitoring of Ukraine No 231, April 2024
 
SBP-Market-Operations and market managment
SBP-Market-Operations and market managmentSBP-Market-Operations and market managment
SBP-Market-Operations and market managment
 
AfRESFullPaper22018EmpiricalPerformanceofRealEstateInvestmentTrustsandShareho...
AfRESFullPaper22018EmpiricalPerformanceofRealEstateInvestmentTrustsandShareho...AfRESFullPaper22018EmpiricalPerformanceofRealEstateInvestmentTrustsandShareho...
AfRESFullPaper22018EmpiricalPerformanceofRealEstateInvestmentTrustsandShareho...
 
Financial Leverage Definition, Advantages, and Disadvantages
Financial Leverage Definition, Advantages, and DisadvantagesFinancial Leverage Definition, Advantages, and Disadvantages
Financial Leverage Definition, Advantages, and Disadvantages
 
Classical Theory of Macroeconomics by Adam Smith
Classical Theory of Macroeconomics by Adam SmithClassical Theory of Macroeconomics by Adam Smith
Classical Theory of Macroeconomics by Adam Smith
 
原版1:1复刻堪萨斯大学毕业证KU毕业证留信学历认证
原版1:1复刻堪萨斯大学毕业证KU毕业证留信学历认证原版1:1复刻堪萨斯大学毕业证KU毕业证留信学历认证
原版1:1复刻堪萨斯大学毕业证KU毕业证留信学历认证
 
chapter_2.ppt The labour market definitions and trends
chapter_2.ppt The labour market definitions and trendschapter_2.ppt The labour market definitions and trends
chapter_2.ppt The labour market definitions and trends
 
Current Economic situation of Pakistan .pptx
Current Economic situation of Pakistan .pptxCurrent Economic situation of Pakistan .pptx
Current Economic situation of Pakistan .pptx
 
(中央兰开夏大学毕业证学位证成绩单-案例)
(中央兰开夏大学毕业证学位证成绩单-案例)(中央兰开夏大学毕业证学位证成绩单-案例)
(中央兰开夏大学毕业证学位证成绩单-案例)
 
How Automation is Driving Efficiency Through the Last Mile of Reporting
How Automation is Driving Efficiency Through the Last Mile of ReportingHow Automation is Driving Efficiency Through the Last Mile of Reporting
How Automation is Driving Efficiency Through the Last Mile of Reporting
 
BPPG response - Options for Defined Benefit schemes - 19Apr24.pdf
BPPG response - Options for Defined Benefit schemes - 19Apr24.pdfBPPG response - Options for Defined Benefit schemes - 19Apr24.pdf
BPPG response - Options for Defined Benefit schemes - 19Apr24.pdf
 
Authentic No 1 Amil Baba In Pakistan Authentic No 1 Amil Baba In Karachi No 1...
Authentic No 1 Amil Baba In Pakistan Authentic No 1 Amil Baba In Karachi No 1...Authentic No 1 Amil Baba In Pakistan Authentic No 1 Amil Baba In Karachi No 1...
Authentic No 1 Amil Baba In Pakistan Authentic No 1 Amil Baba In Karachi No 1...
 
fca-bsps-decision-letter-redacted (1).pdf
fca-bsps-decision-letter-redacted (1).pdffca-bsps-decision-letter-redacted (1).pdf
fca-bsps-decision-letter-redacted (1).pdf
 

Putnam Outlook Q3 2013

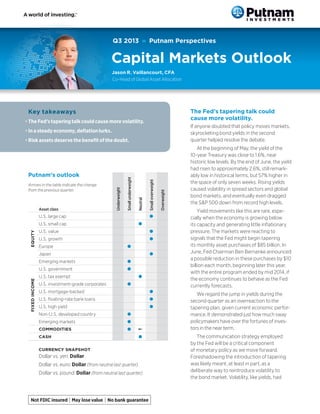
  • 1. Q3 2013 » Putnam Perspectives Capital Markets Outlook Putnam’s outlook Arrows in the table indicate the change from the previous quarter. Underweight Smallunderweight Neutral Smalloverweight Overweight Asset class EQUITY U.S. large cap l U.S. small cap l U.S. value l U.S. growth l Europe l Japan l Emerging markets l FIXEDINCOME U.S. government l U.S. tax exempt l U.S. investment-grade corporates l U.S. mortgage-backed l U.S. floating-rate bank loans l U.S. high yield l Non-U.S. developed country l Emerging markets l COMMODITIES l CASH l CURRENCY SNAPSHOT Dollar vs. yen: Dollar Dollar vs. euro: Dollar (from neutral last quarter) Dollar vs. pound: Dollar (from neutral last quarter) The Fed’s tapering talk could cause more volatility. If anyone doubted that policy moves markets, skyrocketing bond yields in the second quarter helped resolve the debate. At the beginning of May, the yield of the 10-year Treasury was close to 1.6%, near historic low levels. By the end of June, the yield had risen to approximately 2.6%, still remark- ably low in historical terms, but 57% higher in the space of only seven weeks. Rising yields caused volatility in spread sectors and global bond markets, and eventually even dragged the S&P 500 down from record high levels. Yield movements like this are rare, espe- cially when the economy is growing below its capacity and generating little inflationary pressure. The markets were reacting to signals that the Fed might begin tapering its monthly asset purchases of $85 billion. In June, Fed Chairman Ben Bernanke announced a possible reduction in these purchases by $10 billion each month, beginning later this year, with the entire program ended by mid 2014, if the economy continues to behave as the Fed currently forecasts. We regard the jump in yields during the second quarter as an overreaction to the tapering plan, given current economic perfor- mance. It demonstrated just how much sway policymakers have over the fortunes of inves- tors in the near term. The communication strategy employed by the Fed will be a critical component of monetary policy as we move forward. Foreshadowing the introduction of tapering was likely meant, at least in part, as a deliberate way to reintroduce volatility to the bond market. Volatility, like yields, had Key takeaways • The Fed’s tapering talk could cause more volatility. • In a steady economy, deflation lurks. • Risk assets deserve the benefit of the doubt. Jason R. Vaillancourt, CFA Co-Head of Global Asset Allocation
  • 2. 2 Q3 2013 | Capital Markets Outlook recently touched all-time lows in both realized and implied terms. The Fed faces a task all the more daunting because of its massive footprint in the bond market. Currently, the Fed is on pace to own nearly a quarter of the liquid bond market by mid 2014. Despite an improving economy, as we get closer to actual policy changes we anticipate a greater degree of market turbulence than what investors may have grown accustomed to over the past several quarters. We also find the current setting attractive for identifying oppor- tunities, because we have a long-term view and invest actively to take advantage of changing market conditions. In a steady economy, deflation lurks. Based on its internal dynamics, the U.S. economy continues to be one of the most attractive for investors. One of the key pillars of support for the U.S. economy has been the housing market. Dynamics of the housing market include low prices, low mortgage rates, high pent-up demand due to rising household formation, and institu- tional investment into a strong rental market. Of these, only mortgage rates have hit a bump in the road, as the surge in bond yields has pushed rates higher. However, rates still appear low when viewed over a longer time horizon, and we think conditions favor continued strength. The performance of the economy so far in 2013 is all the more impressive because of the drag imposed by fiscal policy contraction. Payroll taxes increased January 1, and the federal budget sequester went into effect in March. The sequester takes its biggest bites from GDP during the third quarter, and so the ultimate impact on factors like business investment, consumer spending, and the job market would likely start to show up in the data very shortly, if they are to show up at all. Fortunately, credit channels to businesses have opened wider as well, and this also encourages optimism. Credit expansion constitutes a major difference between the United States and Europe, where constrained credit continues to inhibit recovery, particularly in peripheral markets. Credit is also emerging as an issue in China, where bank lending rates skyrocketed during the second quarter. The biggest fundamental story for investors and policy makers in 2013 continues to be the steady decline in the unemployment rate. Although the final estimate of first- quarter GDP was revised down by a significant amount, the economy has on average produced monthly payroll gains of over 200,000 per month in 2013. That has trans- lated into a decline in the unemployment rate from 8.2% to 7.6% over the past year. Figure 1. �The Fed’s words lifted yields and bond market volatility Yield of the 10-year Treasury and volatility of the U.S. Treasury MOVE Index, 12/31/12–7/5/13 1.5% 2.0% 2.5% 3.0% 30 60 90 120 1/1312/31/12 4/133/132/13 5/13 6/13 7/5/13 U.S. 10-year Government Bond Yield U.S. Treasury Volatility Index (MOVE Index) We regard the jump in yields during the second quarter as an overreaction. Source: Bloomberg. The MOVE© (Merrill Option Volatility Expectations) Index reflects a market esti- mate of future Treasury bond yield volatility, based on the average implied volatility across a wide range of outstanding options on the 2-, 5-, 10-, and 30-year U.S. Treasury securities.
  • 3. PUTNAM INVESTMENTS | putnam.com 3 One troubling trend behind this impressive decrease in unemployment is that the labor force participation rate has not risen, as it normally would at this point in the cycle. This anomaly is likely due to the fact that the United States, like most developed economies, is beginning to experience the effects of an aging population. This key statistic bears closer attention as we continue to be on the lookout for signs of deflation. Risk assets deserve the benefit of the doubt. Viewing policy issues and market fundamentals together, we favor continuity in investment positioning going into the third quarter. Equities and high-yield credit, we believe, offer more attractive total return potential than other interest-rate risk and inflation-sensitive assets, including TIPS and commodities. We also have a some- what sanguine view of looming U.S. policy risks. Although Congress and the President will likely face off again to raise the debt ceiling, rising tax receipts have reduced the political sensitivity of the deficit. We do not antici- pate theatrics that will derail the economy. Similarly, any tapering by the Fed — either real or implied — is unlikely to raise the risk of recession. On a global scale, we regard U.S. and Japanese equities to be among the most promising assets. The reforms launched by Japan’s prime minister Shinzo Abe have sparked both controversy and volatility in equity, currency, and debt markets. However, we believe Abe appears poised to consolidate his grip on policy in July’s elections to the Diet’s upper house, which should allow him to follow through on the “third arrow” of his agenda, adding structural reforms to the monetary and fiscal policy changes already instituted. Given that structural change would bring the deepest and most sustainable benefits, we favor a tilt toward Japanese equities as these poli- cies make their way into legislation over the next several months. Importantly, expectations are low for true and sweeping reforms, so any progress on this front would likely generate a positive surprise. We have less optimism for Europe and emerging markets. While the threats of a European deleveraging event or a hard landing in China remain severely dimin- ished, we have some concerns about credit conditions in European peripheral markets and in China’s banking sector. Meanwhile, China’s economic deceleration is quite clear, and has implications for a range of other emerging markets linked to China by trade. One consequence has been a drop in commodity prices this year, which has contributed to the underperformance of emerging markets. Overall, the world is still starved for yield-generating investments as the major central banks keep policy rates extremely accommodative. Their efforts are at least partially in response to the fact that deflation remains a threat to the global economy. So long as policy measures can prevent deflation, portfolios should favor equity and other risk assets over more interest-rate-sensitive bonds. Figure 2. �Buying a home is easier today than it has been in more than a generation National Association of Realtors Home Affordability Composite Index, 1/31/89–4/30/13 100 125 150 175 200 225 19921/31/89 200420001996 2008 2012 4/30/13 Dynamics of the housing market include low prices, low mortgage rates, high pent-up demand, and insti- tutional investment. Sources: Bloomberg, National Association of Realtors. An index above 100 signifies that a family earning the median income has more than enough income to qualify for a loan on a median-priced home.
  • 4. 4 Q3 2013 | Capital Markets Outlook Asset class views Equity U.S. equity In late May, shortly after closing at an all-time high, the S&P 500 Index pulled back sharply following a Fed policy meeting that signaled a possible cutback in the Fed’s bond-buying program. In the weeks that followed, stocks declined more than 6% before recovering in the final days of the quarter. A notable shift from the previous quarter was a pull- back in the performance of defensive stocks. As investors became more confident about an improving U.S. economy, they appeared willing to take on more risk, and cyclical stocks rebounded. We regarded this development posi- tively. As equity markets focus more on fundamentals and valuations, the opportunity to achieve returns at the indi- vidual stock level appears greater than it has for some time. Despite relatively sluggish revenue growth for U.S. busi- nesses, our outlook is constructive for corporate earnings. In our view, the bulk of profitability is the result of struc- tural improvement and is likely to be sustainable over time. In addition, relatively low levels of durable-goods spending and factory utilization suggest that profit margins have yet to peak and can move higher from current levels. While it is important to consider the potential impact of rising interest rates on U.S. equities, we don’t view this as a significant risk. At the close of the quarter, long-term rates still remained near all-time lows, and rising short-term rates can be beneficial for equity performance, in part because they typically signal an improving economy. Despite a slightly less bullish stance overall, our view remains constructive for U.S. equities, and for the universe of cyclical stocks in particular, which has yet to fully rebound and continues to offer many exploitable opportunities. Non-U.S. equity Rising interest rates, declines among dividend-paying stocks, and an outflow of capital from emerging markets all accelerated after the Fed’s announcement in mid June, and sapped global equity market strength. Despite these macro fears, we see exciting funda- mental developments among non-U.S. equities in terms of product cycles, business model improvement, and break- through technologies. Innovation is happening across a variety of sectors, and may hold important implications for companies’ top-line growth. This cuts across tradition- ally innovation-driven areas, such as biotech, and newer zones of innovation like “big data.” But it extends as well to more stable industries, such as food and beverage, where Figure 3. �People staying out of the job hunt might be a sign of an aging workforce U.S. Labor Force Participation Rate, 12/31/89–6/30/13 62% 64% 66% 68% 199212/31/89 200420001996 2008 2012 6/30/13 The labor force participation rate has not risen as it normally would at this point of the cycle. Source: Bureau of Labor Statistics. This rate represents the percentage of the civilian population participating in the labor market, either employed or seeking jobs.
  • 5. PUTNAM INVESTMENTS | putnam.com 5 MARKET TRENDS Index name (returns in USD) Q2 13 12 months ended 6/30/13 EQUITY INDEXES Dow Jones Industrial Average 2.92% 18.87% S&P 500 2.91 20.60 MSCI World (ND) 0.64 18.58 MSCI EAFE (ND) -0.99 18.62 MSCI Europe (ND) -0.51 18.86 MSCI Emerging Markets (ND) -7.88 2.87 Tokyo Topix -0.05 16.64 Russell 1000 2.65 21.24 Russell 2000 3.08 24.21 Russell 3000 Growth 2.19 17.56 Russell 3000 Value 3.14 25.28 FIXED INCOME INDEXES Barclays U.S. Aggregate Bond -2.33 -0.69 Barclays 10-Year Bellwether -4.57 -4.20 Barclays Government Bond -1.88 -1.51 Barclays MBS -1.96 -1.10 Barclays Municipal Bond -2.97 0.24 BofA ML 3-Month T-bill 0.02 0.11 CG World Government Bond ex-U.S. -3.44 -5.72 JPMorgan Developed High Yield -1.26 9.74 JPMorgan Global High Yield -1.76 9.47 JPMorgan Emerging Markets Global Diversified -5.64 1.11 S&P LSTA Loan 0.19 7.32 COMMODITIES S&P GSCI -5.93 2.04 It is not possible to invest directly in an index. Past performance is not indicative of future results. new products are having an enormous impact on compa- nies’ future growth potential, and where new consumer packaging ideas can revitalize mundane and well-worn consumer products by changing how they are delivered to customers. Two zones of risk to watch are Japan and China, which will rely on the sustainability of the weak yen and avoiding an excessively damaging slowdown. We are also attentive to risks in Europe, which we expect may experience flat growth but could generate a positive economic surprise. In short, despite potential bumps in the road to Europe’s recovery, we believe there is an opportunity in the making among European stocks. Fixed income U.S. fixed income The Fed’s comments about reducing its asset purchase program generated significant interest-rate volatility in the United States, changing the opportunity set for fixed-income investors. Spread sectors — meaning sectors that trade at a yield premium to U.S. Treasuries — which had been buoyed by the massive liquidity created by the Fed’s purchases, sold off, with emerging-market bonds getting hit particularly hard. Global government bonds also fell, although not to the same degree as sectors with greater risk. Despite the rapid increase in yields, we believe the broader U.S. economic recovery remains on track and should continue at a moderate pace, as recent data have been a bit better than expected. We also believe that the U.S. housing recovery will continue apace, although mortgage rates moved higher during May and June. In our view, home sales are improving because of stronger economic activity and better consumer confidence, not because of mortgage rates. In mortgage credit, following the liquidity-driven sell-off, we have found opportunities attractive enough in non-agency residential mortgage- backed securities to begin rebuilding positions during June, seeking to benefit from their improved relative value supported by solid fundamentals. As investors adjust their expectations about when the Fed will actually begin tapering its asset purchases, we expect continued volatility in interest rates and yield spreads. However, we think it’s unlikely that they are going to suddenly spike dramatically higher. As a result, we believe the environment for corporate credit and other risk-based fixed-income categories may continue to be favorable. In term structure, we think the better opportunities exist among short- to intermediate-maturity securities, as opposed to long-term bonds. Within investment-grade corporate credit, we like bonds issued by banks and other financial institutions, as well as utilities. High-yield spreads, after backing up during the second quarter, offer more attractive value, we believe.
  • 6. 6 Q3 2013 | Capital Markets Outlook Non-U.S. fixed income The global macroeconomic environment, though less solid than the United States, appears to be stable, with the exception of China, where weaker growth and high consumer debt levels have created challenges for a government that is trying to stim- ulate domestic demand. We continue to see challenges more broadly for developing economies, hampered by both the strength of the U.S. dollar and the anticipation for less stimulus from the Fed. In Europe, peripheral eurozone economies have performed better than we anticipated, thanks to sharply lower interest rates in those countries. Core European economies were somewhat weaker than we expected, but data near the end of the quarter from Germany, the Netherlands, and Switzerland were encouraging. While we think the degree of increase in global rates during the quarter was more than the current economic environment warrants, leaving less impetus for near-term increases, we continue to believe global rates are likely to move higher over the medium- to longer-term horizon. Tax exempt Although the municipal market experi- enced a notable sell-off along with most fixed-income asset classes from May into June, we continue to have a constructive outlook and believe munis still offer a good option for investors seeking tax-exempt income. Although significant outflows have compounded the sell-off in municipal bonds, typically in July and August reinvestment demand becomes more favorable; and total supply is down 11.5% year-over-year through the end of June. This could bolster the supply/demand picture. Aside from isolated credits such as Detroit and Puerto Rico, fundamentals within the municipal market are generally improving. It is likely that factors such as interest rates and the direction of the economy could continue to influence market activity. A degree of uncertainty over tax policy has been clarified, as income tax rates for 2013 are now certain. However, other policy issues that can affect the value of municipal bonds remain unresolved, including federal budget sequestration, the debt ceiling, and the potential for broader tax reform. We are monitoring developments in these areas. As has been our strategy for some time, we continued to favor essential service revenue bonds over local general obligation bonds. From a credit-quality perspec- tive, overall default rates remain low. In our analysis, the A-rated and BBB-rated segments of the market continue to offer attractive relative value opportunities. We generally favor higher-yielding sectors and issues with below-average sensitivity to interest rates. Commodities Our commodity outlook has turned pessimistic. The asset class generally behaves with more momentum than reversion, and we are coming off a very weak second quarter. Beyond the negative momentum, the weakness in emerging markets represents a very problematic signal for commodities. While the outlook might be negative, there are two major sources of upside risk. Geopolitical concerns are at a high point in the Middle East, with political tensions in Egypt and continued strife in Syria. Egypt represents a risk above and beyond the general area instability, as any disruption to the Suez Canal has the potential to cause a supply shock for energy markets. The other source of upside risk for commodities is the continued correlation with equity markets. While they have fallen from recent highs, the strong correlations suggest that commodities will outperform as an asset class in the event of a risk rally. To reconcile the two countering views, we advocate a more modest underweight to the asset class. Currency We favor long positions in the U.S. dollar. Over the medium term, the U.S. dollar should be supported by a relatively better growth outlook, a gradual reduction in the pace of accommodation by the Federal Open Market Committee, and the effect of forward guidance about the first rate hike in 2015. For the euro, as well, we favor a slight long position, but not against the U.S. dollar. The single currency remains supported by healthy trade flows — the eurozone is set to run a current account surplus exceeding 2% of GDP this year. We are moderately pessimistic on the British pound sterling given prospects for a continued easing policy. In the Japanese yen, we expect renewed weakness. Over the medium term, the Bank of Japan is expected to increase easing, and this should provide further impetus for the U.S. dollar to rally versus the yen. Emerging-market currencies remain over-owned in a world where the U.S. term structure is likely to grind higher, we believe. Amid lower levels of global growth and lower commodity prices and inflation, emerging-market central banks have shifted into easing mode. With weaker current account surpluses in emerging markets, large capital outflows are a major risk for emerging-market currencies.
  • 7. PUTNAM INVESTMENTS | putnam.com 7 TheBarclaysGovernmentBondIndexisanunmanagedindexofU.S.Treasuryand governmentagencybonds. TheBarclaysMunicipalBondIndexisanunmanagedindexoflong-termfixed-rate investment-gradetax-exemptbonds. TheBarclays10-YearU.S.TreasuryBellwetherIndexisanunmanagedindexofU.S. Treasurybondswith10years’maturity. TheBarclaysU.S.AggregateBondIndexisanunmanagedindexusedasageneral measureofU.S.fixed-incomesecurities. TheBarclaysU.S.Mortgage-BackedSecurities(MBS)Indexcoversagency mortgage-backedpass-throughsecurities(bothfixed-rateandhybridARM)issuedby GinnieMae(GNMA),FannieMae(FNMA),andFreddieMac(FHLMC). TheBofAMerrillLynchU.S.3-MonthTreasuryBillIndexconsistsofU.S.Treasurybills maturingin90days. TheCitigroupNon-U.S.WorldGovernmentBondIndexisanunmanagedindex generallyconsideredtoberepresentativeoftheworldbondmarketexcludingthe UnitedStates. TheDowJonesIndustrialAverageIndex(DJIA)isanunmanagedindexcomposed of30blue-chipstockswhoseonebindingsimilarityistheirhugeness—eachhassales peryearthatexceed$7bilÂ�Â�lion.TheDJIAhasbeenprice-weightedsinceitsinception onMay26,1896,reflectslarge-capcompaniesrepresentativeofU.S.industry,and historicallyhasmovedintandemwithothermajormarketindexessuchastheS&P500. TheJPMorganDevelopedHighYieldIndexisanunmanagedindexofhigh-yield fixed-incomesecuritiesissuedindevelopedcountries. TheJPMorganEmergingMarketsGlobalDiversifiedIndexiscomposedofU.S. dollar-denominatedBradybonds,eurobonds,tradedloans,andlocalmarketdebt instrumentsissuedbysovereignandquasi-sovereignentities. JPMorganGlobalHighYieldIndexisanunmanagedindexofglobalhigh-yield fixed-incomesecurities. TheMSCIEAFEIndexisanunmanagedlistofequitysecuritiesfromEuropeand Australasia,withallvaluesexpressedinU.S.dollars. TheMSCIEmergingMarketsIndexisafree-float-adjustedmarket-capitalization- weightedindexthatisdesignedtomeasureequitymarketperformanceintheglobal emergingmarkets. TheMSCIEuropeIndexisanunmanagedlistofequitysecuritiesoriginatinginanyof15 Europeancountries,withallvaluesexpressedinU.S.dollars. TheMSCIWorldIndexisanunmanagedlistofsecuritiesfromdevelopedandemerging markets,withallvaluesexpressedinU.S.dollars. TheRussell1000Indexisanunmanagedindexofthe1,000largestU.S.companies. TheRussell2000Indexisanunmanagedlistofcommonstocksthatisfrequentlyused asageneralperformancemeasureofU.S.stocksofsmalland/ormidsizecompanies. Russell3000GrowthIndexisanunmanagedindexofthosecompaniesinthebroad- marketRussell3000Indexchosenfortheirgrowthorientation. Russell3000ValueIndexisanunmanagedindexofthosecompaniesinthebroad- marketRussell3000Indexchosenfortheirvalueorientation. TheS&PGSCIisacompositeindexofcommoditysectorreturnsthatrepresentsa broadlydiversified,unleveraged,long-onlypositionincommodityfutures. TheS&P/LSTALeveragedLoanIndex(LLI)isanunmanagedindexofU.S.leveraged loans. TheS&P500Indexisanunmanagedlistofcommonstocksthatisfrequentlyusedasa generalmeasureofU.S.stockmarketperformance. TheTokyoStockExchangeIndex(TOPIX)isamarket-capitalization-weightedindexof over1,100stockstradedintheJapanesemarket.
  • 8. NOTES This material is provided for limited purposes. It is not intended as an offer or solicitation for the purchase or sale of any financial instrument, or any Putnam product or strategy. References to specific securities, asset classes, and financial markets are for illustrative purposes only and are not intended to be, and should not be interpreted as, recommendations or investment advice. The opinions expressed in this article represent the current, good-faith views of Putnam senior portfolio managers at the time of publication. The views are provided for informational purposes only and are subject to change. This material does not take into account any investor’s particular investment objectives, strategies, tax status, or investment horizon. The views and strategies described herein may not be suitable for all investors. Investors should consult a financial advisor for advice suited to their individual financial needs. Putnam Investments cannot guarantee the accuracy or completeness of any statements or data contained in the article. Predictions, opinions, and other information contained in this article are subject to change. Any forward-looking statements speak only as of the date they are made, and Putnam assumes no duty to update them. Forward-looking statements are subject to numerous assumptions, risks, and uncertainties. Actual results could differ materially from those anticipated. Past performance is not a guarantee of future results. As with any investment, there is a potential for profit as well as the possibility of loss. This presentation or any portion hereof may not be reprinted, sold, or redistributed in whole or in part without the express written consent of Putnam Investments. The information provided relates to Putnam Investments and its affiliates, which include The Putnam Advisory Company, LLC and Putnam Investments Limited®. Prepared for use in Canada by Putnam Investments Inc. [Investissements Putnam Inc.] (o/a Putnam Management in Manitoba). Where permitted, advisory services are provided in Canada by Putnam Investments Inc. [Investissements Putnam Inc.] (o/a Putnam Management in Manitoba) and its affiliate, The Putnam Advisory Company, LLC. Diversification does not assure a profit or protect against loss. It is possible to lose money in a diversified portfolio. In the United States, mutual funds are distributed by Putnam Retail Management. putnam.com� CM0100 282203 7/13 Consider these risks before investing: International investing involves certain risks, such as currency fluctuations, economic instability, and political developments. Investments in small and/or midsize companies increase the risk of greater price fluctuations. Bond investments are subject to interest-rate risk, which means the prices of the fund’s bond investments are likely to fall if interest rates rise. Bond investments also are subject to credit risk, which is the risk that the issuer of the bond may default on payment of interest or principal. Interest-rate risk is generally greater for longer-term bonds, and credit risk is generally greater for below-investment-grade bonds, which may be considered speculative. Unlike bonds, funds that invest in bonds have ongoing fees and expenses. Lower-rated bonds may offer higher yields in return for more risk. Funds that invest in government securities are not guaranteed. Mortgage-backed securities are subject to prepayment risk. Commodities involve the risks of changes in market, political, regulatory, and natural conditions. Scan code or visit putnam.com/outlook for more insight on the global investment landscape. Visit putnam.com for news and information, and our Perspectives blog for in-depth analysis on a range of investment topics. If you are a U.S. retail investor, please request a prospectus, or a summary prospectus if available, from your financial representative or by calling Putnam at 1-800-225-1581. The prospectus includes investment objectives, risks, fees, expenses, and other information that you should read and consider carefully before investing.