SlideShare a Scribd company logo
1 of 17
The Business
      Growth Model

A Comprehensive Business Plan
   Designed to Attain Financial
Independence Through Business
          Ownership
A. Model Goals and Objectives
                        Achieved

1.    Financial Independence

2.    Retirement and Estate Resources

3.    Education

4.    Business Growth

5.    Business Succession – Leaving More Behind Than
      What You Arrived With.
A. The Business Growth Model
                               Defined
    20% profit before taxes

    5 years to satisfy loan obligation

    500K in Revenues

    Easy to run – can insert people to operate business.

    Equity in first unit funds purchase of 2nd unit

    Equity in second unit funds purchase of 3rd unit.
A. Financial Statement Analytics
1.   Profitability

3.   Solvency

5.   Sustainability

7.   Return on Investment

9.   PALLR Sequence of Ratio analysis
A.     Ratio Analysis
 Measure             Ratio                      Measure                     Standard
                                       (Sales - Operating expenses)
                 Operating Margin                                              40%
                                                      Sales
 Profitability                          (Operating margin - Discretionary
                   Net Margin                         expenses)                20%
                                                      Sales

                   Receivables                      Revenues
                                                                             4-5 times
                      Turnover              Avg. accounts receivable
   Activity                                           Sales
                  Asset Turnover                                             5-7 times
                                             Average Capital Assets
                                                    Total Debt

  Leverage          Debt Ratio
                                                   Total Assets
                                                                               30%


                                                  Current Assets

  Liquidity       Current Ratio
                                                Current Liabilities
                                                                               2:1


                                                   Net Income
                 Return on Equity                                              20%
                                               Shareholders' Equity
Rate of Return                                     Net Income
                 Return on Assets                                              20%
                                              Average Total Assets
A Ltd.
               Income Statement
            For the year ended xxxx

Fees                                       568,887


Advertising                                  3,075
Bank charges and interest                      515
Janitorial                                   5,496
Credit card discounts                        1,820
Supplies                                    47,340
Insurance                                    3,226
Laboratory fees                             24,615
Legal and Accounting                         6,481
Licences, taxes and dues                     5,805
Utilities                                    2,151
Parking                                        181
Postage, stationary, and office              7,478
Repairs and maintenance                      2,847
Telephone                                    1,032
Wages and employee benefits                107,914
Amortization                                 6,348

Total expenses                             226,324

Operating income                           342,563

Management salaries                         58,500
Income tax                                  37,201

Total management salaries and income tax    95,701

Net income for the year                    246,862
B Ltd.
                          Income Statement
                       For the year ended xxxx

                                                 2011      2010

Sales                                          247,639   344,169

Cost of Sales
 Employee benefits                               3,518     4,968
 Purchases and supplies                         89,581   127,981
 Subcontracts                                   17,764    33,938

 Total Cost of Sales                           110,863   166,887

 Gross Profit                                  136,776   177,282

Expenses
Advertising                                      6,930     4,899
Automobile                                       9,281     8,721
Bad Debts                                  -       750       750
Bank charges and interest                          335       893
Consulting                                       3,386         -
Accounting                                       1,600     2,095
Legal                                            1,426         -
Licences, taxes and dues                           166       116
Postage, stationary and office                   1,230     3,475
Rent                                             5,134     4,284
Telephone                                        4,966     4,596
Travel                                           3,242     2,559
Amortization                                     1,659     2,340

Total expenses                                  38,605    34,728

Operating income                                98,171   142,554

Management salaries                            115,000   115,000
Income tax                                           -     4,342

Total Management salaries and income tax       115,000   119,342

Net (loss) income for the year             - 16,829       23,212
The Business Growth Model
                                           Progression Yr 1-5 - Business A


Assumptions:                                                    Parameters
-10% growth per year                                            Business #1 purchase price = $500,000
-20% down payment on purchase price                             -Money down (20%) =$100,000-funding source =Owner's equity
-Pay off loan in 5 years                                        -Amount financed = $400,000
- Business purchase price = $1 per $1 of sales

Business Loan                                                   Requirements
Principal = $400,000                                            -5% growth (yrs 1-15)
Interest rate = 5%                                              -Keep all expenses within the percentage parameters
Reduction period - 5 years                                      -Solid brand

Question marks
-Interest rates
                                                         Yr 1            Yr 2            Yr 3           Yr 4              Yr 5


Revenues                                         $ 500,000       $ 525,000      $ 551,250       $ 578,813      $      607,753
  Cost of sales (36%)                                180,000         189,000        198,450         208,373           218,791


Gross profit                                         320,000         336,000        352,800         370,440           388,962


  M & A expenses (36% - 38.5%)                       192,500         202,125        212,231         222,843           233,985


  Management salaries                                 40,000          40,000         40,000          40,000            40,000


Operating income                                      87,500          93,875        100,569         107,597           114,977


Income tax (13.5%)                                    11,813          12,673         13,577          14,526            15,522


Net income after taxes                           $    75,688     $    81,202    $    86,992     $    93,072    $       99,455
The Business Growth Model
                                        Progression Yr 1-5 - Business A


Beginning cash                               $        -      -$    11,593 -$    17,671 -$    17,960 -$    12,168
 Add: Yearly cash inflow                           75,688          81,202       86,992       93,072       99,455
                                                   75,688          69,609       69,321       75,112       87,287

Loan principal reduction                           70,323          76,401       81,383       84,976       86,917

Interest on loan (fixed)                           16,957          10,879        5,898        2,304         362

Operational ending cash                     -      11,593 -        17,671 -     17,960 -     12,168            8

Capital replacements /
improvements ***                                   20,000          20,000       20,000       20,000       20,000

Ending cash                                       -$31,593        -$37,671     -$37,960     -$32,168     -$19,992

           *** Updates to interior, capital
               improvements and/or replacements
The Business Growth Model
                                   Progression Yr 6-10 - Business A + B

Loan #1                                                     Loan #2
$100,000 equity draw out on business A - 5%                 $400,000 for business B - 5%
(5 year fixed)                                              (5 year fixed)

Purchase price of business B
     $500,000


                                                     Yr 6            Yr 7           Yr 8          Yr 9        Yr 10


BUSINESS B
Revenues                                      $   500,000 $       525,000 $     551,250 $      578,813 $     607,753

 Cost of sales (36%)                              180,000         189,000       198,450        208,373       218,791

 M & A expenses (36% - 38.5%)                     192,500         202,125       212,231        222,843       233,985

 Management salaries                               40,000          40,000         40,000        40,000        40,000


Operating income                                   87,500          93,875       100,569        107,597       114,977

Income tax (13.5%)                                 11,813          12,673         13,577        14,526        15,522


Net income after taxes                        $   75,688    $    81,202     $   86,992     $   93,072    $   99,455


BUSINESS A
Revenues                                      $   638,141 $       670,048 $     703,550 $      738,728 $     775,664


 Cost of sales (36%)                              229,731         241,217       253,278        265,942       279,239

 M & A expenses (36% - 38.5%)                     245,684         257,968       270,867        284,410       298,631

 Management salaries                               40,000          40,000         40,000        40,000        40,000

Operating income                                  122,726         130,862       139,405        148,376       157,794

Income tax (13.5%)                                 16,568          17,666         18,820        20,031        21,302


Net income after taxes                        $ 106,158     $ 113,196       $ 120,586      $ 128,345     $ 136,492
The Business Growth Model
                                       Progression Yr 6-10 - Business A + B


CUMULATIVE
Revenues                                      $   1,138,141 $   1,195,048 $   1,254,800 $   1,317,540 $   1,383,417


  Cost of sales (36%)                               409,731       430,217       451,728       474,314       498,030
  M & A expenses (36% - 38.5%)                      438,184       460,093       483,098       507,253       532,616
  Management salaries                                80,000        80,000        80,000        80,000        80,000


Operating income                                   210,226       224,737       239,974       255,973       272,771
Income tax                                          28,380        30,340        32,396        34,556        36,824

Net income after taxes                        $ 181,845       $ 194,398     $ 207,578     $ 221,416     $ 235,947

Beginning Cash                                     -$19,992       $53,813      $140,171      $239,708      $353,084

  Add: Yearly cash inflow                           181,845       194,398       207,578       221,416       235,947
                                                    161,853       248,211       347,749       461,124       589,031


Loan principal reduction - loan #1                  16,499        17,983        19,213        20,121        26,184
Loan principal reduction - loan #2                  70,323        76,401        81,383        84,976        86,917

Interest on loan #1                                  4,261         2,777         1,547           639           119
Interest on loan #2                                 16,957        10,879         5,898         2,304           362

Ending operational cash                             53,813       140,171       239,708       353,084       475,449

Capital improvements - business A                    20000         20000         20000         20000          20000
Capital improvements - business B                    20000         20000         20000         20000          20000

Asst. manager hire in year 6 - business A            50,000        50,000        50,000        50,000        50,000

Ending cash                                        -$36,187       $50,171      $149,708      $263,084      $385,449
The Business Growth Model
                                         Progression Yr 11-15 - Business A + B + C

Loan #1                                                                 Loan #2
$100,000 equity draw out on business A - 5%                             $400,000 for business C - 5%
(5 year fixed)                                                          (5 year fixed)

Purchase price of business C
           $500,000
                                                                 Yr 6            Yr 7           Yr 8          Yr 9        Yr 10

BUSINESS C
Revenues                                                 $    500,000 $       525,000 $     551,250 $      578,813 $     607,753

 Cost of sales (36%)                                          180,000         189,000       198,450        208,373       218,791
 M & A expenses (36% - 38.5%)                                 192,500         202,125       212,231        222,843       233,985
 Management salaries                                           40,000          40,000        40,000         40,000        40,000
Operating income                                               87,500          93,875       100,569        107,597       114,977
Income tax (13.5%)                                             11,813          12,673        13,577         14,526        15,522


Net income after taxes                                   $   75,688     $    81,202     $   86,992     $   93,072    $   99,455

BUSINESS B
Revenues                                                 $    638,141 $       670,048 $     703,550 $      738,728 $     775,664

 Cost of sales (36%)                                          229,731         241,217       253,278        265,942       279,239
 M & A expenses (36% - 38.5%)                                 245,684         257,968       270,867        284,410       298,631
 Management salaries                                           40,000          40,000        40,000         40,000        40,000

Operating income                                              122,726         130,862       139,405        148,376       157,794
Income tax (13.5%)                                             16,568          17,666        18,820         20,031        21,302


Net income after taxes                                   $ 106,158      $ 113,196       $ 120,586      $ 128,345     $ 136,492

BUSINESS A
Revenues                                                 $    814,447 $       855,170 $     897,928 $      942,824 $     989,966

 Cost of sales (36%)                                          293,201         307,861       323,254        339,417       356,388
 M & A expenses (36% - 38.5%)                                 313,562         329,240       345,702        362,987       381,137
 Management salaries                                           40,000          40,000        40,000         40,000        40,000
Operating income                                              167,684         178,068       188,972        200,420       212,441
Income tax (13.5%)                                             22,637          24,039        25,511         27,057        28,680


Net income after taxes                                   $ 145,047      $ 154,029       $ 163,460      $ 173,364     $ 183,762
The Business Growth Model
                                        Progression Yr 11-15 - Business A + B + C


CUMULATIVE
Revenues                                                $   1,952,588 $   2,050,217 $   2,152,728 $   2,260,365 $    2,373,383


  Cost of sales (36%)                                         702,932       738,078       774,982       813,731        854,418
  M & A expenses (36% - 38.5%)                                751,746       789,334       828,800       870,240        913,752
  Management salaries                                         120,000       120,000       120,000       120,000        120,000

Operating income                                             377,910       402,805       428,946        456,393        485,213
Income tax                                                    51,018        54,379        57,908         61,613         65,504

Net income after taxes                                  $ 326,892       $ 348,427     $ 371,038     $ 394,780      $ 419,709


Beginning Cash                                               $385,449      $604,301      $844,688     $1,107,685     $1,394,425

  Add: Yearly cash inflow                                     326,892       348,427       371,038        394,780        419,709
                                                              712,341       952,728     1,215,726      1,502,465      1,814,134

Loan principal reduction - loan #1                            16,499        17,983        19,213         20,121         26,184
Loan principal reduction - loan #2                            70,323        76,401        81,383         84,976         86,917

Interest on loan #1                                            4,261         2,777         1,547            639            119
Interest on loan #2                                           16,957        10,879         5,898          2,304            362

Ending operational cash                                      604,301       844,688      1,107,685     1,394,425      1,700,552

Capital improvements - business A                              20,000        20,000        20,000        20,000         20,000
Capital improvements - business B                              20,000        20,000        20,000        20,000         20,000
Capital improvements - business C                              20,000        20,000        20,000        20,000         20,000

Asst. manager - business A                                     50,000        50,000        50,000        50,000         50,000
Asst. manager in year 10 - business B                          50,000        50,000        50,000        50,000         50,000
Asst. manager in year 10 - business C                          50,000        50,000        50,000        50,000         50,000

Ending cash                                                  $394,301      $634,688      $897,685     $1,184,425     $1,490,552
A. Growth Model Analytics
              What Do We Have At year 15?
2.    $1.49 Million in the bank.
3.    Annual salary of $120,000.
4.    Asst. mgmt secured at each location.
5.    Assuming market value = revenues, $2,373 Million in asset value
      to facilitate retirement objectives.
6.    All net income within the $500K Small Business Deduction Limit.

8.    Ownership concentrating on:
     Management
     Marketing
     Strategy

13.   Financial resources to extend business network.
Business Growth Model

 2,500,000


 2,000,000


 1,500,000


$ 1,000,000


   500,000


         0
              Yr 1   Yr 2   Yr 3   Yr 4    Yr 5   Yr 6   Yr 7    Yr 8   Yr 9      Yr 10    Yr 11 Yr 12 Yr 13   Yr 14 Yr 15
  -500,000
                                                                Year

                                          Revenues       Net income after taxes           Ending cash
A. Growth Model Analytics
•   Optimal business parameters for the model.
       -20% net income before taxes
       -500K revenue levels
       -Recession-proof industry
       -Location
       -Demographic of customers (margin vs. volume)

•   Operational requirements.
      -Staffing levels
      -Ability to replicate management efficiencies

•   Personal longevity, sustainability, and success.
       -Strategy
       -Intent of Business
       -Job replacement
A. Final Thoughts
Future seminars in the NAVIGATOR series to
assist in finding and operating the right
businesses:
•BUSINESS AUDIT PROOF – securing your business against theft and
maximizing the effectiveness and efficient operation of your business

BUSINESS VALUATION – Determining The Proper Price To Pay For
Value.

FINANCIAL STATEMENT ANALYSIS – The Key To Finding Your
Profitable Businesses.

CORPORATE TAX PLANNING – How To Legally Keep As Much Money
as You Own.

PERSONAL AND ESTATE TAX PLANNING – Making All The Work
Pay Off; How To Fully Enjoy The Fruits of Your Labour

More Related Content

Similar to Business growth model 2 for import to keynote

Q1 2009 Earning Report of Hittite Microwave Corp.
Q1 2009 Earning Report of Hittite Microwave Corp.Q1 2009 Earning Report of Hittite Microwave Corp.
Q1 2009 Earning Report of Hittite Microwave Corp.earningreport earningreport
 
Managing financial principles
Managing financial principlesManaging financial principles
Managing financial principlesvaruna177
 
Balda Annual Report 2010
Balda Annual Report 2010Balda Annual Report 2010
Balda Annual Report 2010Balda AG
 
Annual report Britania 2012
Annual report Britania 2012Annual report Britania 2012
Annual report Britania 2012tushararora94
 
credit-suisse Slides - Presentation to analysts and media
credit-suisse Slides - Presentation to analysts and mediacredit-suisse Slides - Presentation to analysts and media
credit-suisse Slides - Presentation to analysts and mediaQuarterlyEarningsReports2
 
Financial planning and_forecasting
Financial planning and_forecastingFinancial planning and_forecasting
Financial planning and_forecastinglove_a123
 
WAL mart store2002 Financials
WAL mart store2002 FinancialsWAL mart store2002 Financials
WAL mart store2002 Financialsfinance1
 
InKnowVision June 2012 HNW Technical Webinar 2 - Valuation Planning
InKnowVision June 2012 HNW Technical Webinar 2 - Valuation PlanningInKnowVision June 2012 HNW Technical Webinar 2 - Valuation Planning
InKnowVision June 2012 HNW Technical Webinar 2 - Valuation PlanningInKnowVision
 
ameriprise Earnings_Release_102405
ameriprise Earnings_Release_102405ameriprise Earnings_Release_102405
ameriprise Earnings_Release_102405finance43
 
ameriprise 1Q07_Release
ameriprise 1Q07_Releaseameriprise 1Q07_Release
ameriprise 1Q07_Releasefinance43
 
2 cash flow and financial statement analysis
2   cash flow and financial statement analysis2   cash flow and financial statement analysis
2 cash flow and financial statement analysisMalinga Perera
 
Paychex Fiscal 2010 Annual Report
Paychex Fiscal 2010 Annual ReportPaychex Fiscal 2010 Annual Report
Paychex Fiscal 2010 Annual Reportkmdefilipps
 
Capital Product Partners Fourth Quarter 2008 Earnings
Capital Product Partners Fourth Quarter 2008 EarningsCapital Product Partners Fourth Quarter 2008 Earnings
Capital Product Partners Fourth Quarter 2008 Earningsearningsreport
 
Interim report 1 2010, Media and analyst presentation, Nordea Bank
Interim report 1 2010, Media and analyst presentation, Nordea BankInterim report 1 2010, Media and analyst presentation, Nordea Bank
Interim report 1 2010, Media and analyst presentation, Nordea BankNordea Bank
 

Similar to Business growth model 2 for import to keynote (20)

Q1 2009 Earning Report of Hittite Microwave Corp.
Q1 2009 Earning Report of Hittite Microwave Corp.Q1 2009 Earning Report of Hittite Microwave Corp.
Q1 2009 Earning Report of Hittite Microwave Corp.
 
Managing financial principles
Managing financial principlesManaging financial principles
Managing financial principles
 
Balda Annual Report 2010
Balda Annual Report 2010Balda Annual Report 2010
Balda Annual Report 2010
 
Business growth model
Business growth model  Business growth model
Business growth model
 
Annual report Britania 2012
Annual report Britania 2012Annual report Britania 2012
Annual report Britania 2012
 
Third Quarter 2005 Earnings Presentation
	Third Quarter 2005 Earnings Presentation	Third Quarter 2005 Earnings Presentation
Third Quarter 2005 Earnings Presentation
 
credit-suisse Slides - Presentation to analysts and media
credit-suisse Slides - Presentation to analysts and mediacredit-suisse Slides - Presentation to analysts and media
credit-suisse Slides - Presentation to analysts and media
 
Financial planning and_forecasting
Financial planning and_forecastingFinancial planning and_forecasting
Financial planning and_forecasting
 
WAL mart store2002 Financials
WAL mart store2002 FinancialsWAL mart store2002 Financials
WAL mart store2002 Financials
 
Econ
EconEcon
Econ
 
InKnowVision June 2012 HNW Technical Webinar 2 - Valuation Planning
InKnowVision June 2012 HNW Technical Webinar 2 - Valuation PlanningInKnowVision June 2012 HNW Technical Webinar 2 - Valuation Planning
InKnowVision June 2012 HNW Technical Webinar 2 - Valuation Planning
 
ameriprise Earnings_Release_102405
ameriprise Earnings_Release_102405ameriprise Earnings_Release_102405
ameriprise Earnings_Release_102405
 
First Quarter 2005 Earnings Presentation
	First Quarter 2005 Earnings Presentation	First Quarter 2005 Earnings Presentation
First Quarter 2005 Earnings Presentation
 
credit-suisse Presentation slides
credit-suisse Presentation slidescredit-suisse Presentation slides
credit-suisse Presentation slides
 
ameriprise 1Q07_Release
ameriprise 1Q07_Releaseameriprise 1Q07_Release
ameriprise 1Q07_Release
 
2 cash flow and financial statement analysis
2   cash flow and financial statement analysis2   cash flow and financial statement analysis
2 cash flow and financial statement analysis
 
Paychex Fiscal 2010 Annual Report
Paychex Fiscal 2010 Annual ReportPaychex Fiscal 2010 Annual Report
Paychex Fiscal 2010 Annual Report
 
Capital Product Partners Fourth Quarter 2008 Earnings
Capital Product Partners Fourth Quarter 2008 EarningsCapital Product Partners Fourth Quarter 2008 Earnings
Capital Product Partners Fourth Quarter 2008 Earnings
 
Class7
Class7Class7
Class7
 
Interim report 1 2010, Media and analyst presentation, Nordea Bank
Interim report 1 2010, Media and analyst presentation, Nordea BankInterim report 1 2010, Media and analyst presentation, Nordea Bank
Interim report 1 2010, Media and analyst presentation, Nordea Bank
 

Recently uploaded

Yaroslav Rozhankivskyy: Три складові і три передумови максимальної продуктивн...
Yaroslav Rozhankivskyy: Три складові і три передумови максимальної продуктивн...Yaroslav Rozhankivskyy: Три складові і три передумови максимальної продуктивн...
Yaroslav Rozhankivskyy: Три складові і три передумови максимальної продуктивн...Lviv Startup Club
 
7.pdf This presentation captures many uses and the significance of the number...
7.pdf This presentation captures many uses and the significance of the number...7.pdf This presentation captures many uses and the significance of the number...
7.pdf This presentation captures many uses and the significance of the number...Paul Menig
 
Cracking the Cultural Competence Code.pptx
Cracking the Cultural Competence Code.pptxCracking the Cultural Competence Code.pptx
Cracking the Cultural Competence Code.pptxWorkforce Group
 
Organizational Transformation Lead with Culture
Organizational Transformation Lead with CultureOrganizational Transformation Lead with Culture
Organizational Transformation Lead with CultureSeta Wicaksana
 
Mondelez State of Snacking and Future Trends 2023
Mondelez State of Snacking and Future Trends 2023Mondelez State of Snacking and Future Trends 2023
Mondelez State of Snacking and Future Trends 2023Neil Kimberley
 
RSA Conference Exhibitor List 2024 - Exhibitors Data
RSA Conference Exhibitor List 2024 - Exhibitors DataRSA Conference Exhibitor List 2024 - Exhibitors Data
RSA Conference Exhibitor List 2024 - Exhibitors DataExhibitors Data
 
Call Girls Electronic City Just Call 👗 7737669865 👗 Top Class Call Girl Servi...
Call Girls Electronic City Just Call 👗 7737669865 👗 Top Class Call Girl Servi...Call Girls Electronic City Just Call 👗 7737669865 👗 Top Class Call Girl Servi...
Call Girls Electronic City Just Call 👗 7737669865 👗 Top Class Call Girl Servi...amitlee9823
 
Lucknow 💋 Escorts in Lucknow - 450+ Call Girl Cash Payment 8923113531 Neha Th...
Lucknow 💋 Escorts in Lucknow - 450+ Call Girl Cash Payment 8923113531 Neha Th...Lucknow 💋 Escorts in Lucknow - 450+ Call Girl Cash Payment 8923113531 Neha Th...
Lucknow 💋 Escorts in Lucknow - 450+ Call Girl Cash Payment 8923113531 Neha Th...anilsa9823
 
The Path to Product Excellence: Avoiding Common Pitfalls and Enhancing Commun...
The Path to Product Excellence: Avoiding Common Pitfalls and Enhancing Commun...The Path to Product Excellence: Avoiding Common Pitfalls and Enhancing Commun...
The Path to Product Excellence: Avoiding Common Pitfalls and Enhancing Commun...Aggregage
 
How to Get Started in Social Media for Art League City
How to Get Started in Social Media for Art League CityHow to Get Started in Social Media for Art League City
How to Get Started in Social Media for Art League CityEric T. Tung
 
Famous Olympic Siblings from the 21st Century
Famous Olympic Siblings from the 21st CenturyFamous Olympic Siblings from the 21st Century
Famous Olympic Siblings from the 21st Centuryrwgiffor
 
Call Girls Pune Just Call 9907093804 Top Class Call Girl Service Available
Call Girls Pune Just Call 9907093804 Top Class Call Girl Service AvailableCall Girls Pune Just Call 9907093804 Top Class Call Girl Service Available
Call Girls Pune Just Call 9907093804 Top Class Call Girl Service AvailableDipal Arora
 
Enhancing and Restoring Safety & Quality Cultures - Dave Litwiller - May 2024...
Enhancing and Restoring Safety & Quality Cultures - Dave Litwiller - May 2024...Enhancing and Restoring Safety & Quality Cultures - Dave Litwiller - May 2024...
Enhancing and Restoring Safety & Quality Cultures - Dave Litwiller - May 2024...Dave Litwiller
 
VIP Call Girls In Saharaganj ( Lucknow ) 🔝 8923113531 🔝 Cash Payment (COD) 👒
VIP Call Girls In Saharaganj ( Lucknow  ) 🔝 8923113531 🔝  Cash Payment (COD) 👒VIP Call Girls In Saharaganj ( Lucknow  ) 🔝 8923113531 🔝  Cash Payment (COD) 👒
VIP Call Girls In Saharaganj ( Lucknow ) 🔝 8923113531 🔝 Cash Payment (COD) 👒anilsa9823
 
Monthly Social Media Update April 2024 pptx.pptx
Monthly Social Media Update April 2024 pptx.pptxMonthly Social Media Update April 2024 pptx.pptx
Monthly Social Media Update April 2024 pptx.pptxAndy Lambert
 
Boost the utilization of your HCL environment by reevaluating use cases and f...
Boost the utilization of your HCL environment by reevaluating use cases and f...Boost the utilization of your HCL environment by reevaluating use cases and f...
Boost the utilization of your HCL environment by reevaluating use cases and f...Roland Driesen
 
Regression analysis: Simple Linear Regression Multiple Linear Regression
Regression analysis:  Simple Linear Regression Multiple Linear RegressionRegression analysis:  Simple Linear Regression Multiple Linear Regression
Regression analysis: Simple Linear Regression Multiple Linear RegressionRavindra Nath Shukla
 

Recently uploaded (20)

Yaroslav Rozhankivskyy: Три складові і три передумови максимальної продуктивн...
Yaroslav Rozhankivskyy: Три складові і три передумови максимальної продуктивн...Yaroslav Rozhankivskyy: Три складові і три передумови максимальної продуктивн...
Yaroslav Rozhankivskyy: Три складові і три передумови максимальної продуктивн...
 
7.pdf This presentation captures many uses and the significance of the number...
7.pdf This presentation captures many uses and the significance of the number...7.pdf This presentation captures many uses and the significance of the number...
7.pdf This presentation captures many uses and the significance of the number...
 
Cracking the Cultural Competence Code.pptx
Cracking the Cultural Competence Code.pptxCracking the Cultural Competence Code.pptx
Cracking the Cultural Competence Code.pptx
 
Organizational Transformation Lead with Culture
Organizational Transformation Lead with CultureOrganizational Transformation Lead with Culture
Organizational Transformation Lead with Culture
 
Mondelez State of Snacking and Future Trends 2023
Mondelez State of Snacking and Future Trends 2023Mondelez State of Snacking and Future Trends 2023
Mondelez State of Snacking and Future Trends 2023
 
VVVIP Call Girls In Greater Kailash ➡️ Delhi ➡️ 9999965857 🚀 No Advance 24HRS...
VVVIP Call Girls In Greater Kailash ➡️ Delhi ➡️ 9999965857 🚀 No Advance 24HRS...VVVIP Call Girls In Greater Kailash ➡️ Delhi ➡️ 9999965857 🚀 No Advance 24HRS...
VVVIP Call Girls In Greater Kailash ➡️ Delhi ➡️ 9999965857 🚀 No Advance 24HRS...
 
RSA Conference Exhibitor List 2024 - Exhibitors Data
RSA Conference Exhibitor List 2024 - Exhibitors DataRSA Conference Exhibitor List 2024 - Exhibitors Data
RSA Conference Exhibitor List 2024 - Exhibitors Data
 
Call Girls Electronic City Just Call 👗 7737669865 👗 Top Class Call Girl Servi...
Call Girls Electronic City Just Call 👗 7737669865 👗 Top Class Call Girl Servi...Call Girls Electronic City Just Call 👗 7737669865 👗 Top Class Call Girl Servi...
Call Girls Electronic City Just Call 👗 7737669865 👗 Top Class Call Girl Servi...
 
Forklift Operations: Safety through Cartoons
Forklift Operations: Safety through CartoonsForklift Operations: Safety through Cartoons
Forklift Operations: Safety through Cartoons
 
Lucknow 💋 Escorts in Lucknow - 450+ Call Girl Cash Payment 8923113531 Neha Th...
Lucknow 💋 Escorts in Lucknow - 450+ Call Girl Cash Payment 8923113531 Neha Th...Lucknow 💋 Escorts in Lucknow - 450+ Call Girl Cash Payment 8923113531 Neha Th...
Lucknow 💋 Escorts in Lucknow - 450+ Call Girl Cash Payment 8923113531 Neha Th...
 
The Path to Product Excellence: Avoiding Common Pitfalls and Enhancing Commun...
The Path to Product Excellence: Avoiding Common Pitfalls and Enhancing Commun...The Path to Product Excellence: Avoiding Common Pitfalls and Enhancing Commun...
The Path to Product Excellence: Avoiding Common Pitfalls and Enhancing Commun...
 
Mifty kit IN Salmiya (+918133066128) Abortion pills IN Salmiyah Cytotec pills
Mifty kit IN Salmiya (+918133066128) Abortion pills IN Salmiyah Cytotec pillsMifty kit IN Salmiya (+918133066128) Abortion pills IN Salmiyah Cytotec pills
Mifty kit IN Salmiya (+918133066128) Abortion pills IN Salmiyah Cytotec pills
 
How to Get Started in Social Media for Art League City
How to Get Started in Social Media for Art League CityHow to Get Started in Social Media for Art League City
How to Get Started in Social Media for Art League City
 
Famous Olympic Siblings from the 21st Century
Famous Olympic Siblings from the 21st CenturyFamous Olympic Siblings from the 21st Century
Famous Olympic Siblings from the 21st Century
 
Call Girls Pune Just Call 9907093804 Top Class Call Girl Service Available
Call Girls Pune Just Call 9907093804 Top Class Call Girl Service AvailableCall Girls Pune Just Call 9907093804 Top Class Call Girl Service Available
Call Girls Pune Just Call 9907093804 Top Class Call Girl Service Available
 
Enhancing and Restoring Safety & Quality Cultures - Dave Litwiller - May 2024...
Enhancing and Restoring Safety & Quality Cultures - Dave Litwiller - May 2024...Enhancing and Restoring Safety & Quality Cultures - Dave Litwiller - May 2024...
Enhancing and Restoring Safety & Quality Cultures - Dave Litwiller - May 2024...
 
VIP Call Girls In Saharaganj ( Lucknow ) 🔝 8923113531 🔝 Cash Payment (COD) 👒
VIP Call Girls In Saharaganj ( Lucknow  ) 🔝 8923113531 🔝  Cash Payment (COD) 👒VIP Call Girls In Saharaganj ( Lucknow  ) 🔝 8923113531 🔝  Cash Payment (COD) 👒
VIP Call Girls In Saharaganj ( Lucknow ) 🔝 8923113531 🔝 Cash Payment (COD) 👒
 
Monthly Social Media Update April 2024 pptx.pptx
Monthly Social Media Update April 2024 pptx.pptxMonthly Social Media Update April 2024 pptx.pptx
Monthly Social Media Update April 2024 pptx.pptx
 
Boost the utilization of your HCL environment by reevaluating use cases and f...
Boost the utilization of your HCL environment by reevaluating use cases and f...Boost the utilization of your HCL environment by reevaluating use cases and f...
Boost the utilization of your HCL environment by reevaluating use cases and f...
 
Regression analysis: Simple Linear Regression Multiple Linear Regression
Regression analysis:  Simple Linear Regression Multiple Linear RegressionRegression analysis:  Simple Linear Regression Multiple Linear Regression
Regression analysis: Simple Linear Regression Multiple Linear Regression
 

Business growth model 2 for import to keynote

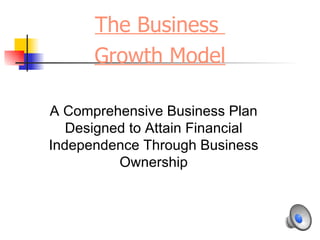
  • 1. The Business Growth Model A Comprehensive Business Plan Designed to Attain Financial Independence Through Business Ownership
  • 2. A. Model Goals and Objectives Achieved 1. Financial Independence 2. Retirement and Estate Resources 3. Education 4. Business Growth 5. Business Succession – Leaving More Behind Than What You Arrived With.
  • 3. A. The Business Growth Model Defined  20% profit before taxes  5 years to satisfy loan obligation  500K in Revenues  Easy to run – can insert people to operate business.  Equity in first unit funds purchase of 2nd unit  Equity in second unit funds purchase of 3rd unit.
  • 4. A. Financial Statement Analytics 1. Profitability 3. Solvency 5. Sustainability 7. Return on Investment 9. PALLR Sequence of Ratio analysis
  • 5. A. Ratio Analysis Measure Ratio Measure Standard (Sales - Operating expenses) Operating Margin 40% Sales Profitability (Operating margin - Discretionary Net Margin expenses) 20% Sales Receivables Revenues 4-5 times Turnover Avg. accounts receivable Activity Sales Asset Turnover 5-7 times Average Capital Assets Total Debt Leverage Debt Ratio Total Assets 30% Current Assets Liquidity Current Ratio Current Liabilities 2:1 Net Income Return on Equity 20% Shareholders' Equity Rate of Return Net Income Return on Assets 20% Average Total Assets
  • 6. A Ltd. Income Statement For the year ended xxxx Fees 568,887 Advertising 3,075 Bank charges and interest 515 Janitorial 5,496 Credit card discounts 1,820 Supplies 47,340 Insurance 3,226 Laboratory fees 24,615 Legal and Accounting 6,481 Licences, taxes and dues 5,805 Utilities 2,151 Parking 181 Postage, stationary, and office 7,478 Repairs and maintenance 2,847 Telephone 1,032 Wages and employee benefits 107,914 Amortization 6,348 Total expenses 226,324 Operating income 342,563 Management salaries 58,500 Income tax 37,201 Total management salaries and income tax 95,701 Net income for the year 246,862
  • 7. B Ltd. Income Statement For the year ended xxxx 2011 2010 Sales 247,639 344,169 Cost of Sales Employee benefits 3,518 4,968 Purchases and supplies 89,581 127,981 Subcontracts 17,764 33,938 Total Cost of Sales 110,863 166,887 Gross Profit 136,776 177,282 Expenses Advertising 6,930 4,899 Automobile 9,281 8,721 Bad Debts - 750 750 Bank charges and interest 335 893 Consulting 3,386 - Accounting 1,600 2,095 Legal 1,426 - Licences, taxes and dues 166 116 Postage, stationary and office 1,230 3,475 Rent 5,134 4,284 Telephone 4,966 4,596 Travel 3,242 2,559 Amortization 1,659 2,340 Total expenses 38,605 34,728 Operating income 98,171 142,554 Management salaries 115,000 115,000 Income tax - 4,342 Total Management salaries and income tax 115,000 119,342 Net (loss) income for the year - 16,829 23,212
  • 8. The Business Growth Model Progression Yr 1-5 - Business A Assumptions: Parameters -10% growth per year Business #1 purchase price = $500,000 -20% down payment on purchase price -Money down (20%) =$100,000-funding source =Owner's equity -Pay off loan in 5 years -Amount financed = $400,000 - Business purchase price = $1 per $1 of sales Business Loan Requirements Principal = $400,000 -5% growth (yrs 1-15) Interest rate = 5% -Keep all expenses within the percentage parameters Reduction period - 5 years -Solid brand Question marks -Interest rates Yr 1 Yr 2 Yr 3 Yr 4 Yr 5 Revenues $ 500,000 $ 525,000 $ 551,250 $ 578,813 $ 607,753 Cost of sales (36%) 180,000 189,000 198,450 208,373 218,791 Gross profit 320,000 336,000 352,800 370,440 388,962 M & A expenses (36% - 38.5%) 192,500 202,125 212,231 222,843 233,985 Management salaries 40,000 40,000 40,000 40,000 40,000 Operating income 87,500 93,875 100,569 107,597 114,977 Income tax (13.5%) 11,813 12,673 13,577 14,526 15,522 Net income after taxes $ 75,688 $ 81,202 $ 86,992 $ 93,072 $ 99,455
  • 9. The Business Growth Model Progression Yr 1-5 - Business A Beginning cash $ - -$ 11,593 -$ 17,671 -$ 17,960 -$ 12,168 Add: Yearly cash inflow 75,688 81,202 86,992 93,072 99,455 75,688 69,609 69,321 75,112 87,287 Loan principal reduction 70,323 76,401 81,383 84,976 86,917 Interest on loan (fixed) 16,957 10,879 5,898 2,304 362 Operational ending cash - 11,593 - 17,671 - 17,960 - 12,168 8 Capital replacements / improvements *** 20,000 20,000 20,000 20,000 20,000 Ending cash -$31,593 -$37,671 -$37,960 -$32,168 -$19,992 *** Updates to interior, capital improvements and/or replacements
  • 10. The Business Growth Model Progression Yr 6-10 - Business A + B Loan #1 Loan #2 $100,000 equity draw out on business A - 5% $400,000 for business B - 5% (5 year fixed) (5 year fixed) Purchase price of business B $500,000 Yr 6 Yr 7 Yr 8 Yr 9 Yr 10 BUSINESS B Revenues $ 500,000 $ 525,000 $ 551,250 $ 578,813 $ 607,753 Cost of sales (36%) 180,000 189,000 198,450 208,373 218,791 M & A expenses (36% - 38.5%) 192,500 202,125 212,231 222,843 233,985 Management salaries 40,000 40,000 40,000 40,000 40,000 Operating income 87,500 93,875 100,569 107,597 114,977 Income tax (13.5%) 11,813 12,673 13,577 14,526 15,522 Net income after taxes $ 75,688 $ 81,202 $ 86,992 $ 93,072 $ 99,455 BUSINESS A Revenues $ 638,141 $ 670,048 $ 703,550 $ 738,728 $ 775,664 Cost of sales (36%) 229,731 241,217 253,278 265,942 279,239 M & A expenses (36% - 38.5%) 245,684 257,968 270,867 284,410 298,631 Management salaries 40,000 40,000 40,000 40,000 40,000 Operating income 122,726 130,862 139,405 148,376 157,794 Income tax (13.5%) 16,568 17,666 18,820 20,031 21,302 Net income after taxes $ 106,158 $ 113,196 $ 120,586 $ 128,345 $ 136,492
  • 11. The Business Growth Model Progression Yr 6-10 - Business A + B CUMULATIVE Revenues $ 1,138,141 $ 1,195,048 $ 1,254,800 $ 1,317,540 $ 1,383,417 Cost of sales (36%) 409,731 430,217 451,728 474,314 498,030 M & A expenses (36% - 38.5%) 438,184 460,093 483,098 507,253 532,616 Management salaries 80,000 80,000 80,000 80,000 80,000 Operating income 210,226 224,737 239,974 255,973 272,771 Income tax 28,380 30,340 32,396 34,556 36,824 Net income after taxes $ 181,845 $ 194,398 $ 207,578 $ 221,416 $ 235,947 Beginning Cash -$19,992 $53,813 $140,171 $239,708 $353,084 Add: Yearly cash inflow 181,845 194,398 207,578 221,416 235,947 161,853 248,211 347,749 461,124 589,031 Loan principal reduction - loan #1 16,499 17,983 19,213 20,121 26,184 Loan principal reduction - loan #2 70,323 76,401 81,383 84,976 86,917 Interest on loan #1 4,261 2,777 1,547 639 119 Interest on loan #2 16,957 10,879 5,898 2,304 362 Ending operational cash 53,813 140,171 239,708 353,084 475,449 Capital improvements - business A 20000 20000 20000 20000 20000 Capital improvements - business B 20000 20000 20000 20000 20000 Asst. manager hire in year 6 - business A 50,000 50,000 50,000 50,000 50,000 Ending cash -$36,187 $50,171 $149,708 $263,084 $385,449
  • 12. The Business Growth Model Progression Yr 11-15 - Business A + B + C Loan #1 Loan #2 $100,000 equity draw out on business A - 5% $400,000 for business C - 5% (5 year fixed) (5 year fixed) Purchase price of business C $500,000 Yr 6 Yr 7 Yr 8 Yr 9 Yr 10 BUSINESS C Revenues $ 500,000 $ 525,000 $ 551,250 $ 578,813 $ 607,753 Cost of sales (36%) 180,000 189,000 198,450 208,373 218,791 M & A expenses (36% - 38.5%) 192,500 202,125 212,231 222,843 233,985 Management salaries 40,000 40,000 40,000 40,000 40,000 Operating income 87,500 93,875 100,569 107,597 114,977 Income tax (13.5%) 11,813 12,673 13,577 14,526 15,522 Net income after taxes $ 75,688 $ 81,202 $ 86,992 $ 93,072 $ 99,455 BUSINESS B Revenues $ 638,141 $ 670,048 $ 703,550 $ 738,728 $ 775,664 Cost of sales (36%) 229,731 241,217 253,278 265,942 279,239 M & A expenses (36% - 38.5%) 245,684 257,968 270,867 284,410 298,631 Management salaries 40,000 40,000 40,000 40,000 40,000 Operating income 122,726 130,862 139,405 148,376 157,794 Income tax (13.5%) 16,568 17,666 18,820 20,031 21,302 Net income after taxes $ 106,158 $ 113,196 $ 120,586 $ 128,345 $ 136,492 BUSINESS A Revenues $ 814,447 $ 855,170 $ 897,928 $ 942,824 $ 989,966 Cost of sales (36%) 293,201 307,861 323,254 339,417 356,388 M & A expenses (36% - 38.5%) 313,562 329,240 345,702 362,987 381,137 Management salaries 40,000 40,000 40,000 40,000 40,000 Operating income 167,684 178,068 188,972 200,420 212,441 Income tax (13.5%) 22,637 24,039 25,511 27,057 28,680 Net income after taxes $ 145,047 $ 154,029 $ 163,460 $ 173,364 $ 183,762
  • 13. The Business Growth Model Progression Yr 11-15 - Business A + B + C CUMULATIVE Revenues $ 1,952,588 $ 2,050,217 $ 2,152,728 $ 2,260,365 $ 2,373,383 Cost of sales (36%) 702,932 738,078 774,982 813,731 854,418 M & A expenses (36% - 38.5%) 751,746 789,334 828,800 870,240 913,752 Management salaries 120,000 120,000 120,000 120,000 120,000 Operating income 377,910 402,805 428,946 456,393 485,213 Income tax 51,018 54,379 57,908 61,613 65,504 Net income after taxes $ 326,892 $ 348,427 $ 371,038 $ 394,780 $ 419,709 Beginning Cash $385,449 $604,301 $844,688 $1,107,685 $1,394,425 Add: Yearly cash inflow 326,892 348,427 371,038 394,780 419,709 712,341 952,728 1,215,726 1,502,465 1,814,134 Loan principal reduction - loan #1 16,499 17,983 19,213 20,121 26,184 Loan principal reduction - loan #2 70,323 76,401 81,383 84,976 86,917 Interest on loan #1 4,261 2,777 1,547 639 119 Interest on loan #2 16,957 10,879 5,898 2,304 362 Ending operational cash 604,301 844,688 1,107,685 1,394,425 1,700,552 Capital improvements - business A 20,000 20,000 20,000 20,000 20,000 Capital improvements - business B 20,000 20,000 20,000 20,000 20,000 Capital improvements - business C 20,000 20,000 20,000 20,000 20,000 Asst. manager - business A 50,000 50,000 50,000 50,000 50,000 Asst. manager in year 10 - business B 50,000 50,000 50,000 50,000 50,000 Asst. manager in year 10 - business C 50,000 50,000 50,000 50,000 50,000 Ending cash $394,301 $634,688 $897,685 $1,184,425 $1,490,552
  • 14. A. Growth Model Analytics What Do We Have At year 15? 2. $1.49 Million in the bank. 3. Annual salary of $120,000. 4. Asst. mgmt secured at each location. 5. Assuming market value = revenues, $2,373 Million in asset value to facilitate retirement objectives. 6. All net income within the $500K Small Business Deduction Limit. 8. Ownership concentrating on:  Management  Marketing  Strategy 13. Financial resources to extend business network.
  • 15. Business Growth Model 2,500,000 2,000,000 1,500,000 $ 1,000,000 500,000 0 Yr 1 Yr 2 Yr 3 Yr 4 Yr 5 Yr 6 Yr 7 Yr 8 Yr 9 Yr 10 Yr 11 Yr 12 Yr 13 Yr 14 Yr 15 -500,000 Year Revenues Net income after taxes Ending cash
  • 16. A. Growth Model Analytics • Optimal business parameters for the model. -20% net income before taxes -500K revenue levels -Recession-proof industry -Location -Demographic of customers (margin vs. volume) • Operational requirements. -Staffing levels -Ability to replicate management efficiencies • Personal longevity, sustainability, and success. -Strategy -Intent of Business -Job replacement
  • 17. A. Final Thoughts Future seminars in the NAVIGATOR series to assist in finding and operating the right businesses: •BUSINESS AUDIT PROOF – securing your business against theft and maximizing the effectiveness and efficient operation of your business BUSINESS VALUATION – Determining The Proper Price To Pay For Value. FINANCIAL STATEMENT ANALYSIS – The Key To Finding Your Profitable Businesses. CORPORATE TAX PLANNING – How To Legally Keep As Much Money as You Own. PERSONAL AND ESTATE TAX PLANNING – Making All The Work Pay Off; How To Fully Enjoy The Fruits of Your Labour

Editor's Notes

  1. Usually, keeping a debt/equity ratio of around 30% will result in a maximization of the Weighted avg. cost of capital (WACC); ie, the interest expense is normally lowest when utilizing a hybrid financing structure of 30% debt and 70% equity. Profitability of 20% is optimal because a full loan can be paid off in approx. 5 years; some industries just don ’ t have this level of net income, but that ’ s made up in cash flow volume.
  2. OPEN THE AUDIENCE FOR DISCUSSION ON THIS!