SlideShare a Scribd company logo
1 of 8
Download to read offline
HEALTH SECTOR JOINS GREEN RATINGS ERA
A study of the costs and benefits of sustainable healthcare facilities

Overview
Healthcare facilities are an enormous sustainability challenge, on average a
hospital requires at least twice as much more energy per sq/m than an office
building and approximately six times as much water per sq/m. The difficulty in
addressing these issues has posed a significant hurdle for the sector and
brought about a whole new way of thinking and a long awaited leap in the
evolution of the suite of Green Star tools.

Expenditure on Sustainability has grown by 2-2.5% of total construction costs
on most major hospital projects over the last five years. This will most likely
increase if Health Departments continue their push towards more sustainable
buildings.

Sustainable healthcare facilities are achievable, but will come at a cost if
specific ratings are required. The long term operational benefits, of which it is
anticipated there are many, will only be tested should the boun daries of
sustainability in buildings continue to be expanded, and invested in. It will be
interesting to see if Government and private providers take up mandatory
Green Star ratings which are estimated to add a further layer of costs in the
order of 0% to 3% for a 4 Star rating, 3% to 6% for 5 Star ratings and some
10%+ for 6 Star ratings.


About Green Star Healthcare
The Green Building Council of Australia recently released the Technical Manual –
Green Star Healthcare. There is much interest in this new rating tool, which had
been released in pilot form for some time.

The aims of the Green Star - Healthcare (v1) tool are to help owners and
operators of healthcare facilities around Australia to:
         Minimise the environmental impact of their buildings
         Improve patient health outcomes and staff productivity
         Receive recognition for green leadership
         Achieve real cost savings

The Green Star rating system process can be best illustrated using the adjacent
diagram produced by the Green Building Council of Australia (GBCA).

There are nine environmental impact categories within the tool, which are
consistent across all of the GBCA’s assessment tools for various building types.
The credits achievable within each category share some commonality, but do vary
according to their appropriateness to their building type.

                                                                                    Source: GBCA
About Green Star Healthcare (cont)
Credit point scores within each category are awarded to projects
where they have met the overall objectives of Green Star and the
specific aims of the Tool Credits.

All Category scores (with the exception of Innovation), are then
weighted to ensure the categories are reflected appropriately. These
weightings differ between States and Territories to reflect local
sensitivities. The weighted scores generate an overall score which
provides a Green Star Rating.

The Green Star points credit system contains numerous points
available for each of the environmental categories (refer to graph).

The Green Star rating system ranges from One Star through to Six Stars. Only projects that achieve a rating of Four Stars
or above are eligible for certification. The Green Star Healthcare – (v1) scoring requirements, after Environmental Weighting, are
summarised in the following table:

Overall Weighted Score                       Rating                                        Classification

45-59 Points                                 Four Star                                     Best Practice

60-74 Points                                 Five Star                                     Australian Excellence

75+ Points                                   Six Star                                      World Leadership


Public and Private Hospitals
Health Departments in the various states are still determining their position on the Green Star tool, although some states have
already committed to achieving Green Star ratings on specific projects, while other states are considering whether to seek fo rmal
ratings or to establish their own priorities. This paper is essentially about the c ost impacts on public hospitals.

The situation is somewhat different for Private Hospitals where:
         There may be a marketing advantage associated with a Green Star certified rating.
         The cost of achieving a Green Star rating may be higher than is the case fo r public hospitals where higher Business As
         Usual standards have generally already been adopted.


Take Up of Green Star
Green Star ratings have become a standard consideration in the commercial office market since the initial release of Office
Design v1. The achievement of a high Green Star rating in the new office market has been perceived by the office developers as
an essential part of marketing to attract long term tenants, preserve the value of the office building and provide healthier
environments for the building occupants.

Since the release of the original Office Design tool, other tools have followed for different industry sectors, including Mix ed Use
Residential, Retail Centres, Education, Industrial, Mixed Use, Office As-built and Interiors, as well as the Healthcare tool.

Apart from the very high rate of take-up of Green Star for new major offices it is too early to determine the take up rate of the
other tools.

The design approach for a four star Green Star solution can be considered fairly simply by adopting readily available credits
within the tool framework. The key to a five star solution will be the approach taken with energy and the greenhouse gas emis sion
reduction options employed, as well as the water recycling / reuse strategies im plemented, and the opportunities to utilise the
material re-use credits, etc.


                                                                                                                                    Page 2
Take Up of Green Star (cont)
The graph below illustrates the dominant importance of energy/emission reductions in the Healthcare (v1) tool.


Primary Drivers
Within the Healthcare system assets are not generally subject to industry driven market factors such as tenant attraction and
retention, and building resale value. The majority of providers in the Healthcare sector fall into the public state run systems, and
as such some of the drivers within the Commercial Office sector, do not apply.

There are many and varied benefits to developing a “green” healthcare facility both Quantifiable and Qualitative. A number of
these benefits are outlined below:


Quantifiable Benefits                                              Qualitative Benefits

Improved energy efficiency                                         Improved Environmental Quality with potential for:
                                                                       -   Increased staff productivity
                                                                       -   Greater staff attraction, recruitment and retention
                                                                       -   Improved patient wellbeing and shorter recovery times
                                                                       -   Improved experience/satisfaction for patients

Reduced emissions                                                  Improved patient wellbeing via increased Vitamin D from
                                                                   sunlight

Improved water efficiency                                          Risk mitigation from reduced infection control issues, etc.

Reduced operating and recurrent costs                              Meeting Government expectations

Contribution to emission reduction obligations                     Meeting Community expectations

Rather than providing substantial economic saving benefits in the short term, the key benefits within healthcare projects are likely
to be more subjective, related to patient and staff well being, improved recovery times, increased productivity and reduced staff
turnover, as well as the embedded environmental impact reductions.


                                                                                                                                 Page 3
Business As Usual (BAU)
Minimum environmental standards in public hospitals have improved significantly in recent years. The following is a summary of
significant items that have become BAU over the past few years:

Energy Reduction Measures                                                        Other Measures

Building management system with energy conservation features                     Increased natural daylight provision

External Shading                                                                 Rainwater harvesting and reuse

Efficient facades (glazing)                                                      Efficient water fixtures and fittings

High efficiency lighting                                                         Waste management reduction

Variable speed drives (VSD’s)                                                    Reduced VOC’s (material choices)

Higher efficiency plant and equipment                                            Minimisation of PVC material usage

Increased insulation                                                             Improved air quality


Davis Langdon estimate that the adoption of greener BAU outcomes over the last five years, have resulted in cost increases of
around 2% of total construction costs.

Other drivers which have impacted on cost include the current trend towards single in -patient rooms with individual room controls.
This increases overall floor areas and costs (including operating costs) but has other perceived benefits such as reduced infection
rates and increased flexibility in design.

The criticality of infection control, etc in acute hospital departments also poses challenges to sustainable design, restrict ing the
extent to which some sustainability initiatives can be considered, e.g. temperature and lighting control in theatres, etc .

Travel and engineering (plant) area requirements are also on the increase with major Hospitals incorporating travel and
engineering area provisions equating to approximately 40% of the hospital’s functional areas. This is due to a number of factors
including larger plant rooms due mainly to OH&S requirements, provision for future proofing and the incorporation of sustainab le
design attributes.. This increase in areas makes the natural lighting issue even harder to achieve due to larger floor plates.

An increasing need for future proofing in hospital designs due to rapidly changing technology is also a consideration, where future
flexibility needs to be considered to be a true “sustainable” facility, and avoid obsolescence.

The importance of security, including secure parking and direct access to the hospital for staff as well as visitors can in m any
cases contradict an environmental desire to reduce car-parking provisions, but for a hospital this is a critical issue, as nurses, for
example, should not be reliant on public transport when doing shift work . Also, many large hospitals are now located out of city
centres, often with barely adequate public transportation available.

Recent hospital surveys found that creating a healing environment is one of the biggest priorities for facility users. Factors suc h
as air quality, comfortable indoor spaces, natural lighting, access to outdoor areas, visibility, and reduced staff travel ti me (i.e.
avoiding very long corridors) are key issues for staff, with some being considered more important than energy conservation. T his
is worth noting given the high importance put on the Energy Category within the Healthcare (v1) tool.


Achieving a High Energy Score
Given the high number of points available within the Energy Category particularly the Greenhouse Gas Emissions credit of the
Healthcare tool (20 available points); great emphasis will be put on the energy systems employed within facilities. Tr igeneration
systems are emerging as the most important system being proposed by designers for assisting with the upgrading of major
hospitals from 4 Star designs to 5 Star designs.

Trigeneration plants are now preferred to the earlier Cogeneration plants that simultaneously produced electricity and heat. These
plants are also known as Combined Heat and Power (CHP) plants.


                                                                                                                                  Page 4
Achieving a High Energy Score (cont)
Trigeneration is the modern name for a plant that simultaneously produces:
         Electricity,
         Heat, and
         Converts heat energy to chilled water for cooling.


The primary energy source in Australia is normally natural gas; however other forms of cheap energy such as waste heat from
industrial processes may be used as a primary energy source.

Conventional thermal (e.g. coal fired) power stations only convert around 30% of the fuel energy into electricity for consume rs
after process and transmission losses. The remainder of this heat is rejected to a body of water, or the atmosphere depending on
particular site economics and location. This type of conventional thermal plant therefore has three major down sides:
          Primary fuel emissions are higher because of the fuel used (normally coal in Australia),
          There are significant transmission losses between power plants and end users, and
          Only some 30% of the primary energy is converted into a usable form (electricity) for users.

The above is in sharp contrast to the outputs from well designed and operated Trigeneration plants that:
        Normally use a clean fuel (natural gas),
        Convert up to 80% of available primary energy into usable form (around 30% electricity and 50% heat for heating or
        generation of chilled water), and
        Eliminate transmission losses

As a result of the above Trigeneration plants offer substantial reductions in Greenhouse Gas Emissions and contribute to a
significant point score in the Energy Category of the Green Star tool.

Trigeneration systems also provide additional energy independence and redundancy for hospitals.

Detailed feasibility studies are required for each Trigeneration proposal as:
         There are many Trigeneration configurations available
         Primary energy costs for Trigeneration vary by site
         Water costs vary by site
         There is a need to fully test sensitivities to assumptions made in each feasibility study (e.g.; energy escalation rates)
         There are significant costs for associated works including plant space/building costs, land cost, supply authority costs,
         heat rejecting plant costs, etc

It is important that these feasibility studies proceed early in the project design phases so that the overall design can proceed
without potential for major changes in the latter part of the design process.

As a guide typical Trigeneration plants are costing in the order of $3.5m to $4.5m per Mega watt including all associated plant,
heat exchangers, chillers, building costs, project costs, etc. This represents an extra cost of around $1.5m to $2.5m per Meg awatt
above the use of conventional plant. The associated green house gas reductions are likely to be in the order of 7000 to 8000
tonnes per Megawatt per annum.

Life cycle costs vary widely by site, load profile and primary energy cost. Pay back periods of 8 + years plus are being
demonstrated on some projects.


                                                                                                                                   Page 5
Capital Cost for Increased Green Star
One of the challenges of incorporating sustainability within health projects is that few facilities are standalone new build. The
majority of Hospital works incorporate amendment to, or refurbishment of existing facilities and have the added complexit y of tying
into existing central plant systems and linkages. This can lead to limitations on expansion opportunities and flexibility in enabling
future proofing provisions.

Constraints associated with availability of land, building orientation and the ab ility to avoid large floor plates may also be
encountered on existing sites, leading to less than optimal designs. This may add to the cost of projects as alternative solu tions in
achieving category requirements are investigated, i.e. numerous internal atr ia, light shafts and extensive glazed facades, etc in
the pursuit of natural light, and the like.


Costs of 4 and 5 Star
Davis Langdon’s research show that the cost of achieving 4 Star Green
Star in Healthcare (v1), is in the range of 0% to 3% above baseline
costs.

5 Star Green Star is in the order of 3% to 6% above baseline costs.

The primary cost differentiator relates to the energy / emission reduction
approach, and the incorporation of a Trigeneration plant.

The adjacent graph represents the approximate cost differentials based
upon a cost per square metre of weighted category point for a five star
target project.

It should be noted that due to the integrated nature of the design some
categories costs are interlinked, and the systems assisting Indoor
Environment Quality (IEQ) are heavily related to the Energy category,
which is why the IEQ “cost” appears extremely low. The management
category ranking is due in part to the low weighting it receives as well
as the interpretation of the cost of commissioning.

The above is based on a large scale new build hospital development. Costs will vary for smaller facilities, where some aspect s of
sustainable design will be easier to accommodate. Conversely, facilities with larger, deep floor plates will encounter difficulty in
achieving some points economically. The costs associated with refurbishment of existing facilities will also vary widely depe ndent
upon the existing conditions and site constraints.

The above cost increases relate to capital cost only, and do not factor in any cost benefits that may be derived from the intangible
economic benefits a sustainable healthcare facility may generate over its lifetime.


Costs of 6 Star
Davis Langdon is of the opinion that achieving 6 Star ratings on large acute hospitals is yet to be demonstrated to be viable and a
6 Star Green Star target would require substantial additional funding above Business As Usual.

The situation however may be different on smaller facilities where a range of additional ESD fe atures can be more economically
incorporated into designs. For example:
         Natural ventilation
         Improved access to places of respite
         Increased natural light penetration
         Increased opportunities to improve line of sight to views for a higher percentage of floor areas
         Higher percentage of roof area to accommodate ESD features
         More potential for use of green roofs

It is estimated that the additional cost of achieving a 6 star rating on a smaller Healthcare facility may be in the order of 10%+
above BAU.


                                                                                                                                Page 6
Recurrent Costs Savings
The quantifiable economic benefits of improved energy efficiency, reduced emission charges and improved water efficiency have
the potential to reduce healthcare operational costs. Total energy and water costs for a major hospital are typica lly around 1% of
total annual operating costs, so it follows that annual operating costs can be reduced, for example, by some 0.2% if energy a nd
water costs are reduced by say 20%. Such Energy and Water initiatives have the potential to provide reasonable pay back periods
that are typically in the order of 8+ years.

One of the economic challenges associated with justifying the business case for many attributes within high energy usage
facilities is the long term establishment of discounted energy tariffs, which many facilities have in place. This impacts on the
economic justification of new plant in terms of payback periods.

More research is needed to quantify the qualitative benefits listed earlier in the Primary Drivers section. However, it needs to be
noted that any established improvement in staff productivity, staff retention and patient wellbeing has very significant pote ntial to
reduce healthcare operational costs. For example, staff costs in an acute hospital may be in the order of 70% of all opera tional
costs. So it follows if savings can be made in this cost centre then significant overall cost savings are possible.


Summary
Dedicated funding, or the introduction of incentives and grants to facilities incorporating sustainable attributes could b e one way
of separating funding streams and stimulating investment into greener design solutions.

Any such investment will lead to the need for much greater emphasis on life cycle costs and payback period assessments during
the evaluation of sustainability options to justify the incorporation of additional capital cost items.

The challenge for health providers will be to not only weigh up the viability of sustainable options but to prioritise these against
the competing needs for new facilities and equipment. This is not going to be an easy task in an industry where funding
availability and facility requirements are often at odds.


If you would like to discuss the details of this report further, please contact Lee Williams, Director and Davis Langdon’s Sustainability Leader,
by email: lwilliams@davislangdon.com.au or by phone: 03 9933 8800


                                                                                                                                          Page 7
Our Offices
Australia        Adelaide            +61 8 8410 4044
                 Brisbane            +61 7 3221 1788
                 Cairns              +61 7 4051 7511
                 Canberra            +61 2 6257 4428
                 Darwin              +61 8 8981 8020
                 Hobart              +61 3 6234 8788
                 Melbourne           +61 3 9933 8800
                 Perth               +61 8 9221 8870
                 Sunshine Coast      +61 7 5479 2005
                 Sydney              +61 2 9956 8822
                 Townsville          +61 7 4721 2788

New Zealand       Auckland           +64 9 379 9903
                  Christchurch       +64 3 366 2669
                  Wellington         +64 4 472 7505


Our Services
Project Services – Project Management, Cost Management, Building Surveying, Urban Planning,
Specification Services
Assurance Services – Infrastructure Verification Services, Technical Due Diligence, Property Performance
Reporting, Make Good Assessments
Certification Services – Third Party Certification to National and International Standards
Sustainability Services – Strategies for New and Existing Buildings


Davis Langdon & Seah International
Australia, Bahrain, Botswana, Brunei, China, Croatia, England, Hong Kong, India, Indonesia, Ireland, Japan,
Kazakhstan, Korea, Lebanon, Malaysia, New Zealand, Pakistan, Philippines, Qatar, Russia, Scotland,
Singapore, South Africa, Spain, Thailand, UAE, USA, Vietnam and Wales


www.davislangdon.com

More Related Content

Featured

2024 State of Marketing Report – by Hubspot
2024 State of Marketing Report – by Hubspot2024 State of Marketing Report – by Hubspot
2024 State of Marketing Report – by HubspotMarius Sescu
 
Everything You Need To Know About ChatGPT
Everything You Need To Know About ChatGPTEverything You Need To Know About ChatGPT
Everything You Need To Know About ChatGPTExpeed Software
 
Product Design Trends in 2024 | Teenage Engineerings
Product Design Trends in 2024 | Teenage EngineeringsProduct Design Trends in 2024 | Teenage Engineerings
Product Design Trends in 2024 | Teenage EngineeringsPixeldarts
 
How Race, Age and Gender Shape Attitudes Towards Mental Health
How Race, Age and Gender Shape Attitudes Towards Mental HealthHow Race, Age and Gender Shape Attitudes Towards Mental Health
How Race, Age and Gender Shape Attitudes Towards Mental HealthThinkNow
 
AI Trends in Creative Operations 2024 by Artwork Flow.pdf
AI Trends in Creative Operations 2024 by Artwork Flow.pdfAI Trends in Creative Operations 2024 by Artwork Flow.pdf
AI Trends in Creative Operations 2024 by Artwork Flow.pdfmarketingartwork
 
PEPSICO Presentation to CAGNY Conference Feb 2024
PEPSICO Presentation to CAGNY Conference Feb 2024PEPSICO Presentation to CAGNY Conference Feb 2024
PEPSICO Presentation to CAGNY Conference Feb 2024Neil Kimberley
 
Content Methodology: A Best Practices Report (Webinar)
Content Methodology: A Best Practices Report (Webinar)Content Methodology: A Best Practices Report (Webinar)
Content Methodology: A Best Practices Report (Webinar)contently
 
How to Prepare For a Successful Job Search for 2024
How to Prepare For a Successful Job Search for 2024How to Prepare For a Successful Job Search for 2024
How to Prepare For a Successful Job Search for 2024Albert Qian
 
Social Media Marketing Trends 2024 // The Global Indie Insights
Social Media Marketing Trends 2024 // The Global Indie InsightsSocial Media Marketing Trends 2024 // The Global Indie Insights
Social Media Marketing Trends 2024 // The Global Indie InsightsKurio // The Social Media Age(ncy)
 
Trends In Paid Search: Navigating The Digital Landscape In 2024
Trends In Paid Search: Navigating The Digital Landscape In 2024Trends In Paid Search: Navigating The Digital Landscape In 2024
Trends In Paid Search: Navigating The Digital Landscape In 2024Search Engine Journal
 
5 Public speaking tips from TED - Visualized summary
5 Public speaking tips from TED - Visualized summary5 Public speaking tips from TED - Visualized summary
5 Public speaking tips from TED - Visualized summarySpeakerHub
 
ChatGPT and the Future of Work - Clark Boyd
ChatGPT and the Future of Work - Clark Boyd ChatGPT and the Future of Work - Clark Boyd
ChatGPT and the Future of Work - Clark Boyd Clark Boyd
 
Getting into the tech field. what next
Getting into the tech field. what next Getting into the tech field. what next
Getting into the tech field. what next Tessa Mero
 
Google's Just Not That Into You: Understanding Core Updates & Search Intent
Google's Just Not That Into You: Understanding Core Updates & Search IntentGoogle's Just Not That Into You: Understanding Core Updates & Search Intent
Google's Just Not That Into You: Understanding Core Updates & Search IntentLily Ray
 
Time Management & Productivity - Best Practices
Time Management & Productivity -  Best PracticesTime Management & Productivity -  Best Practices
Time Management & Productivity - Best PracticesVit Horky
 
The six step guide to practical project management
The six step guide to practical project managementThe six step guide to practical project management
The six step guide to practical project managementMindGenius
 
Beginners Guide to TikTok for Search - Rachel Pearson - We are Tilt __ Bright...
Beginners Guide to TikTok for Search - Rachel Pearson - We are Tilt __ Bright...Beginners Guide to TikTok for Search - Rachel Pearson - We are Tilt __ Bright...
Beginners Guide to TikTok for Search - Rachel Pearson - We are Tilt __ Bright...RachelPearson36
 

Featured (20)

2024 State of Marketing Report – by Hubspot
2024 State of Marketing Report – by Hubspot2024 State of Marketing Report – by Hubspot
2024 State of Marketing Report – by Hubspot
 
Everything You Need To Know About ChatGPT
Everything You Need To Know About ChatGPTEverything You Need To Know About ChatGPT
Everything You Need To Know About ChatGPT
 
Product Design Trends in 2024 | Teenage Engineerings
Product Design Trends in 2024 | Teenage EngineeringsProduct Design Trends in 2024 | Teenage Engineerings
Product Design Trends in 2024 | Teenage Engineerings
 
How Race, Age and Gender Shape Attitudes Towards Mental Health
How Race, Age and Gender Shape Attitudes Towards Mental HealthHow Race, Age and Gender Shape Attitudes Towards Mental Health
How Race, Age and Gender Shape Attitudes Towards Mental Health
 
AI Trends in Creative Operations 2024 by Artwork Flow.pdf
AI Trends in Creative Operations 2024 by Artwork Flow.pdfAI Trends in Creative Operations 2024 by Artwork Flow.pdf
AI Trends in Creative Operations 2024 by Artwork Flow.pdf
 
Skeleton Culture Code
Skeleton Culture CodeSkeleton Culture Code
Skeleton Culture Code
 
PEPSICO Presentation to CAGNY Conference Feb 2024
PEPSICO Presentation to CAGNY Conference Feb 2024PEPSICO Presentation to CAGNY Conference Feb 2024
PEPSICO Presentation to CAGNY Conference Feb 2024
 
Content Methodology: A Best Practices Report (Webinar)
Content Methodology: A Best Practices Report (Webinar)Content Methodology: A Best Practices Report (Webinar)
Content Methodology: A Best Practices Report (Webinar)
 
How to Prepare For a Successful Job Search for 2024
How to Prepare For a Successful Job Search for 2024How to Prepare For a Successful Job Search for 2024
How to Prepare For a Successful Job Search for 2024
 
Social Media Marketing Trends 2024 // The Global Indie Insights
Social Media Marketing Trends 2024 // The Global Indie InsightsSocial Media Marketing Trends 2024 // The Global Indie Insights
Social Media Marketing Trends 2024 // The Global Indie Insights
 
Trends In Paid Search: Navigating The Digital Landscape In 2024
Trends In Paid Search: Navigating The Digital Landscape In 2024Trends In Paid Search: Navigating The Digital Landscape In 2024
Trends In Paid Search: Navigating The Digital Landscape In 2024
 
5 Public speaking tips from TED - Visualized summary
5 Public speaking tips from TED - Visualized summary5 Public speaking tips from TED - Visualized summary
5 Public speaking tips from TED - Visualized summary
 
ChatGPT and the Future of Work - Clark Boyd
ChatGPT and the Future of Work - Clark Boyd ChatGPT and the Future of Work - Clark Boyd
ChatGPT and the Future of Work - Clark Boyd
 
Getting into the tech field. what next
Getting into the tech field. what next Getting into the tech field. what next
Getting into the tech field. what next
 
Google's Just Not That Into You: Understanding Core Updates & Search Intent
Google's Just Not That Into You: Understanding Core Updates & Search IntentGoogle's Just Not That Into You: Understanding Core Updates & Search Intent
Google's Just Not That Into You: Understanding Core Updates & Search Intent
 
How to have difficult conversations
How to have difficult conversations How to have difficult conversations
How to have difficult conversations
 
Introduction to Data Science
Introduction to Data ScienceIntroduction to Data Science
Introduction to Data Science
 
Time Management & Productivity - Best Practices
Time Management & Productivity -  Best PracticesTime Management & Productivity -  Best Practices
Time Management & Productivity - Best Practices
 
The six step guide to practical project management
The six step guide to practical project managementThe six step guide to practical project management
The six step guide to practical project management
 
Beginners Guide to TikTok for Search - Rachel Pearson - We are Tilt __ Bright...
Beginners Guide to TikTok for Search - Rachel Pearson - We are Tilt __ Bright...Beginners Guide to TikTok for Search - Rachel Pearson - We are Tilt __ Bright...
Beginners Guide to TikTok for Search - Rachel Pearson - We are Tilt __ Bright...
 

The Cost Of Green Star Hospitals Davis Langdon Research Report

  • 1. HEALTH SECTOR JOINS GREEN RATINGS ERA A study of the costs and benefits of sustainable healthcare facilities Overview Healthcare facilities are an enormous sustainability challenge, on average a hospital requires at least twice as much more energy per sq/m than an office building and approximately six times as much water per sq/m. The difficulty in addressing these issues has posed a significant hurdle for the sector and brought about a whole new way of thinking and a long awaited leap in the evolution of the suite of Green Star tools. Expenditure on Sustainability has grown by 2-2.5% of total construction costs on most major hospital projects over the last five years. This will most likely increase if Health Departments continue their push towards more sustainable buildings. Sustainable healthcare facilities are achievable, but will come at a cost if specific ratings are required. The long term operational benefits, of which it is anticipated there are many, will only be tested should the boun daries of sustainability in buildings continue to be expanded, and invested in. It will be interesting to see if Government and private providers take up mandatory Green Star ratings which are estimated to add a further layer of costs in the order of 0% to 3% for a 4 Star rating, 3% to 6% for 5 Star ratings and some 10%+ for 6 Star ratings. About Green Star Healthcare The Green Building Council of Australia recently released the Technical Manual – Green Star Healthcare. There is much interest in this new rating tool, which had been released in pilot form for some time. The aims of the Green Star - Healthcare (v1) tool are to help owners and operators of healthcare facilities around Australia to: Minimise the environmental impact of their buildings Improve patient health outcomes and staff productivity Receive recognition for green leadership Achieve real cost savings The Green Star rating system process can be best illustrated using the adjacent diagram produced by the Green Building Council of Australia (GBCA). There are nine environmental impact categories within the tool, which are consistent across all of the GBCA’s assessment tools for various building types. The credits achievable within each category share some commonality, but do vary according to their appropriateness to their building type. Source: GBCA
  • 2. About Green Star Healthcare (cont) Credit point scores within each category are awarded to projects where they have met the overall objectives of Green Star and the specific aims of the Tool Credits. All Category scores (with the exception of Innovation), are then weighted to ensure the categories are reflected appropriately. These weightings differ between States and Territories to reflect local sensitivities. The weighted scores generate an overall score which provides a Green Star Rating. The Green Star points credit system contains numerous points available for each of the environmental categories (refer to graph). The Green Star rating system ranges from One Star through to Six Stars. Only projects that achieve a rating of Four Stars or above are eligible for certification. The Green Star Healthcare – (v1) scoring requirements, after Environmental Weighting, are summarised in the following table: Overall Weighted Score Rating Classification 45-59 Points Four Star Best Practice 60-74 Points Five Star Australian Excellence 75+ Points Six Star World Leadership Public and Private Hospitals Health Departments in the various states are still determining their position on the Green Star tool, although some states have already committed to achieving Green Star ratings on specific projects, while other states are considering whether to seek fo rmal ratings or to establish their own priorities. This paper is essentially about the c ost impacts on public hospitals. The situation is somewhat different for Private Hospitals where: There may be a marketing advantage associated with a Green Star certified rating. The cost of achieving a Green Star rating may be higher than is the case fo r public hospitals where higher Business As Usual standards have generally already been adopted. Take Up of Green Star Green Star ratings have become a standard consideration in the commercial office market since the initial release of Office Design v1. The achievement of a high Green Star rating in the new office market has been perceived by the office developers as an essential part of marketing to attract long term tenants, preserve the value of the office building and provide healthier environments for the building occupants. Since the release of the original Office Design tool, other tools have followed for different industry sectors, including Mix ed Use Residential, Retail Centres, Education, Industrial, Mixed Use, Office As-built and Interiors, as well as the Healthcare tool. Apart from the very high rate of take-up of Green Star for new major offices it is too early to determine the take up rate of the other tools. The design approach for a four star Green Star solution can be considered fairly simply by adopting readily available credits within the tool framework. The key to a five star solution will be the approach taken with energy and the greenhouse gas emis sion reduction options employed, as well as the water recycling / reuse strategies im plemented, and the opportunities to utilise the material re-use credits, etc. Page 2
  • 3. Take Up of Green Star (cont) The graph below illustrates the dominant importance of energy/emission reductions in the Healthcare (v1) tool. Primary Drivers Within the Healthcare system assets are not generally subject to industry driven market factors such as tenant attraction and retention, and building resale value. The majority of providers in the Healthcare sector fall into the public state run systems, and as such some of the drivers within the Commercial Office sector, do not apply. There are many and varied benefits to developing a “green” healthcare facility both Quantifiable and Qualitative. A number of these benefits are outlined below: Quantifiable Benefits Qualitative Benefits Improved energy efficiency Improved Environmental Quality with potential for: - Increased staff productivity - Greater staff attraction, recruitment and retention - Improved patient wellbeing and shorter recovery times - Improved experience/satisfaction for patients Reduced emissions Improved patient wellbeing via increased Vitamin D from sunlight Improved water efficiency Risk mitigation from reduced infection control issues, etc. Reduced operating and recurrent costs Meeting Government expectations Contribution to emission reduction obligations Meeting Community expectations Rather than providing substantial economic saving benefits in the short term, the key benefits within healthcare projects are likely to be more subjective, related to patient and staff well being, improved recovery times, increased productivity and reduced staff turnover, as well as the embedded environmental impact reductions. Page 3
  • 4. Business As Usual (BAU) Minimum environmental standards in public hospitals have improved significantly in recent years. The following is a summary of significant items that have become BAU over the past few years: Energy Reduction Measures Other Measures Building management system with energy conservation features Increased natural daylight provision External Shading Rainwater harvesting and reuse Efficient facades (glazing) Efficient water fixtures and fittings High efficiency lighting Waste management reduction Variable speed drives (VSD’s) Reduced VOC’s (material choices) Higher efficiency plant and equipment Minimisation of PVC material usage Increased insulation Improved air quality Davis Langdon estimate that the adoption of greener BAU outcomes over the last five years, have resulted in cost increases of around 2% of total construction costs. Other drivers which have impacted on cost include the current trend towards single in -patient rooms with individual room controls. This increases overall floor areas and costs (including operating costs) but has other perceived benefits such as reduced infection rates and increased flexibility in design. The criticality of infection control, etc in acute hospital departments also poses challenges to sustainable design, restrict ing the extent to which some sustainability initiatives can be considered, e.g. temperature and lighting control in theatres, etc . Travel and engineering (plant) area requirements are also on the increase with major Hospitals incorporating travel and engineering area provisions equating to approximately 40% of the hospital’s functional areas. This is due to a number of factors including larger plant rooms due mainly to OH&S requirements, provision for future proofing and the incorporation of sustainab le design attributes.. This increase in areas makes the natural lighting issue even harder to achieve due to larger floor plates. An increasing need for future proofing in hospital designs due to rapidly changing technology is also a consideration, where future flexibility needs to be considered to be a true “sustainable” facility, and avoid obsolescence. The importance of security, including secure parking and direct access to the hospital for staff as well as visitors can in m any cases contradict an environmental desire to reduce car-parking provisions, but for a hospital this is a critical issue, as nurses, for example, should not be reliant on public transport when doing shift work . Also, many large hospitals are now located out of city centres, often with barely adequate public transportation available. Recent hospital surveys found that creating a healing environment is one of the biggest priorities for facility users. Factors suc h as air quality, comfortable indoor spaces, natural lighting, access to outdoor areas, visibility, and reduced staff travel ti me (i.e. avoiding very long corridors) are key issues for staff, with some being considered more important than energy conservation. T his is worth noting given the high importance put on the Energy Category within the Healthcare (v1) tool. Achieving a High Energy Score Given the high number of points available within the Energy Category particularly the Greenhouse Gas Emissions credit of the Healthcare tool (20 available points); great emphasis will be put on the energy systems employed within facilities. Tr igeneration systems are emerging as the most important system being proposed by designers for assisting with the upgrading of major hospitals from 4 Star designs to 5 Star designs. Trigeneration plants are now preferred to the earlier Cogeneration plants that simultaneously produced electricity and heat. These plants are also known as Combined Heat and Power (CHP) plants. Page 4
  • 5. Achieving a High Energy Score (cont) Trigeneration is the modern name for a plant that simultaneously produces: Electricity, Heat, and Converts heat energy to chilled water for cooling. The primary energy source in Australia is normally natural gas; however other forms of cheap energy such as waste heat from industrial processes may be used as a primary energy source. Conventional thermal (e.g. coal fired) power stations only convert around 30% of the fuel energy into electricity for consume rs after process and transmission losses. The remainder of this heat is rejected to a body of water, or the atmosphere depending on particular site economics and location. This type of conventional thermal plant therefore has three major down sides: Primary fuel emissions are higher because of the fuel used (normally coal in Australia), There are significant transmission losses between power plants and end users, and Only some 30% of the primary energy is converted into a usable form (electricity) for users. The above is in sharp contrast to the outputs from well designed and operated Trigeneration plants that: Normally use a clean fuel (natural gas), Convert up to 80% of available primary energy into usable form (around 30% electricity and 50% heat for heating or generation of chilled water), and Eliminate transmission losses As a result of the above Trigeneration plants offer substantial reductions in Greenhouse Gas Emissions and contribute to a significant point score in the Energy Category of the Green Star tool. Trigeneration systems also provide additional energy independence and redundancy for hospitals. Detailed feasibility studies are required for each Trigeneration proposal as: There are many Trigeneration configurations available Primary energy costs for Trigeneration vary by site Water costs vary by site There is a need to fully test sensitivities to assumptions made in each feasibility study (e.g.; energy escalation rates) There are significant costs for associated works including plant space/building costs, land cost, supply authority costs, heat rejecting plant costs, etc It is important that these feasibility studies proceed early in the project design phases so that the overall design can proceed without potential for major changes in the latter part of the design process. As a guide typical Trigeneration plants are costing in the order of $3.5m to $4.5m per Mega watt including all associated plant, heat exchangers, chillers, building costs, project costs, etc. This represents an extra cost of around $1.5m to $2.5m per Meg awatt above the use of conventional plant. The associated green house gas reductions are likely to be in the order of 7000 to 8000 tonnes per Megawatt per annum. Life cycle costs vary widely by site, load profile and primary energy cost. Pay back periods of 8 + years plus are being demonstrated on some projects. Page 5
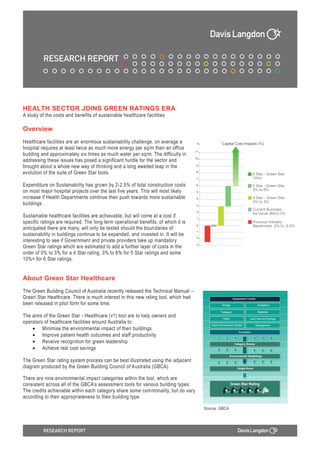
  • 6. Capital Cost for Increased Green Star One of the challenges of incorporating sustainability within health projects is that few facilities are standalone new build. The majority of Hospital works incorporate amendment to, or refurbishment of existing facilities and have the added complexit y of tying into existing central plant systems and linkages. This can lead to limitations on expansion opportunities and flexibility in enabling future proofing provisions. Constraints associated with availability of land, building orientation and the ab ility to avoid large floor plates may also be encountered on existing sites, leading to less than optimal designs. This may add to the cost of projects as alternative solu tions in achieving category requirements are investigated, i.e. numerous internal atr ia, light shafts and extensive glazed facades, etc in the pursuit of natural light, and the like. Costs of 4 and 5 Star Davis Langdon’s research show that the cost of achieving 4 Star Green Star in Healthcare (v1), is in the range of 0% to 3% above baseline costs. 5 Star Green Star is in the order of 3% to 6% above baseline costs. The primary cost differentiator relates to the energy / emission reduction approach, and the incorporation of a Trigeneration plant. The adjacent graph represents the approximate cost differentials based upon a cost per square metre of weighted category point for a five star target project. It should be noted that due to the integrated nature of the design some categories costs are interlinked, and the systems assisting Indoor Environment Quality (IEQ) are heavily related to the Energy category, which is why the IEQ “cost” appears extremely low. The management category ranking is due in part to the low weighting it receives as well as the interpretation of the cost of commissioning. The above is based on a large scale new build hospital development. Costs will vary for smaller facilities, where some aspect s of sustainable design will be easier to accommodate. Conversely, facilities with larger, deep floor plates will encounter difficulty in achieving some points economically. The costs associated with refurbishment of existing facilities will also vary widely depe ndent upon the existing conditions and site constraints. The above cost increases relate to capital cost only, and do not factor in any cost benefits that may be derived from the intangible economic benefits a sustainable healthcare facility may generate over its lifetime. Costs of 6 Star Davis Langdon is of the opinion that achieving 6 Star ratings on large acute hospitals is yet to be demonstrated to be viable and a 6 Star Green Star target would require substantial additional funding above Business As Usual. The situation however may be different on smaller facilities where a range of additional ESD fe atures can be more economically incorporated into designs. For example: Natural ventilation Improved access to places of respite Increased natural light penetration Increased opportunities to improve line of sight to views for a higher percentage of floor areas Higher percentage of roof area to accommodate ESD features More potential for use of green roofs It is estimated that the additional cost of achieving a 6 star rating on a smaller Healthcare facility may be in the order of 10%+ above BAU. Page 6
  • 7. Recurrent Costs Savings The quantifiable economic benefits of improved energy efficiency, reduced emission charges and improved water efficiency have the potential to reduce healthcare operational costs. Total energy and water costs for a major hospital are typica lly around 1% of total annual operating costs, so it follows that annual operating costs can be reduced, for example, by some 0.2% if energy a nd water costs are reduced by say 20%. Such Energy and Water initiatives have the potential to provide reasonable pay back periods that are typically in the order of 8+ years. One of the economic challenges associated with justifying the business case for many attributes within high energy usage facilities is the long term establishment of discounted energy tariffs, which many facilities have in place. This impacts on the economic justification of new plant in terms of payback periods. More research is needed to quantify the qualitative benefits listed earlier in the Primary Drivers section. However, it needs to be noted that any established improvement in staff productivity, staff retention and patient wellbeing has very significant pote ntial to reduce healthcare operational costs. For example, staff costs in an acute hospital may be in the order of 70% of all opera tional costs. So it follows if savings can be made in this cost centre then significant overall cost savings are possible. Summary Dedicated funding, or the introduction of incentives and grants to facilities incorporating sustainable attributes could b e one way of separating funding streams and stimulating investment into greener design solutions. Any such investment will lead to the need for much greater emphasis on life cycle costs and payback period assessments during the evaluation of sustainability options to justify the incorporation of additional capital cost items. The challenge for health providers will be to not only weigh up the viability of sustainable options but to prioritise these against the competing needs for new facilities and equipment. This is not going to be an easy task in an industry where funding availability and facility requirements are often at odds. If you would like to discuss the details of this report further, please contact Lee Williams, Director and Davis Langdon’s Sustainability Leader, by email: lwilliams@davislangdon.com.au or by phone: 03 9933 8800 Page 7
  • 8. Our Offices Australia Adelaide +61 8 8410 4044 Brisbane +61 7 3221 1788 Cairns +61 7 4051 7511 Canberra +61 2 6257 4428 Darwin +61 8 8981 8020 Hobart +61 3 6234 8788 Melbourne +61 3 9933 8800 Perth +61 8 9221 8870 Sunshine Coast +61 7 5479 2005 Sydney +61 2 9956 8822 Townsville +61 7 4721 2788 New Zealand Auckland +64 9 379 9903 Christchurch +64 3 366 2669 Wellington +64 4 472 7505 Our Services Project Services – Project Management, Cost Management, Building Surveying, Urban Planning, Specification Services Assurance Services – Infrastructure Verification Services, Technical Due Diligence, Property Performance Reporting, Make Good Assessments Certification Services – Third Party Certification to National and International Standards Sustainability Services – Strategies for New and Existing Buildings Davis Langdon & Seah International Australia, Bahrain, Botswana, Brunei, China, Croatia, England, Hong Kong, India, Indonesia, Ireland, Japan, Kazakhstan, Korea, Lebanon, Malaysia, New Zealand, Pakistan, Philippines, Qatar, Russia, Scotland, Singapore, South Africa, Spain, Thailand, UAE, USA, Vietnam and Wales www.davislangdon.com