GM_Stock Information_Analyst Consensus
•Download as DOC, PDF•
0 likes•136 views

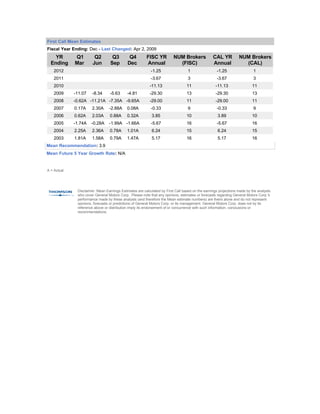
This document provides quarterly and annual earnings estimates for fiscal years 2012 through 2003 from various analysts covering General Motors. It shows the mean estimate for each quarter and fiscal year, as well as the number of analysts contributing to each estimate. A disclaimer at the bottom indicates that the mean estimate numbers are provided by First Call and do not represent opinions or forecasts by General Motors itself.
Recommended

Recommended
More Related Content
What's hot
What's hot (18)
Viewers also liked
Viewers also liked (13)
More from Manya Mohan
More from Manya Mohan (20)
Recently uploaded
Recently uploaded (20)
GM_Stock Information_Analyst Consensus
- 1. First Call Mean Estimates Fiscal Year Ending: Dec - Last Changed: Apr 2, 2009 YR Q1 Q2 Q3 Q4 FISC YR NUM Brokers CAL YR NUM Brokers Ending Mar Jun Sep Dec Annual (FISC) Annual (CAL) 2012 -1.25 1 -1.25 1 2011 -3.67 3 -3.67 3 2010 -11.13 11 -11.13 11 2009 -11.07 -8.34 -5.63 -4.81 -29.30 13 -29.30 13 2008 -0.62A -11.21A -7.35A -9.65A -29.00 11 -29.00 11 2007 0.17A 2.30A -2.88A 0.08A -0.33 9 -0.33 9 2006 0.62A 2.03A 0.88A 0.32A 3.85 10 3.89 10 2005 -1.74A -0.28A -1.99A -1.66A -5.67 16 -5.67 16 2004 2.25A 2.36A 0.78A 1.01A 6.24 15 6.24 15 2003 1.81A 1.58A 0.79A 1.47A 5.17 16 5.17 16 Mean Recommendation: 3.9 Mean Future 5 Year Growth Rate: N/A A = Actual Disclaimer: Mean Earnings Estimates are calculated by First Call based on the earnings projections made by the analysts who cover General Motors Corp.. Please note that any opinions, estimates or forecasts regarding General Motors Corp.'s performance made by these analysts (and therefore the Mean estimate numbers) are theirs alone and do not represent opinions, forecasts or predictions of General Motors Corp. or its management. General Motors Corp. does not by its reference above or distribution imply its endorsement of or concurrence with such information, conclusions or recommendations.