SlideShare a Scribd company logo
1 of 2
Download to read offline
Multifamily Snapshot
                                                                                                                      DC Metro • Second Quarter • 2012


                                                                     Market Tracker                Vacancy         Net Absorption          Completions         Asking Rent
                                                                     *Arrows = Current Qtr Trend   3.9%            894 Units               327 Units           $1,476


                                                                     Vacancy Drops, Despite New Supply
                                                                     A large portion of apartment demand is driven by an expanding economy and employment growth.
                                                                     Despite a slowdown in federal job creation, the Washington regional employment market continues
                                                                     to expand. After a robust first quarter in 2012, second-quarter employment growth continued in the
                                                                     metro area, albeit at a slower pace. The Washington DC region added 12,200 non-farm payroll jobs
                                                                     in the first quarter of this year, and 8,000 jobs in the second. We expect this moderate job growth
                                                                     to continue through the November elections and into 2013. However, the types of jobs being
                                                                     created have changed. Twelve to eighteen months ago the Federal Government and the Professional
                                                                     and Businesses Services sector were the top job producers in the region. At the end of the second
DC METRO MULTIFAMILY
                                                                     quarter 2012, the Education and Healthcare sector led employment growth gaining 8,000 payrolls
Economic Indicators                                                  since the beginning of 2012. The Federal Government downsized by 4,900 payrolls – the equivalent
                                                                     of 1.3% of the regional federal workforce – during the same timeframe.
                                    2Q 2012            2Q 2011       As the regional employment picture generally continues to improve, more people are forming
  Employment                            3.030 M        2.987 M       households. More of those households are renting. The homeownership rate in the Washington
                                                                     metro area decreased for a second consecutive quarter, registering 65.8% in the second quarter of
  Population                            5.765 M        5.704 M       2012 after reaching 68.2% in in the fourth quarter of 2011. Based on the total number of
                                                                     households, this decline in homeownership equates to an additional 48,000 households who rent.
  Median Income                         $89,170        $86,654
                                                                     Such increased demand from these additional renters is helping to prop up multifamily fundamentals
  MF Permits Issued                      2,650            2,163      in the region. Net absorption for apartments in the second quarter of this year was 894 units metro-
                                                                     wide – a slight up-tick from that reported in the previous quarter. The number of new apartment
  MF Starts                              1,887            1,199
                                                                     completions in the second quarter was more than double that of the first quarter. Despite new
                                                                     apartment deliveries, the vacancy rate decreased 0.1 percentage point over the quarter ending at
                                                                     3.9% metro-wide. Average asking rental rates were $1,476 per month across the region, a 0.9
Absorption, Completions & Vacancy                                    percentage point increase over the quarter. Once again, Northern Virginia boasted the highest rate
                                                                     increase on average, a gain of $16 during the quarter to $1,569. Rents in the District increased $14
             10,000                                          7%      to $1,500, while those in suburban Maryland rose $10 during the quarter to $1,359.
              9,000                                          6%
              8,000
              7,000                                          5%      After a slow start early in the year, multifamily sales picked up steam in the second quarter. For the
# of Units


              6,000
              5,000
                                                             4%      first half of 2012, $1.4 billion in multifamily sales transactions took place. A majority of these sales
                                                             3%
              4,000                                                  occurred in the suburbs with $576 million transacting in Northern Virginia and $569 million in
              3,000                                          2%
              2,000
                                                             1%
                                                                     suburban Maryland since the beginning of the year. The average price per unit was $202,000. The
              1,000
                  0                                          0%      highest dollar transaction in 2012 to date has been Equity Residential’s purchase of 4701 Willard
                      2007 2008 2009 2010 2011 2012                  Avenue in Chevy Chase for $209 million or $393,000 per unit.
                                                YTD

                Net Absorption   Completions       Vacancy           Forecast
Source: REIS                                                         •	      Multifamily construction continued to increase in the second quarter of 2012. Multifamily
                                                                             starts were up 57% compared to one year ago while permits were up 23% during the same
                                                                             time frame. Through 2014, an estimated 30,100 multifamily permits will be pulled compared
Asking Rents                                                                 to the 13,800 permits issued from 2009 to 2011. Expect single family construction to make
$1,600
                                                                             a recovery as well with over 40,000 permits being issued through 2014. That is a 77%
$1,550                                                                       increase compared to the prior three years.
$1,500
$1,450                                                               •	      Net migration to the Washington DC metro area will continue to increase, albeit at a slower
$1,400
                                                                             rate. Moody’s estimates a net 66,300 people migrating to the region through 2014. This
$1,350
$1,300                                                                       compares to the 140,700 people who migrated to the metro from 2009 to 2011. Therefore,
$1,250                                                                       multifamily demand will stem more from current residents versus new populace to the region.
$1,200
                 2007    2008    2009     2010     2011   2012 YTD   •	      We expect employment growth to be tempered through the federal elections later this year.
                            DC   NoVA    Suburban MD
                                                                             This may push some demand for housing from this year into 2013. With large amounts of
Source: REIS                                                                 supply forecast to deliver over the next 12 to 24 months, certain submarkets may see
                                                                             vacancy rates rise in the short term. Still, the Washington Metro continues to boast one of
                                                                             the lowest multifamily vacancy rates in the U.S.


                                                                                                                                                       www.cassidyturley.com
Cassidy Turley Multifamily Market Snapshot
DC Metro •   Second Quarter •  2012

                                                                                                      VACANT            OCCUPIED                                                          AVERAGE
                      SUBMARKET                                 INVENTORY*        COMPLETIONS                                               VACANCY       NET ABSORPTION
                                                                                                       STOCK             STOCK                                                         ASKING RENT
                                                                                                                                               RATE

   Anacostia/Northeast DC                                           33,688                 -            1,879             31,809               5.6%               64                          $1,068

   Capitol Hill/Southwest                                            7,662                 -             452               7,210               5.9%               15                          $1,548

   Downtown/Logan Circle                                            10,075                 -             282               9,793               2.8%               20                          $1,780

   Dupont Circle/Adams Morgan                                       11,716                 -             199              11,517               1.7%               24                          $1,654

   Foggy Bottom                                                      5,487                 -             274               5,213               5.0%               28                          $1,876
   Northwest D.C./Georgetown                                        10,058                 -             412               9,646               4.1%               10                          $1,762
   Woodley Pk./Cleveland Pk./Van Ness                               10,162                 -             254               9,908               2.5%                -                          $1,983

   DISTRICT MARKET TOTALS                                           88,848                 -            3,752             85,096               4.2%              161                          $1,500

   Columbia Pike/Shirlington/NE Alexandria                          19,617                 -             803              18,814               4.1%               65                          $1,524

   Falls Church/Annandale/Skyline                                   34,116                 -             933              33,183               2.7%               68                          $1,472

   Loudoun County                                                    7,805                 -             359               7,446               4.6%                8                          $1,480

   Old Town                                                          5,169                 -             202               4,967               3.9%               25                          $1,669

   Pentagon City/Crystal City                                        9,841                 -             384               9,457               3.9%               29                          $2,211

   Prince William County                                            15,885                 -             620              15,265               3.9%               79                          $1,187

   Rosslyn/Ballston                                                 16,477             46                626              15,851               3.8%               44                          $1,901

   SE Fairfax County                                                15,588                 -             436              15,152               2.8%               78                          $1,477

   Tysons Corner/Fairfax City                                       12,261                 -             662              11,599               5.4%               25                          $1,666

   W Fairfax County                                                 21,582             281               626              20,956               2.9%              145                          $1,517

   NORTHERN VA MARKET TOTALS                                       158,341             327             5,651             152,690               3.6%              566                          $1,569

   Bethesda/Chevy Chase                                              8,545                 -             239               8,306               2.8%               60                          $1,989

   Gaithersburg/Germantown                                          16,090                 -             434              15,656               2.7%               33                          $1,392

   Kensington/Wheaton/NE Montgomery                                 16,741                 -             497              16,244               3.0%                2                          $1,389

   Rockville                                                        10,603                 -             615               9,988               5.8%               11                          $1,772

   Silver Spring                                                     9,649                 -             550               9,099               5.7%               19                          $1,559

   Takoma Park                                                      10,845                 -             206              10,639               1.9%               11                          $1,249

   Central Prince George's County                                   23,659                 -             820              22,839               3.5%               51                          $1,179

   N Prince George's County                                         24,503                 -            1,328             23,175               5.4%              (38)                         $1,330

   S Prince George's County                                         24,273                 -            1,251             23,022               5.2%               18                          $1,088

 SUBURBAN MD MARKET TOTALS                                         144,908                 -           5,940             138,968               4.1%              167                          $1,359

 DC METRO TOTAL                                                    392,097             327             15,343            376,754               3.9%              894                          $1,476

Sources: REIS, Cassidy Turley
*All figures are multifamily units except vacancy rate.


Key Sales Transactions 2Q 12
 PROPERTY                          UNITS     SELLER/BUYER                                                                 PRICE              PRICE/UNIT

 4701 Willard Apartments            532      Irene S. Pollin/Equity Residential                                           $209,325,000       $393,468
                                                                                                                                                           Jeffrey Kottmeier
 Axiom & 909 at Capitol Yards       493      JPI/JPMorgan Asset Management                                                $189,306,000       $383,988
                                                                                                                                                           Vice President, Director of Research
 Villages of Morgan Metro           1242     Hunt Companies/Harbor Group Management                                       $182,000,000       $146,538
                                                                                                                                                           2101 L Street, NW
 Palladium Court                    556      LaSalle Investment Management/The Praedium Group & The Milestone Group       $125,500,000       $225,719      Suite 700
                                                                                                                                                           Washington, DC 20037
 Woodway At Trinity Centre          504      CBRE Global Investors/Home Properties, Inc.                                  $96,000,000        $190,476
                                                                                                                                                           Tel: 202.463.2100
                                                                                                                                                           Fax: 202.223.2989
About Cassidy Turley                                                                                                                                       Jeffrey.Kottmeier@cassidyturley.com
Cassidy Turley is a leading commercial real estate services provider with more than 3,600 professionals in more than 60 offices nationwide. The            The information contained within this report is
company represents a wide range of clients—from small businesses to Fortune 500 companies, from local non-profits to major institutions. The firm          gathered from multiple sources considered to be
completed transactions valued at $22 billion in 2011, manages 455 million square feet on behalf of institutional, corporate and private clients and        reliable. The information may contain errors or
supports more than 28,000 domestic corporate services locations. Cassidy Turley serves owners, investors and tenants with a full spectrum of integrated    omissions and is presented without any warranty
                                                                                                                                                           or representations as to its accuracy.	
commercial real estate services—including capital markets, tenant representation, corporate services, project leasing, property management, project
and development services, and research and consulting. Cassidy Turley enhances its global service delivery outside of North America through a              Copyright © 2012 Cassidy Turley.
partnership with GVA, giving clients access to commercial real estate professionals in 65 international markets. Please visit www.cassidyturley.com for    All rights reserved.
more information about Cassidy Turley.

                                                                                                                                                                                www.cassidyturley.com

More Related Content

Featured

2024 State of Marketing Report – by Hubspot
2024 State of Marketing Report – by Hubspot2024 State of Marketing Report – by Hubspot
2024 State of Marketing Report – by HubspotMarius Sescu
 
Everything You Need To Know About ChatGPT
Everything You Need To Know About ChatGPTEverything You Need To Know About ChatGPT
Everything You Need To Know About ChatGPTExpeed Software
 
Product Design Trends in 2024 | Teenage Engineerings
Product Design Trends in 2024 | Teenage EngineeringsProduct Design Trends in 2024 | Teenage Engineerings
Product Design Trends in 2024 | Teenage EngineeringsPixeldarts
 
How Race, Age and Gender Shape Attitudes Towards Mental Health
How Race, Age and Gender Shape Attitudes Towards Mental HealthHow Race, Age and Gender Shape Attitudes Towards Mental Health
How Race, Age and Gender Shape Attitudes Towards Mental HealthThinkNow
 
AI Trends in Creative Operations 2024 by Artwork Flow.pdf
AI Trends in Creative Operations 2024 by Artwork Flow.pdfAI Trends in Creative Operations 2024 by Artwork Flow.pdf
AI Trends in Creative Operations 2024 by Artwork Flow.pdfmarketingartwork
 
PEPSICO Presentation to CAGNY Conference Feb 2024
PEPSICO Presentation to CAGNY Conference Feb 2024PEPSICO Presentation to CAGNY Conference Feb 2024
PEPSICO Presentation to CAGNY Conference Feb 2024Neil Kimberley
 
Content Methodology: A Best Practices Report (Webinar)
Content Methodology: A Best Practices Report (Webinar)Content Methodology: A Best Practices Report (Webinar)
Content Methodology: A Best Practices Report (Webinar)contently
 
How to Prepare For a Successful Job Search for 2024
How to Prepare For a Successful Job Search for 2024How to Prepare For a Successful Job Search for 2024
How to Prepare For a Successful Job Search for 2024Albert Qian
 
Social Media Marketing Trends 2024 // The Global Indie Insights
Social Media Marketing Trends 2024 // The Global Indie InsightsSocial Media Marketing Trends 2024 // The Global Indie Insights
Social Media Marketing Trends 2024 // The Global Indie InsightsKurio // The Social Media Age(ncy)
 
Trends In Paid Search: Navigating The Digital Landscape In 2024
Trends In Paid Search: Navigating The Digital Landscape In 2024Trends In Paid Search: Navigating The Digital Landscape In 2024
Trends In Paid Search: Navigating The Digital Landscape In 2024Search Engine Journal
 
5 Public speaking tips from TED - Visualized summary
5 Public speaking tips from TED - Visualized summary5 Public speaking tips from TED - Visualized summary
5 Public speaking tips from TED - Visualized summarySpeakerHub
 
ChatGPT and the Future of Work - Clark Boyd
ChatGPT and the Future of Work - Clark Boyd ChatGPT and the Future of Work - Clark Boyd
ChatGPT and the Future of Work - Clark Boyd Clark Boyd
 
Getting into the tech field. what next
Getting into the tech field. what next Getting into the tech field. what next
Getting into the tech field. what next Tessa Mero
 
Google's Just Not That Into You: Understanding Core Updates & Search Intent
Google's Just Not That Into You: Understanding Core Updates & Search IntentGoogle's Just Not That Into You: Understanding Core Updates & Search Intent
Google's Just Not That Into You: Understanding Core Updates & Search IntentLily Ray
 
Time Management & Productivity - Best Practices
Time Management & Productivity -  Best PracticesTime Management & Productivity -  Best Practices
Time Management & Productivity - Best PracticesVit Horky
 
The six step guide to practical project management
The six step guide to practical project managementThe six step guide to practical project management
The six step guide to practical project managementMindGenius
 
Beginners Guide to TikTok for Search - Rachel Pearson - We are Tilt __ Bright...
Beginners Guide to TikTok for Search - Rachel Pearson - We are Tilt __ Bright...Beginners Guide to TikTok for Search - Rachel Pearson - We are Tilt __ Bright...
Beginners Guide to TikTok for Search - Rachel Pearson - We are Tilt __ Bright...RachelPearson36
 

Featured (20)

2024 State of Marketing Report – by Hubspot
2024 State of Marketing Report – by Hubspot2024 State of Marketing Report – by Hubspot
2024 State of Marketing Report – by Hubspot
 
Everything You Need To Know About ChatGPT
Everything You Need To Know About ChatGPTEverything You Need To Know About ChatGPT
Everything You Need To Know About ChatGPT
 
Product Design Trends in 2024 | Teenage Engineerings
Product Design Trends in 2024 | Teenage EngineeringsProduct Design Trends in 2024 | Teenage Engineerings
Product Design Trends in 2024 | Teenage Engineerings
 
How Race, Age and Gender Shape Attitudes Towards Mental Health
How Race, Age and Gender Shape Attitudes Towards Mental HealthHow Race, Age and Gender Shape Attitudes Towards Mental Health
How Race, Age and Gender Shape Attitudes Towards Mental Health
 
AI Trends in Creative Operations 2024 by Artwork Flow.pdf
AI Trends in Creative Operations 2024 by Artwork Flow.pdfAI Trends in Creative Operations 2024 by Artwork Flow.pdf
AI Trends in Creative Operations 2024 by Artwork Flow.pdf
 
Skeleton Culture Code
Skeleton Culture CodeSkeleton Culture Code
Skeleton Culture Code
 
PEPSICO Presentation to CAGNY Conference Feb 2024
PEPSICO Presentation to CAGNY Conference Feb 2024PEPSICO Presentation to CAGNY Conference Feb 2024
PEPSICO Presentation to CAGNY Conference Feb 2024
 
Content Methodology: A Best Practices Report (Webinar)
Content Methodology: A Best Practices Report (Webinar)Content Methodology: A Best Practices Report (Webinar)
Content Methodology: A Best Practices Report (Webinar)
 
How to Prepare For a Successful Job Search for 2024
How to Prepare For a Successful Job Search for 2024How to Prepare For a Successful Job Search for 2024
How to Prepare For a Successful Job Search for 2024
 
Social Media Marketing Trends 2024 // The Global Indie Insights
Social Media Marketing Trends 2024 // The Global Indie InsightsSocial Media Marketing Trends 2024 // The Global Indie Insights
Social Media Marketing Trends 2024 // The Global Indie Insights
 
Trends In Paid Search: Navigating The Digital Landscape In 2024
Trends In Paid Search: Navigating The Digital Landscape In 2024Trends In Paid Search: Navigating The Digital Landscape In 2024
Trends In Paid Search: Navigating The Digital Landscape In 2024
 
5 Public speaking tips from TED - Visualized summary
5 Public speaking tips from TED - Visualized summary5 Public speaking tips from TED - Visualized summary
5 Public speaking tips from TED - Visualized summary
 
ChatGPT and the Future of Work - Clark Boyd
ChatGPT and the Future of Work - Clark Boyd ChatGPT and the Future of Work - Clark Boyd
ChatGPT and the Future of Work - Clark Boyd
 
Getting into the tech field. what next
Getting into the tech field. what next Getting into the tech field. what next
Getting into the tech field. what next
 
Google's Just Not That Into You: Understanding Core Updates & Search Intent
Google's Just Not That Into You: Understanding Core Updates & Search IntentGoogle's Just Not That Into You: Understanding Core Updates & Search Intent
Google's Just Not That Into You: Understanding Core Updates & Search Intent
 
How to have difficult conversations
How to have difficult conversations How to have difficult conversations
How to have difficult conversations
 
Introduction to Data Science
Introduction to Data ScienceIntroduction to Data Science
Introduction to Data Science
 
Time Management & Productivity - Best Practices
Time Management & Productivity -  Best PracticesTime Management & Productivity -  Best Practices
Time Management & Productivity - Best Practices
 
The six step guide to practical project management
The six step guide to practical project managementThe six step guide to practical project management
The six step guide to practical project management
 
Beginners Guide to TikTok for Search - Rachel Pearson - We are Tilt __ Bright...
Beginners Guide to TikTok for Search - Rachel Pearson - We are Tilt __ Bright...Beginners Guide to TikTok for Search - Rachel Pearson - We are Tilt __ Bright...
Beginners Guide to TikTok for Search - Rachel Pearson - We are Tilt __ Bright...
 

DC Metro Multi Family Snapshot 2Q12

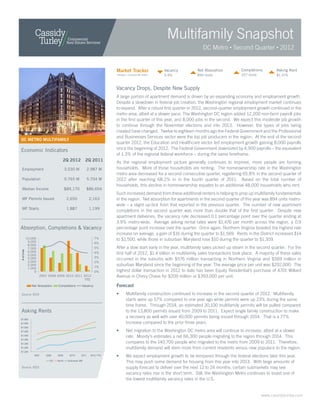
  • 1. Multifamily Snapshot DC Metro • Second Quarter • 2012 Market Tracker Vacancy Net Absorption Completions Asking Rent *Arrows = Current Qtr Trend 3.9% 894 Units 327 Units $1,476 Vacancy Drops, Despite New Supply A large portion of apartment demand is driven by an expanding economy and employment growth. Despite a slowdown in federal job creation, the Washington regional employment market continues to expand. After a robust first quarter in 2012, second-quarter employment growth continued in the metro area, albeit at a slower pace. The Washington DC region added 12,200 non-farm payroll jobs in the first quarter of this year, and 8,000 jobs in the second. We expect this moderate job growth to continue through the November elections and into 2013. However, the types of jobs being created have changed. Twelve to eighteen months ago the Federal Government and the Professional and Businesses Services sector were the top job producers in the region. At the end of the second DC METRO MULTIFAMILY quarter 2012, the Education and Healthcare sector led employment growth gaining 8,000 payrolls Economic Indicators since the beginning of 2012. The Federal Government downsized by 4,900 payrolls – the equivalent of 1.3% of the regional federal workforce – during the same timeframe. 2Q 2012 2Q 2011 As the regional employment picture generally continues to improve, more people are forming Employment 3.030 M 2.987 M households. More of those households are renting. The homeownership rate in the Washington metro area decreased for a second consecutive quarter, registering 65.8% in the second quarter of Population 5.765 M 5.704 M 2012 after reaching 68.2% in in the fourth quarter of 2011. Based on the total number of households, this decline in homeownership equates to an additional 48,000 households who rent. Median Income $89,170 $86,654 Such increased demand from these additional renters is helping to prop up multifamily fundamentals MF Permits Issued 2,650 2,163 in the region. Net absorption for apartments in the second quarter of this year was 894 units metro- wide – a slight up-tick from that reported in the previous quarter. The number of new apartment MF Starts 1,887 1,199 completions in the second quarter was more than double that of the first quarter. Despite new apartment deliveries, the vacancy rate decreased 0.1 percentage point over the quarter ending at 3.9% metro-wide. Average asking rental rates were $1,476 per month across the region, a 0.9 Absorption, Completions & Vacancy percentage point increase over the quarter. Once again, Northern Virginia boasted the highest rate increase on average, a gain of $16 during the quarter to $1,569. Rents in the District increased $14 10,000 7% to $1,500, while those in suburban Maryland rose $10 during the quarter to $1,359. 9,000 6% 8,000 7,000 5% After a slow start early in the year, multifamily sales picked up steam in the second quarter. For the # of Units 6,000 5,000 4% first half of 2012, $1.4 billion in multifamily sales transactions took place. A majority of these sales 3% 4,000 occurred in the suburbs with $576 million transacting in Northern Virginia and $569 million in 3,000 2% 2,000 1% suburban Maryland since the beginning of the year. The average price per unit was $202,000. The 1,000 0 0% highest dollar transaction in 2012 to date has been Equity Residential’s purchase of 4701 Willard 2007 2008 2009 2010 2011 2012 Avenue in Chevy Chase for $209 million or $393,000 per unit. YTD Net Absorption Completions Vacancy Forecast Source: REIS • Multifamily construction continued to increase in the second quarter of 2012. Multifamily starts were up 57% compared to one year ago while permits were up 23% during the same time frame. Through 2014, an estimated 30,100 multifamily permits will be pulled compared Asking Rents to the 13,800 permits issued from 2009 to 2011. Expect single family construction to make $1,600 a recovery as well with over 40,000 permits being issued through 2014. That is a 77% $1,550 increase compared to the prior three years. $1,500 $1,450 • Net migration to the Washington DC metro area will continue to increase, albeit at a slower $1,400 rate. Moody’s estimates a net 66,300 people migrating to the region through 2014. This $1,350 $1,300 compares to the 140,700 people who migrated to the metro from 2009 to 2011. Therefore, $1,250 multifamily demand will stem more from current residents versus new populace to the region. $1,200 2007 2008 2009 2010 2011 2012 YTD • We expect employment growth to be tempered through the federal elections later this year. DC NoVA Suburban MD This may push some demand for housing from this year into 2013. With large amounts of Source: REIS supply forecast to deliver over the next 12 to 24 months, certain submarkets may see vacancy rates rise in the short term. Still, the Washington Metro continues to boast one of the lowest multifamily vacancy rates in the U.S. www.cassidyturley.com
  • 2. Cassidy Turley Multifamily Market Snapshot DC Metro • Second Quarter • 2012 VACANT OCCUPIED AVERAGE SUBMARKET INVENTORY* COMPLETIONS VACANCY NET ABSORPTION STOCK STOCK ASKING RENT RATE Anacostia/Northeast DC 33,688 - 1,879 31,809 5.6% 64 $1,068 Capitol Hill/Southwest 7,662 - 452 7,210 5.9% 15 $1,548 Downtown/Logan Circle 10,075 - 282 9,793 2.8% 20 $1,780 Dupont Circle/Adams Morgan 11,716 - 199 11,517 1.7% 24 $1,654 Foggy Bottom 5,487 - 274 5,213 5.0% 28 $1,876 Northwest D.C./Georgetown 10,058 - 412 9,646 4.1% 10 $1,762 Woodley Pk./Cleveland Pk./Van Ness 10,162 - 254 9,908 2.5% - $1,983 DISTRICT MARKET TOTALS 88,848 - 3,752 85,096 4.2% 161 $1,500 Columbia Pike/Shirlington/NE Alexandria 19,617 - 803 18,814 4.1% 65 $1,524 Falls Church/Annandale/Skyline 34,116 - 933 33,183 2.7% 68 $1,472 Loudoun County 7,805 - 359 7,446 4.6% 8 $1,480 Old Town 5,169 - 202 4,967 3.9% 25 $1,669 Pentagon City/Crystal City 9,841 - 384 9,457 3.9% 29 $2,211 Prince William County 15,885 - 620 15,265 3.9% 79 $1,187 Rosslyn/Ballston 16,477 46 626 15,851 3.8% 44 $1,901 SE Fairfax County 15,588 - 436 15,152 2.8% 78 $1,477 Tysons Corner/Fairfax City 12,261 - 662 11,599 5.4% 25 $1,666 W Fairfax County 21,582 281 626 20,956 2.9% 145 $1,517 NORTHERN VA MARKET TOTALS 158,341 327 5,651 152,690 3.6% 566 $1,569 Bethesda/Chevy Chase 8,545 - 239 8,306 2.8% 60 $1,989 Gaithersburg/Germantown 16,090 - 434 15,656 2.7% 33 $1,392 Kensington/Wheaton/NE Montgomery 16,741 - 497 16,244 3.0% 2 $1,389 Rockville 10,603 - 615 9,988 5.8% 11 $1,772 Silver Spring 9,649 - 550 9,099 5.7% 19 $1,559 Takoma Park 10,845 - 206 10,639 1.9% 11 $1,249 Central Prince George's County 23,659 - 820 22,839 3.5% 51 $1,179 N Prince George's County 24,503 - 1,328 23,175 5.4% (38) $1,330 S Prince George's County 24,273 - 1,251 23,022 5.2% 18 $1,088 SUBURBAN MD MARKET TOTALS 144,908 - 5,940 138,968 4.1% 167 $1,359 DC METRO TOTAL 392,097 327 15,343 376,754 3.9% 894 $1,476 Sources: REIS, Cassidy Turley *All figures are multifamily units except vacancy rate. Key Sales Transactions 2Q 12 PROPERTY UNITS SELLER/BUYER PRICE PRICE/UNIT 4701 Willard Apartments 532 Irene S. Pollin/Equity Residential $209,325,000 $393,468 Jeffrey Kottmeier Axiom & 909 at Capitol Yards 493 JPI/JPMorgan Asset Management $189,306,000 $383,988 Vice President, Director of Research Villages of Morgan Metro 1242 Hunt Companies/Harbor Group Management $182,000,000 $146,538 2101 L Street, NW Palladium Court 556 LaSalle Investment Management/The Praedium Group & The Milestone Group $125,500,000 $225,719 Suite 700 Washington, DC 20037 Woodway At Trinity Centre 504 CBRE Global Investors/Home Properties, Inc. $96,000,000 $190,476 Tel: 202.463.2100 Fax: 202.223.2989 About Cassidy Turley Jeffrey.Kottmeier@cassidyturley.com Cassidy Turley is a leading commercial real estate services provider with more than 3,600 professionals in more than 60 offices nationwide. The The information contained within this report is company represents a wide range of clients—from small businesses to Fortune 500 companies, from local non-profits to major institutions. The firm gathered from multiple sources considered to be completed transactions valued at $22 billion in 2011, manages 455 million square feet on behalf of institutional, corporate and private clients and reliable. The information may contain errors or supports more than 28,000 domestic corporate services locations. Cassidy Turley serves owners, investors and tenants with a full spectrum of integrated omissions and is presented without any warranty or representations as to its accuracy. commercial real estate services—including capital markets, tenant representation, corporate services, project leasing, property management, project and development services, and research and consulting. Cassidy Turley enhances its global service delivery outside of North America through a Copyright © 2012 Cassidy Turley. partnership with GVA, giving clients access to commercial real estate professionals in 65 international markets. Please visit www.cassidyturley.com for All rights reserved. more information about Cassidy Turley. www.cassidyturley.com