Recommended

Recommended
More Related Content
Similar to 2011 ACT Poster
Similar to 2011 ACT Poster (14)
2011 ACT Poster
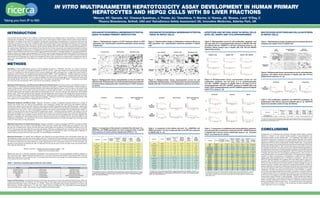
- 1. IN VITRO MULTIPARAMETER HEPATOTOXICITY ASSAY DEVELOPMENT IN HUMAN PRIMARY HEPATOCYTES AND HEPG2 CELLS WITH S9 LIVER FRACTIONS 1 Marcoe, KF; Garside, HJ; Chesnut-Speelman, J; Foster, AJ; Ovechkina, Y; Warrior, U; Kenna, JG; Bowes, J and O’Day, C 2 1 2 1 2 2 1 1 Ricerca Biosciences, Bothell, USA and AstraZeneca Safety Assessment UK, Innovative Medicines, Alderley Park, UK 2 Introduction ROS AND MITOCHONDRIAL MEMBRANE POTENTIAL ASSAY IN HUMAN PRIMARY HEPATOCYTES ROS AND MITOCHONDRIAL MEMBRANE POTENTIAL ASSAY IN HepG2 Cells APOPTOSIS AND MITOSIS ASSAY IN HepG2 CELLS WITH rS9, NADPH AND CYCLOPHOSPHAMIDE Multiplexed apoptosis and cellular stress in HepG2 cells Drug-induced liver injury (DILI) in man is difficult to predict preclinically and a leading cause of drug attrition in clinical trials and post approval withdrawals. Toxicology screening assays which utilize relevant cellular models and biomarkers directly linked to mechanisms of cellular toxicity have the potential to enable early identification and deselection of compounds that have high Figure 1. Representative images of CCCP treatment effects on ROS Figure 3. Representative images of Nefazadone treatment effects on Figure 5. Representative curves for cell proliferation, apoptosis, and Figure 7. Representative images of geldanamycin treatment effects on propensity to cause DILI. In this study, multiplexed high content screening (HCS) with automated fluorescence microscopy and generation and mitochondrial membrane potential in human primary ROS generation and mitochondrial membrane potential in HepG2 cell cycle after 24 hr cyclophosphamide exposure in HepG2 cells with apoptosis and cellular stress in HepG2 cells. image analysis based technology was used to develop and evaluate cellular assays that detect key mechanisms considered hepatocytes. cells. and without rS9 and NADPH in a 48 hour cytotoxicity assay, (n = 2). relevant to DILI. Experiments were conducted in human primary hepatocytes and in HepG2 cells to explore time dependency of the markers tested. Additionally, in some studies S9 liver fractions from Aroclor induced rats were added extracellularly to enhance Cytotoxic effects present only in HepG2 cells with rS9 and NADPH the metabolic capability of HepG2 cells. A multiplexed format was used to evaluate the following parameters using the designated regeneration system. reagents: cell proliferation/cell attachment (nuclear dyes); apoptosis (antibodies to activated caspase-3); cell cycle (antibodies to phospho-Histone-H3); cellular stress (antibodies to HSP70/72); reactive oxygen species (ROS) generation (H2DFFDA staining), and mitochondrial damage (TMRE staining). Our preliminary findings with a variety of hepatotoxic and non-hepatotoxic test compounds demonstrate that this approach is a useful tool to evaluate the ability of test compounds to cause toxicity to isolated liver-derived cells in vitro and indicate that further testing of a broad range of marketed drugs with and without DILI consequence in man is warranted. METHODS Cell Culture Human hepatocellular carcinoma cell line (HepG2) was grown in RPMI1640, 10% FBS, 1% L-Alanyl-L-Glutamine and 1% sodium pyruvate in a humidified atmosphere of 5% CO2 at 37oC. Cells were thawed from working stocks and passed once prior to seeding into 384-well plates. Human primary hepatocytes (HPH, Invitrogen) from a single donor were thawed in Figure 8. Multiparameter Assay, represenative curves for cell proliferation, hepatocyte culture medium with supplements and growth factors (HBM™, HCM™ SingleQuots® LONZA), treated with a percoll apoptosis, and cellular stress induction in HepG2 cells after 48 hour separation step and immediately seeded into 384-well plates in the same media. Within 24 hours of plating these cells, the media was exchanged with fresh media. Prior to compound addition, the media was exchanged again. For all assays test compounds Geldanamycin exposure, (n = 2). were serially diluted 3.16-fold over 10 concentrations with a final assay concentration of 0.5% DMSO. Compounds were added Figure 2. Multiparameter Assay, representative curves for viable live Figure 4. Multiparameter Assay, representative curves for cell Figure 6. Multiparameter Assay, represenative curves for cell 24 or 48 hours post cell seeding in HPHs and 24 hours post seeding in HepG2 cells. attached cells, ROS generation, and mitochondrial membrane potential proliferation, ROS generation , and mitochondrial membrane potential in proliferation, apoptosis, and cell cycle: a) 4 hr cyclophosphamide in human primary hepatocytes after 4 and 24 hours of CCCP exposure HepG2 cells after 4 and 24 hours of Nefazadone exposure are shown. and rS9 + NADPH exposure to HepG2 cells in 48 assay, b) 24 hr Multiplexed ROS Generation and Mitochondrial Membrane Potential Assay Intracellular staining with H2DFFDA (5-(and-6)- cyclophosphamide and rS9 + NADPH exposure to HepG2 cells in 48 are shown. chloromethyl-2’,7’-dichlorodihydrofluorescein diacetate, acetyl ester, Invitrogen), a marker of ROS generation; TMRE (Invitrogen), a marker of mitochondrial membrane potential induction; and Hoescht (Invitrogen) for nuclear count, an index of cell number, were assay, c) 24 hr cyclophosphamide and rS9 + NADPH exposure to HepG2 measured after 4 and 24 hours of test compound incubations in HepG2 cells and HPHs. For optimal well cell coverage at each cells in 72 hr assay, (n = 2). time point HepG2 cells were seeded in 384-well tissue culture plates at 4x10³ and 3x10³ cells per well, respectively, with complete growth media. HPHs were seeded at 30x103 cells per well with hepatocyte culture medium with supplements and growth factors into 384-well Collagen I coated optical plates (BD Biosciences). Plated cells were incubated in a humidified atmosphere of 5% CO2 at 37oC prior to and for the duration of test compound Incubation. Following 4 and 24 hour compound incubation periods, cells were washed and incubated with the multiplexed dyes for 30 minutes. Table 5. Cell proliferation, apoptosis and HSP70/72 parameters for geldanamycin after 48 hour exposure to HepG2 cells, (n = 2). HSP70/72 Multiplexed Apoptosis and Mitosis Assay Caspase-3 activation, a marker of apoptosis, phospho-Histone-H3, a marker of mitosis, and nuclear count, an index of cell proliferation, were measured in HepG2 cells without and with addition of S9 liver signal more sensitive marker of early cell distress. fractions from Aroclor induced rats (rS9, Molecular Toxicology) and NADPH regeneration system (BD Biosciences). HepG2 cells were seeded at 2x10³ cells per well with complete growth medium into 384-well tissue culture plates and incubated in a humidified atmosphere of 5% CO2 at 37oC. Prior to test compound addition the medium was exchanged with complete growth medium or Relative cell medium containing rS9 with and without the NADPH regeneration system. Following compound addition, the medium in the cell count Apoptosis 5X Fold Max Apoptosis HSP70/72 5X Fold Max HSP70/72 Compound Cell line plates was exchanged at 4 or 24 hours with fresh complete growth medium. For experiments with 4 hour compound/rS9 exposure, IC50 Induction Fold Induction Fold (microM) (microM) Induction (microM) Induction the treated cell plates were incubated a total of 48 hours prior to being fixed and immunolabeled with anti-active caspase-3 for 17-(Allylamino)-17- detection of apoptosis and anti-phospho-Histone-H3 for detection of cell cycle and stained with the nuclei dye, DAPI, for cell demethoxygeldanamycin HepG2 0.036 ± 0.002 0.03 ± 0.002 122 ± 46 0.006 ± 0.0005 391 ± 120 proliferation quantification. For experiments with 24 hour compound/rS9 exposure, the treated cell plates were incubated a total The relative cell count IC50 (half maximal inhibitory constant) value measures cell proliferation. Compound concentrations of 48 or 72 hours prior to fixing and staining. are indicative of a 5-fold induction in apoptosis signal and 5-fold induction in HSP70/72 signal over vehicle background. All values are given as the mean ± s.e.m. Multiplexed Apoptosis and Cellular Stress Assay Caspase-3 activation, a marker of apoptosis, HSP70/72, a marker of cellular stress, and nuclear count, an index of cell proliferation, were measured in HepG2 cells. HepG2 cells were seeded at 2x10³ cells per well with complete growth medium into 384-well tissue culture plates and incubated in a humidified atmosphere of 5% CO2 at 37oC. Test compounds were added 24 hours post cell seeding. Following an additional 48 hour incubation, cells were fixed and immunolabeled with anti-active caspase-3 for detection of apoptosis and anti-HSP70/72 (Enzo Life Sciences) for detection of Table 2. A comparison of the percent of attached live cell count IC50, H2DFFDA, and TMRE parameters for each compound after 4 and 24 Table 3. A comparison of the relative cell count IC50, H2DFFDA, and TMRE parameters for each compound after 4 and 24 hours exposure Table 4. A comparison of multiplexed data (cell proliferation, apoptosis, and cell cycle) after 4 and 24 hour compound and rS9 + NADPH exposure Conclusions cellular stress and stained with the nuclei dye, DAPI, for cell proliferation quantification. hours exposure to human primary hepatocytes (HPH), (n = 2). to HepG2 cells, (n = 2). to HepG2 cells in 48 and 72 hour cytotoxicity assay (n = 2). Transient effect was observed on mitosis. Development of a comprehensive predictive toxicology testing platform requires selection of relevant in vitro cellular models capable of drug metabolism and Measured Parameters For HepG2 cells, proliferation was measured by the signal intensity of the incorporated nuclear dye. The Relative Apoptosis Max G2/M cell G2/M cell mechanistic hepatic toxicity assessments. % of attached H2DFFDA Max TMRE Relative cell H2DFFDA Max TMRE Compound / Compound / cell count Assay Relative 5X Fold Apoptosis Apoptosis Max cycle G1/S cell G1/S cell The multiplexed HCS platform with cell proliferation output was referred to as the relative cell count. To determine the cell proliferation end point, the cell proliferation Compound live cells Compound % of attached 3.5X Fold H2DFFDA H2DFFDA Max 0.5X Fold TMRE Compound count Compound Relative cell 3.5X Fold H2DFFDA H2DFFDA Max 0.5X Fold TMRE Compound Cell line r S 9 + N A D P H Assay cell count 5X Fold Apoptosis cycle block cycle (microM) automated fluorescence microscopy and image analysis described here enables Compound Cell line exposure live cells 3.5X Fold H2DFFDA 0.5X Fold Compound Cell line exposure count 3.5X Fold H2DFFDA 0.5X Fold Compound + NAD Duration IC 50 Cell line r S 9 RelativeP H Apoptosis Max Fold Induction G2/M cell block cycle block Compound IC Cell line % of attached 50 H2DFFDA exposure Induction Max Fold TMRE Induction Compound cell IC50 Relative exposure H2DFFDA Induction Induction TMRE Fold Cell line Fold Induction Compound / treatment Duration IC 50 Fold Induction G1/S cell block data output was transformed to percent of control (POC) using the formula shown below. For human primary hepatocytes attached Compound (hours) IC50 Induction Fold Induction Compound (hours) IC50 Max Induction Assay cell count treatment (microM) (microM) Apoptosis 5X Fold Induction cycle (microM) (microM) Compound Cell line exposure (hours) (microM)3.5X Fold live cells (microM) (microM) H2DFFDA Induction0.5X Fold (microM) (microM) Induction (microM) Compound Cell line exposure count (hours) 3.5X Fold (microM) (microM) (microM) H2DFFDA Induction Fold (microM) (microM) 0.5X Induction (microM) Compound Cell line r S 9 + N A D P H Duration IC 50 Induction (microM) Fold (microM) cycle block block Induction (microM) detection of multiple key mechanisms considered relevant to DILI in human primary live cells were measured by the signal defined by nuclear segmentation of the incorporated nuclear dye. The live cell output was IC50 Induction Fold Induction IC50 Induction Fold Induction CCCP treatment HepG2 4hr 48hr 27 ± 5 45 ± 19 29 ± 6 (microM) N/A 72 ± 0.1 (hours) (microM) (microM) Induction (microM) (hours) (microM) (microM) Induction (microM) CCCP HepG2 (microM) 4hr (microM) 48hr Induction 27 ± 5 (microM) 45 ± 19 29 ± 6 N/A hepatocytes (HPH) as well as metabolically modified HepG2 cells. Drug induced 72 ± 0.1 referred to as the percent of attached live cells. To determine the live cell end point, the live cell data output was transformed to CCCP HPH 4 > 250 216 ± 35 4.9 ± 0.8 N/A CCCP HepG2 4 173 ± 7 167 ± 4 4.9 ± 0.2 2.7 ± 1.1 CCCP CCCP HepG2 24hr HepG2 48hr 24hr 52 ± 1 48hr 24 ± 2 52 ± 1 43 ± 11 24 ± 2 N/A 43 ± 11 0.12 ± 0.03 N/A 0.12 ± 0.03 CCCP HPH 4 > 250 216 ± 35 4.9 ± 0.8 N/A CCCP HepG2 4 173 ± 7 167 ± 4 4.9 ± 0.2 2.7 ± 1.1 CCCP HepG2 CCCP CCCP Chlorpromazine CCCP 4hr HepG2 48hr 24hr HepG2 27 ± 5 72hr 24hr 1 45 ±±19 42 10 72hr 44 ± 6 29 ± 19 42 ± 10 N/A± 33 42 72 ±N/A 0.1 44 ± 19 0.12 ± 0.03 42 ± 33 71 N/A ROS and decreased mitochondrial membrane potential were detectable in HPHs and 71 POC using the same formula: Chlorpromazine HPH HPH CCCP 4 HPH 4 > 250 4 100 216 ± > 100 N/A 4.9 ± 0.81.2 ± 0.4 > 35 N/A ± 0.4 ± 22 60.7 CCCP ChlorpromazineHepG2 HepG2 4 4 HepG2 173 ± 7 4 51 ± 2 167 ± 4 29 ± 4.9 ± 0.2 9.9 ± 0.8 ± 1.1 4 2.7 9.9 ± 0.8 N/A HepG2 24hr HepG2 48hr 4hr 52 ± 48hr 24 ±±26 54 43N/A ± 11 N/A 0.4 2± N/A N/A 5 ± 2 HepG2 cells with generation of ROS more pronounced at 4 hours than 24 hours for Chlorpromazine N/A 1.2 60.7 ± 22 Chlorpromazine 51 ± 2 29 ± 4 N/A Chlorpromazine HepG2 4hr 10 CCCP Chlorpromazine HepG2 24hr HepG2 72hr 24hr 42 48hr ± 4448hr12 ± 19