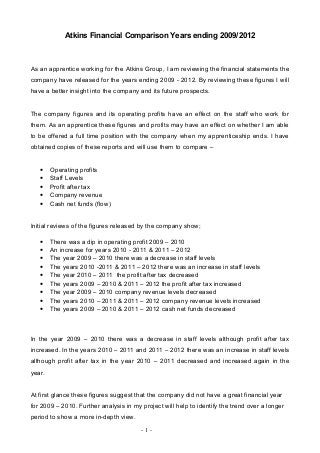
1. Atkins Financial Comparison Years ending 2009/2012
As an apprentice working for the Atkins Group, I am reviewing the financial statements the
company have released for the years ending 2009 - 2012. By reviewing these figures I will
have a better insight into the company and its future prospects.
The company figures and its operating profits have an effect on the staff who work for
them. As an apprentice these figures and profits may have an effect on whether I am able
to be offered a full time position with the company when my apprenticeship ends. I have
obtained copies of these reports and will use them to compare –
• Operating profits
• Staff Levels
• Profit after tax
• Company revenue
• Cash net funds (flow)
Initial reviews of the figures released by the company show;
• There was a dip in operating profit 2009 – 2010
• An increase for years 2010 - 2011 & 2011 – 2012
• The year 2009 – 2010 there was a decrease in staff levels
• The years 2010 -2011 & 2011 – 2012 there was an increase in staff levels
• The year 2010 – 2011 the profit after tax decreased
• The years 2009 – 2010 & 2011 – 2012 the profit after tax increased
• The year 2009 – 2010 company revenue levels decreased
• The years 2010 – 2011 & 2011 – 2012 company revenue levels increased
• The years 2009 – 2010 & 2011 – 2012 cash net funds decreased
In the year 2009 – 2010 there was a decrease in staff levels although profit after tax
increased. In the years 2010 – 2011 and 2011 – 2012 there was an increase in staff levels
although profit after tax in the year 2010 – 2011 decreased and increased again in the
year.
At first glance these figures suggest that the company did not have a great financial year
for 2009 – 2010. Further analysis in my project will help to identify the trend over a longer
period to show a more in-depth view.
- 1 -
2. Financial Year 2009
I have created a graph for the financial year 2009 which shows;
• Operating profit is just over the £103.1 Million mark
• The profit after tax is around £84.2 Million
• Company revenue stands at £1.484.2 Million
• Cash flow funds are at £234.2 Million
- 2 -
Financial Results 2009
£0.0
£200.0
£400.0
£600.0
£800.0
£1,000.0
£1,200.0
£1,400.0
£1,600.0
O
perating
profitProfitaftertax
C
om
pany
revenue
C
ash
flow
Profit and Revenue
Millions
Operating profit
Profit after tax
Company revenue
Cash flow
3. Financial Year 2010
I have created a graph for the financial year 2010 which shows;
• Operating profit is just over the £113 Million mark
• The profit after tax is around £77.3 Million
• Company revenue stands at £1.387.9 Million
• Cash flow funds are at £302.5 Million
- 3 -
Financial Results 2010
£0.0
£200.0
£400.0
£600.0
£800.0
£1,000.0
£1,200.0
£1,400.0
£1,600.0
O
perating
profitProfitaftertax
C
om
pany
revenue
C
ash
flow
Profit and Revenye
Millions
Operating profit
Profit after tax
Company revenue
Cash flow
4. Financial Year 2011
I have created a graph for the financial year 2011 which shows;
• Operating profit is just over the £107 Million mark
• The profit after tax is around £72.6 Million
• Company revenue stands at £1.564.3 Million
• Cash flow funds are at £123.3 Million
- 4 -
Financial Results 2011
£0.0
£200.0
£400.0
£600.0
£800.0
£1,000.0
£1,200.0
£1,400.0
£1,600.0
£1,800.0
2011
Year
RevenueperMillions
Operating profit
Profit after tax
Company revenue
Cash flow
5. Financial Year 2012
Financial Results 2012
£0.0
£200.0
£400.0
£600.0
£800.0
£1,000.0
£1,200.0
£1,400.0
£1,600.0
£1,800.0
Operating
profit
Profit after
tax
Company
revenue
Cash flow
Profit and Revenue
RevenueperMillions
I have created a graph for the financial year 2010 which shows;
• Operating profit is just over the £133.2 Million mark
• The profit after tax is around £106.8 Million
• Company revenue stands at £1.711.1 Million
• Cash flow funds are at £122.6 Million
- 5 -
7. Calculations
Calculations rounded to the nearest Million.
Operating Profit:
2010 - £113m
2011 – £107m
2012 - £133m
Profit after Tax:
2010 - £77m
2011 – £72m
2012 - £107m
Company Revenue:
2010 - £1.388m
2011 – £1.564m
2012 - £1.711m
Cash Flow:
2010 - £302m
2011 – £123m
2012 - £123m
These calculations have been completed by hand. (See scanned work).
- 7 -
Operating Profit
32%
30%
38%
Year 2010
Year 2011
Year 2012
Company Revenue
30%
34%
37%
Year 2010
Year 2011
Year 2012
Cash Flow
55%
22%
22%
Year 2010
Year 2011
Year 2012
Profit after Tax
28%
42%
30% Year 2010
Year 2011
Year 2012
8. Summary
These tables give a quick view of how the Company have performed
financially over the previous years.
2009-2010
Staff Levels Decrease
Operating Profit Decrease
Company Revenue Decrease
Cash Net funds Decrease
Company Profit after Tax Increase
2010-2011
Staff Levels Increase
Operating Profit Increase
Company Revenue Increase
Cash Net funds Increase
Company Profit after Tax Decrease
2011-2012
Staff Levels Increase
Operating Profit Increase
Company Revenue Increase
Cash Net funds Decrease
Company Profit after Tax Increase
- 8 -
9. Summary
(2009-2012) To summarise the company’s financial results, you can see that due to the
challenging financial collimate 2009 was a poor year for Atkins. With decreases in
revenue, operating profit and net funds the company had to make staff redundant. By
making staff redundant the company made a saving on wages which saw an increase in
the company’s profit after tax.
(2010-2011) This was an all round better year for Atkins, having made a profit after tax the
previous year the company then increased its revenue, operating profit and net funds. Due
to these increases, growth was shown by the increased staff levels.
(2011-2012) Although there was a slight decrease in the companies profit after tax the
following year saw further growth. Company’s revenue and operating profit continued to
increase so the company continued to employ. This saw a company profit after tax for the
year financial year. This suggests that after tough times financially in previous years,
Atkins have continued to grow as a business.
Over the previous few years Atkins has been associated with many major domestic and
worldwide infrastructural projects, including the London 2012 Olympic Games. Other Major
Projects overseas include the design of the Bahrain World Trade Centre, New York World
Trade Centre redevelopment and the design of the Almas Tower Dubai. Atkins has
benefited a great deal financially and from the publicity associated with these major
projects. This has had a huge bearing on Atkins growth as a business and becoming one
of the world’s multi disciplinary Design and Engineering Consultancies.
In terms of work and growth Atkins future looks bright. Future and resent work includes
infrastructural work for the Qatar Football World Cup 2022, Glasgow Commonwealth
Games 2014 and joint work with Arup on Cross rail. With the involvement in these major
global projects Atkins will hope to gain more work in these regions, this will increase
company workload with the prospect of further employment for those with the right design
skills.
- 9 -