Assessing the costs of public higher education in the commonwealth of virginia part 2
•
1 like•238 views

Part 2 in a series of whitepaper research examining the costs of Public Higher Education in the Commonwealth of Virginia; data collection shows that more students from lower income have increased in enrollment at a time when college costs have been increasing at a rate greater than affordability.Increases in cost have disproportionately impacted lower income families as a proportional share of reported income.

Recommended
Recommended
More Related Content
What's hot
What's hot (20)
Viewers also liked
Viewers also liked (20)
Similar to Assessing the costs of public higher education in the commonwealth of virginia part 2
Similar to Assessing the costs of public higher education in the commonwealth of virginia part 2 (20)
More from Robert M. Davis, MPA
More from Robert M. Davis, MPA (20)
Recently uploaded
Recently uploaded (20)
Assessing the costs of public higher education in the commonwealth of virginia part 2
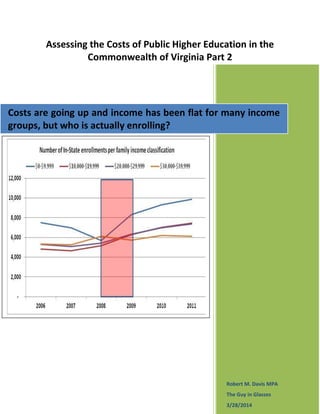
- 1. Assessing the Costs of Public Higher Education in the Commonwealth of Virginia Part 2 Robert M. Davis MPA The Guy in Glasses 3/28/2014 Costs are going up and income has been flat for many income groups, but who is actually enrolling?
- 2. Assessing the costs of Public Higher Education in the Commonwealth of Virginia Part 2: Costs are going up; income has been flat for many income groups but who is actually enrolling? To briefly summarize the argument so far: Presented research has shown that increasing costs to attend public higher education reduces access and affordability by individuals and families; evidence presented in part 11 shows that increasing costs of attendance affects everyone, the data identified that lower income groups (groups who’s reported annual income falls below the reported median annual income) have experienced a disproportional impact as a result of their reported income earnings remaining relatively stagnant or experienced a decrease over the course of the 2006-2012 year period. Lower income groups are unable to match the increases in costs. The question then becomes what proportion of the total in-state enrollment among public higher education institutions are actually from these identified lower income groups? Who is enrolling in Virginia’s public higher education market? The greatest increases in enrollment have occurred among the lowest income groups. Between years 2006-2011, those income groups which fall below the median household income threshold not only make up the majority share of the total enrollment, but also account for the greatest percentage increase in terms of change in enrollment at Virginia’s higher education institutions. Moreover, enrollments among Virginia’s colleges and universities, those income groups classified as below the median household income make up more than 50% of the total population of enrollments (SCHEV, 2013c, emphasis added). Figure 1: Illustrates the in-state enrollment as broken down into those income classifications which fall below the median household income average (SCHEV, 2013c). Calculations performed by the author2 . 1 Part 1 of this research can be accessed here http://lnkd.in/dXeW7Xt 2 Red shaded box indicates period of economic recession
- 3. The data illustrated in Figure 3 shows that lower income groups are enrolling in greater numbers to attend public higher education institutions. These enrollments are occurring at a time when costs of attendance are increasing and when household earnings have remained flat or decreased3 throughout the six year period. Importantly, the proportional share of income that is accounted for in terms of mandatory costs reflects that those income groups that are among the lower quintile classifications are disproportionally affected by changes in costs. As Figure 2 illustrates, all income classification groups by quintile are being affected by rising mandatory costs of attendance. However, a close examination of the third column of Figure 2 shows that low income residents are paying substantially higher percentages of their income relative to the cost of attendance (SCHEV, 2013c). Mean Household Income of Lowest Quintile-Virginia Mandatory Cost of Attendance (Average) % Share of Income Relative to Cost of Attendance 2006 13,458$ 6,631$ 49% 2007 14,037$ 7,083$ 50% 2008 14,348$ 7,582$ 53% 2009 13,956$ 7,984$ 57% 2010 13,916$ 8,630$ 62% 2011 13,913$ 9,334$ 67% Mean Household Income of Second Quintile-Virginia Mandatory Cost of Attendance (Average) % Share of Income Relative to Cost of Attendance 2006 34,797$ 6,631$ 19% 2007 36,412$ 7,083$ 19% 2008 37,405$ 7,582$ 20% 2009 36,536$ 7,984$ 22% 2010 36,344$ 8,630$ 24% 2011 36,996$ 9,334$ 25% Mean Household Income of Third Quintile-Virginia Mandatory Cost of Attendance (Average) % Share of Income Relative to Cost of Attendance 2006 56,550$ 6,631$ 12% 2007 59,645$ 7,083$ 12% 2008 61,570$ 7,582$ 12% 2009 59,840$ 7,984$ 13% 2010 60,662$ 8,630$ 14% 2011 62,262$ 9,334$ 15% Figure 2: This figure illustrates the mean household income per designated quintile classification in comparison to the proportion that mandatory costs at Virginia’s higher education institutions comprise of that quintile’s income (U.S. Census Bureau, 2013b; SCHEV, 2006- 2012). Calculations performed by author. 3 Refer to part 1 of this research for clarification
- 4. More specifically, Figure 2 shows that when costs of attendance rise, it seems to have a more significant impact on those lower income classified groups than those income groups at the higher levels. Costs equate for more than 60% among the lowest quintile’s income; for the second quintile group those costs account for more than 20% of household income reported in year 2011. Each quintile group has experienced a larger proportional share of their income being accounted for when examining costs of attendance each annual year (U.S. Census Bureau, 2013b; SCHEV, 2006-2012). Lower income groups are experiencing a greater share of the cost burden. Costs are increasing, more lower income individuals are enrolling in public higher education, lower income earnings are stagnate and costs are increasingly taking up a larger proportional share of earned income among those lower income quintile groups. Rising costs of college has attracted national attention President Barack Obama and Republican Senator Mike Enzi (R-Wyo) and Democrat Senator Tom Harkin (D-Iowa) commented that increasing costs of attending public higher education is an issue that merits attention. The examination of the Commonwealth of Virginia served as a case model to show that costs are indeed increasing and increasing at a significant rate. In addition detailing cost trends, it was also identified that these increase in costs are leading individuals being unable to afford public higher education. Some recent findings by the Pew Research Center help make this point. The Pew survey examined individual concerns regarding the cost pressures placed on students and families by increasing costs of higher education (Pew Research Center, 2011).The conclusion of the Pew Research (2011) reinforced statements made by Senators and the President, confirming that there is growing public concern about the affordability of public higher education. The opinion of the general public is that “an equal share of the public would prefer that the bulk of the cost of a college education be borne by the federal government, state governments, private endowments or some combination” (Pew Research Center, 2012 para.13). Despite the public desire to have the costs of attendance associated with higher education to be covered or paid for by the government, the reality is quite different. The reality represents that individuals have taken on the majority share of the cost burden associated in public higher education. As a result, these increases in costs have impacted low income groups in their ability to afford public higher education.4 Low income groups are disproportionally affected by the increasing costs associated with tuition and fees (e.g., mandatory costs of attendance). Income groups which fall below the reported median household income, at least in Virginia, have seen their proportional share of earned income going to mandatory costs at public higher education institutions. This supports the observation that there are perceived threats to public higher education affordability that has manifested as a result of a cost shift, as in who pays the majority share to attend public higher education?5 4 Responses measured showed that while the majority of those surveyed saw college as a solid investment for their future -86%, 57% and 75% of respondents stated that higher education does not provide the best value for the money spent i.e. they feel they do not get what they pay for and that college is becoming a luxury that only a few can afford (Pew Research Center, 2011). 5 Harvard University researcher Thomas Kane conducted a study examining the impact of costs on “students from low income families” (Oliff et al, 2013 pg 14) in 1995 that revealed that those state’s which had the largest increases in mandatory costs of attendance among its colleges and universities led to “wider gaps between high
- 5. *Continued in the next segment released6 Part 3: The cost shift in Virginia’s public higher education References State Council of Higher Education for Virginia (SCHEV). (2013c). SCHEV research: Va resident undergraduates with need, various demographic distributions [Data File]. Retrieved http://research.SCHEV.edu/fair/fa1_report.asp State Council of Higher Education for Virginia (SCHEV), (2006-2012).Tuition and fees at virginia's state-supported colleges and universitiys. Richmond,VA: The Commonwealth of Virginia. http://www.schev.edu/reports/reportsindex.asp United States Census Bureau. (2013b). American community survey: Mean household income of quintiles Virginia; years 2006-2011 [Data File]. Retrieved from http://factfinder2.census.gov Pew Research Center. (2011, May 15). Is college worth it?:college presidents, public assess, value, quality and mission of higher education. Retrieved from http://www.pewsocialtrends.org/2011/05/15/is-college-worth-it/ Olif, P., Palacios, V., Johnson, I., & Leachman, M. (2013). Recent deep state higher education cuts may harm students and the economy for years to come. Washington, DC: Center on Budget and Policy Priorities. Kane, K. J. (1995). Rising public college tuition and college entry: How well do public subsidies promote access to college? Cambridge, MA: National Bureau of Economic Research. and low income youth” (Kane, 1995 pg 25) in the 1980’s and early 1990’s. The author’s research correlates with these findings as costs increases impact lower income socioeconomic classification of groups disproportionally. Evidence provided by Georgetown University scholar Anthony Carnavale in 2008 concluded that increasing costs of attendance among public higher education institutions led to widening the gaps between low income students and high income student’s i.e. socioeconomic group classifications (Carnavale, 2008 pg 57). “Just 9 percent of students from the poorest families complete a degree -- meaning less than a third who ever enroll make it to commencement. By comparison, 54 percent of the most wealthy students earn a diploma, meaning they have about a two-thirds success rate” (Weissmann, 2013 para 4). 6 Full body of research can be read, reviewed and accessed here: http://vtechworks.lib.vt.edu/handle/10919/23281