HWBOT Infographic: Overclocking in 2014
•
0 likes•419 views

In this infographic we have a look at what overclocking action went on at HWBOT during 2014.

Recommended
Recommended
More Related Content
Viewers also liked
Viewers also liked (10)
More from HWBOT
More from HWBOT (14)
Recently uploaded
Recently uploaded (20)
HWBOT Infographic: Overclocking in 2014
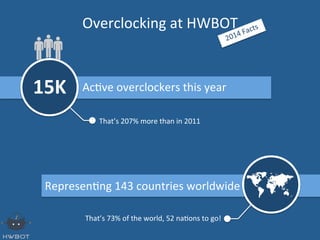
- 1. Ac#ve overclockers this year Represen#ng 143 countries worldwide That’s 73% of the world, 52 na#ons to go! That’s 207% more than in 2011 Overclocking at HWBOT 15K
- 2. Overclocking at HWBOT 242K score submissions That’s about 15 submission per user XTU is the most used benchmark 93K submissions Las#ng 30 seconds, that’s over 32 days spent running it
- 3. Ac#ve overclocking teams Competed in this year’s team cup 59 Teams Overclock.net is the most ac#ve with over 7600 submissions Overclocking at HWBOT 441 SubmiSng a total of 1,700 results
- 4. Most viewed result submiUed in 2014 Most viewed result of 2014 11K views Overclocking at HWBOT 11K views 8 Pack’s 40052 mark 3DMark Fire Strike score
- 5. Overclocking Compe##ons 97 That’s twice more than last year USD $82,250 cash prize $$$ Largest OC cash prize ever! Accoun#ng for 18,000 results Engaging 3,700 overclockers (+285%) Overclocking at HWBOT
- 6. Unique pieces of hardware used 8.5 Thousand 990 GPUs 2925 Motherboards 1857 CPUs 543 PSUs Overclocking at HWBOT
- 7. Overclocking Live Streams Hours of overclocking watched 37+ Thousand Or 1,541 consecu#ve days, or 4.2 Years... Unique streaming session 448 Thousand Tuning in for one of 20 unique stream events