1. INSTRUMENTATION SOFTWARE
STS-DMS Version 2.02
Your total solution for instrumentation
database
Database Management System
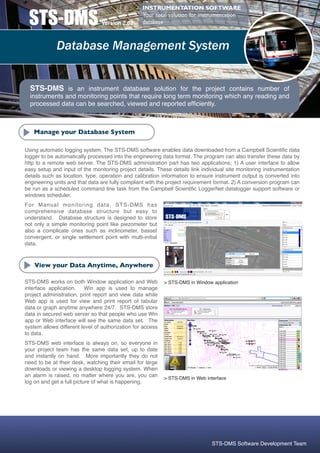
STS-DMS is an instrument database solution for the project contains number of
instruments and monitoring points that require long term monitoring which any reading and
processed data can be searched, viewed and reported efficiently.
Manage your Database System
Using automatic logging system, The STS-DMS software enables data downloaded from a Campbell Scientific data
logger to be automatically processed into the engineering data format. The program can also transfer these data by
http to a remote web server. The STS-DMS administration part has two applications; 1) A user interface to allow
easy setup and input of the monitoring project details. These details link individual site monitoring instrumentation
details such as location, type, operation and calibration information to ensure instrument output is converted into
engineering units and that data are fully compliant with the project requirement format. 2) A conversion program can
be run as a scheduled command line task from the Campbell Scientific LoggerNet datalogger support software or
windows scheduler.
For Manual monitoring data, STS-DMS has
comprehensive database structure but easy to
understand. Database structure is designed to store
not only a simple monitoring point like piezometer but
also a complicate ones such as inclinometer, basset
convergent, or single settlement point with multi-initial
data.
View your Data Anytime, Anywhere
STS-DMS works on both Window application and Web > STS-DMS in Window application
interface application. Win app is used to manage
project administration, print report and view data while
Web app is used for view and print report of tabular
data or graph anytime anywhere 24/7. STS-DMS store
data in secured web server so that people who use Win
app or Web interface will see the same data set. The
system allows different level of authorization for access
to data.
STS-DMS web interface is always on, so everyone in
your project team has the same data set, up to date
and instantly on hand. More importantly they do not
need to be at their desk, watching their email for large
downloads or viewing a desktop logging system. When
an alarm is raised, no matter where you are, you can > STS-DMS in Web interface
log on and get a full picture of what is happening.
STS-DMS Software Development Team
2. DATA AND GRAPHS ARE AVAILABLE ANYWHERE
THERE IS AN INTERNET CONNECTION
Integrate your Project Team and Clients
STS-DMS web interface gives everyone the power of the PC based system from every machine connected to the
Internet. So now your clients and project team can view and analyze yesterdayʼs, last weekʼs or last yearʼs
readings using a simple web browser. Web blog module in STS-DMS allow parties in the project to communicate
to each other thru the blog or post message to others.
Control and Monitor User Access
You have direct control over who can see your
projects and access your data. Each user can have
multiple access rights to each project, from read-
only to full project administration. You can also
monitor when users log in to your projects and how
frequently they view the data.
> Instrument picture can be stored
> User management interface
Report your Data
STS-DMS has a complete set of integrated
> Warning Occurrence Summary
graphing and filtering tools. Youʼll find the graphics
intuitive and flexible, offering a degree of versatility.
To help you visualize your data in relation to their
surroundings STS-DMS even allows you to view
monitoring locations and present your data directly
on your site plans or engineering drawings. Data
can be easily exported into excel table.
STS-DMS batch report module is a very useful tool
for instrument engineer to produce weekly or
monthly report for the project. With few steps, table
and graph or summary report of instruments in the
project can be printed out in desired format.
> Report print preview for group of selected instruments
STS-DMS Software Development Team
3. RESULT ARE FAST, RELIABLE, AND IMMEDIATELY
AVAILABLE
Watch and Warning in Real-time
When it comes to watching for signs of critical readings
or missing data there is nothing like real-time
monitoring to engender confidence and enable a timely
and appropriate response to emergencies. Having just
the information you need at your fingertips can save
many wasted man-hours attending false alarms or
telemetry hiccups. The status of alarms and triggers is
displayed as soon as you log into a project, giving you
an instant visual indication of whether anything
unexpected is happening. In order to draw your
attention to such events STS-DMS will also send an
email to all key personnel to notify them of these
unexpected events as they happen.
Multi-warning level can be set. STS-DMS allow users
to set unlimited warning level. For default setting > Color circle represent warning status, Red - Action, Orange - Alarm
Green - Normal
warning level is set to 3 level Alert, Alarm and Action
Record Site Events Area selection tools
Record Site Events that may affect your Readings
Understanding how on site events may affect your
monitoring values is important and so STS-DMS has a
complete journal system to allow you to record the
events that may have caused the changes in your data.
Construction activities data can be added to see site
progress or movement against instrument reading data.
> Select area of interest by Area selection tools
> Event note can be added in trend plot view. Input event will be
stored in database
> View graph data table of instruments in selected area
STS-DMS Software Development Team
4. TRUSTED BY SEVERAL MRT PROJECTS
Software Advanced Feature Instruments support by STS-DMS
✓ Instruments layout shown on construction
Instrument Type Auto Manual
drawing background
✓ The chart presentations are customizable e.g. Ground Surface Settlement x
scale, reading, interval
✓ 24 Hour real time monitor through Internet Building Settlement x
✓ Automatically sent warning message via SMS or
Email Magnet Extensometer x
✓ Add on real-time on site CCTV display is also
Piezometer x x
available
✓ Construction activities associated with each Probe Inclinometer x
instrument section can be recorded
✓ Other related information can be stored such as Tilt Meter x x
instrument picture, calibration certificate,
installation report (Multi) Rod Extensometer x x
✓ Group of instruments can be created to be
followed up or to see section profile plot Total Pressure Cell x x
✓ Flexible area selection tools are available Concrete Strain Gauge x x
Basset Convergence x x
Crack meter x
WHY STS-DMS?
Software designed to support Web interface is available for data
geotechnical engineer sharing in project network
Customizable software feature and Full support from STS-DMS
report form development team based in Bangkok
Save time and manpower resource STS-DMS is affordable
used to produce project monthly report
Contact us:
STS-DMS Software Development Team
Khun Unnop Tiyajamorn
+66 2618 4288 ext 401
email: unnop@sts.co.th
STS-DMS Software Development Team