Vl mrk
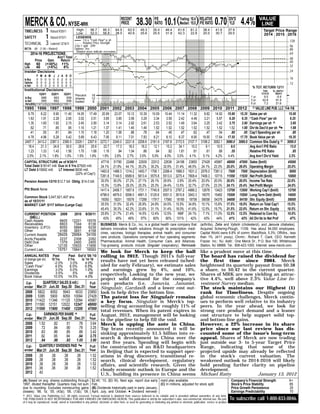
- 1. MERCK & CO. NYSE-MRK RECENT
PRICE 38.30 P/E 10.1(Trailing: 10.4) RELATIVE 0.70 DIV’D 4.4%
RATIO Median: 15.0 P/E RATIO YLD
VALUE
LINE
TIMELINESS 1 Raised 9/30/11 High:
Low:
96.7
52.0
95.3
56.8
64.5
38.5
63.5
40.6
49.3
25.6
35.4
25.5
46.4
31.8
61.6
42.3
61.2
22.8
38.4
20.0
41.6
30.7
37.9
29.5
Target Price Range
2014 2015 2016
SAFETY 1 Raised 4/15/11 LEGENDS
7.0 x ″Cash Flow″ p sh 128
TECHNICAL 3 Lowered 12/16/11 . . . . Relative Price Strength
2-for-1 split 2/99 96
BETA .80 (1.00 = Market) Options: Yes 80
Shaded areas indicate recessions
2014-16 PROJECTIONS 64
Ann’l Total 48
Price Gain Return 40
High 50 (+30%) 11%
Low 40 (+5%) 6% 32
Insider Decisions 24
F M A M J J A S O
to Buy 0 0 0 0 0 0 2 0 0 16
Options 0 0 0 2 0 0 0 0 0 12
to Sell 0 0 0 2 0 0 0 0 0
% TOT. RETURN 12/11
Institutional Decisions THIS VL ARITH.*
1Q2011 2Q2011 3Q2011 STOCK INDEX
Percent 18 1 yr. 9.5 -5.9
to Buy 588 563 558 shares 12
to Sell 595 562 556 3 yr. 42.8 91.9
traded 6
Hld’s(000)219733522356982215611 5 yr. 7.2 21.6
1995 1996 1997 1998 1999 2000 2001 2002 2003 2004 2005 2006 2007 2008 2009 2010 2011 2012 © VALUE LINE PUB. LLC 14-16
6.79 8.22 9.90 11.40 14.05 17.49 20.99 23.07 10.12 10.39 10.09 10.44 11.14 11.32 8.82 14.92 15.60 15.35 Sales per sh 15.00
1.63 1.91 2.28 2.65 3.02 3.51 3.85 3.85 3.56 3.29 3.34 3.59 2.42 4.48 3.21 5.87 6.20 6.35 ‘‘Cash Flow’’ per sh 6.25
1.35 1.60 1.92 2.15 2.45 2.90 3.14 3.14 2.92 2.61 2.53 2.52 1.49 3.64 3.25 3.42 3.75 3.90 Earnings per sh A 3.60
.62 .71 .85 .95 1.10 1.21 1.37 1.41 1.45 1.49 1.52 1.52 1.52 1.52 1.52 1.52 1.52 1.68 Div’ds Decl’d per sh B■ 1.68
.41 .50 .61 .84 1.10 1.18 1.20 1.06 .86 .78 .64 .45 .47 .62 .47 .54 .60 .65 Cap’l Spending per sh .80
4.78 4.96 5.28 5.42 5.69 6.43 7.06 8.11 7.01 7.83 8.21 8.10 8.37 8.90 19.00 17.64 17.55 17.70 Book Value per sh 19.35
2457.7 2413.2 2387.3 2360.5 2329.1 2307.6 2272.7 2245.0 2221.8 2208.6 2181.9 2167.8 2172.5 2107.7 3108.2 3082.1 3080.0 3060.0 Common Shs Outst’g C 3000.0
18.4 21.3 24.8 30.0 29.8 25.6 22.7 17.3 18.2 16.2 12.1 15.2 34.1 10.2 9.1 10.5 9.0 Avg Ann’l P/E Ratio 13.0
1.23 1.33 1.43 1.56 1.70 1.66 1.16 .94 1.04 .86 .64 .82 1.81 .61 .61 .68 .55 Relative P/E Ratio .85
2.5% 2.1% 1.8% 1.5% 1.5% 1.6% 1.9% 2.6% 2.7% 3.5% 5.0% 4.0% 3.0% 4.1% 5.1% 4.2% 4.4% Avg Ann’l Div’d Yield 3.3%
CAPITAL STRUCTURE as of 9/30/11 47716 51790 22486 22939 22012 22636 24198 23850 27428 45987 48000 47000 Sales ($mill) 45000
Total Debt $18147 mill. Due in 5 Yrs $7920 mill. 24.1% 21.9% 44.1% 35.2% 35.2% 32.9% 31.4% 48.5% 24.1% 23.3% 25.0% 26.0% Operating Margin 25.0%
LT Debt $15692 mill. LT Interest $930 mill. 1463.8 1488.3 1314.2 1450.7 1708.1 2268.4 1988.0 1631.2 2576.0 7381.0 7500 7500 Depreciation ($mill) 8000
(22% of Cap’l)
7281.8 7149.5 6589.6 5813.4 5575.8 5513.0 3275.4 7808.4 7409.3 10715 11550 11930 Net Profit ($mill) 10800
Pension Assets-12/10 $12.7 bill. Oblig. $14.0 bill. 30.0% 30.0% 27.2% 27.1% 29.1% 29.9% 2.8% 20.4% 20.0% 20.0% 20.0% 20.0% Income Tax Rate 22.0%
15.3% 13.8% 29.3% 25.3% 25.3% 24.4% 13.5% 32.7% 27.0% 23.3% 24.1% 25.4% Net Profit Margin 24.0%
Pfd Stock None 1417.4 2458.7 1957.6 1731.1 7745.8 2507.5 2787.2 4986.2 12678 13423 13700 13500 Working Cap’l ($mill) 12700
4798.6 4879.0 5096.0 4691.5 5125.6 5551.0 3915.8 3943.3 16075 15482 15500 15500 Long-Term Debt ($mill) 14000
Common Stock 3,047,921,407 shs.
as of 10/31/11 16050 18201 15576 17288 17917 17560 18185 18758 59058 54376 54000 54150 Shr. Equity ($mill) 58000
MARKET CAP: $117 billion (Large Cap) 35.5% 31.5% 32.4% 26.9% 24.9% 24.5% 15.5% 34.8% 10.1% 15.8% 17.5% 18.0% Return on Total Cap’l 15.5%
45.4% 39.3% 42.3% 33.6% 31.1% 31.4% 18.0% 41.6% 12.5% 19.7% 21.5% 22.0% Return on Shr. Equity 18.5%
CURRENT POSITION 2009 2010 9/30/11 25.8% 21.7% 21.4% 14.5% 12.4% 12.5% NMF 24.1% 7.1% 11.0% 12.5% 12.5% Retained to Com Eq 10.0%
($MILL.) 43% 45% 49% 57% 60% 60% 101% 42% 43% 44% 41% 43% All Div’ds to Net Prof 47%
Cash Assets 9605 12201 15576
Receivables 6603 7344 8136 BUSINESS: Merck & Co., Inc. is a global health care company that (arthritis), Zetia and Vytorin (cholesterol), and Januvia (diabetes).
Inventory (LIFO) 8055 5868 6239 delivers innovative health solutions through its prescription medi- Acquired Schering-Plough, 11/09. Has about 94,000 employees.
Other 4166 3651 4158
cines, vaccines, biologic therapies, animal health, and consumer Capital World owns 6.8% of comm; BlackRock, 5.3%; Off/dirs., less
Current Assets 28429 29064 34109
care products. Operations comprised of four operating segments: than 1%. (4/11 proxy). Chrmn.: Richard T. Clark; CEO: Kenneth
Accts Payable 2237 2308 2282
Debt Due 1379 2400 2455 Pharmaceutical, Animal Health, Consumer Care, and Alliances. Frazier. Inc.: NJ. Addr.: One Merck Dr., P.O. Box 100, Whitehouse
Other 12135 10933 11856 Top-grossing products include Singulair (respiratory), Remicade Station, NJ 08889. Tel.: 908-423-1000. Internet: www.merck.com.
Current Liab. 15751 15641 16593
We look for Merck to keep the ball like a prudent move at this time.
ANNUAL RATES Past Past Est’d ’08-’10 rolling in 2012. Though 2011’s full-year The board has raised the dividend for
of change (per sh) 10 Yrs. 5 Yrs. to ’14-’16 results have not yet been released (sched- the first time since 2004. Merck
Sales -2.0% 3.0% 4.0%
‘‘Cash Flow’’ 4.0% 6.0% 5.5% uled for early February), we estimate sales heightened its quarterly payout from $0.38
Earnings 3.0% 5.0% 1.0% and earnings grew by 4%, and 10%, a share, to $0.42 in the current quarter.
Dividends 3.5% .5% Nil respectively. Looking to the new year, we Shares of MRK are now yielding an attrac-
Book Value 10.0% 14.5% 4.0%
project solid demand for the company’s tive 4.4%, well above 2.3% Value Line In-
Cal- QUARTERLY SALES ($ mill.) Full core products (i.e, Januvia, Janumet, vestment Survey median.
endar Mar.31 Jun.30 Sep.30 Dec.31 Year Singulair, Gardasil) and a lower cost out- The stock maintains our Highest (1)
2008 5822 6052 5943 6033 23850 look to help drive the bottom line. rank for Timeliness. Despite ongoing
2009 5385 5900 6050 10094 27428 The patent loss for Singulair remains global economic challenges, Merck contin-
2010 11422 11346 11125 12094 45987 a key focus. Singulair is Merck’s top- ues to perform well relative to its industry
2011 11580 12151 12022 12247 48000 selling drug accounting for roughly 11% of peers. In the year ahead, we look for
2012 11500 11900 11400 12200 47000 total revenues. When its patent expires in strong core product demand and a leaner
Cal- EARNINGS PER SHARE A Full August, 2012, management will be looking cost structure to help support solid top-
endar Mar.31 Jun.30 Sep.30 Dec.31 Year to the pipeline to help fill the void. and bottom-line gains.
2008 1.52 .82 .51 .78 3.64 Merck is upping the ante in China. However, a 22% increase in its share
2009 .72 .84 .90 .79 3.25 Top brass recently announced it will be price since our last review has dis-
2010 .83 .86 .85 .88 3.42 sinking approximately $1.5 billion into re- counted some of the issue’s long-term
2011 .92 .95 .94 .94 3.75 search & development in China over the appeal. Shares of Merck are now trading
2012 .94 .98 .93 1.05 3.90
next five years. Spending will begin with just outside our 3- to 5-year Target Price
Cal- QUARTERLY DIVIDENDS PAID B■ Full the construction of an R&D headquarters Range, indicating that some of the
endar Mar.31 Jun.30 Sep.30 Dec.31 Year in Beijing that is expected to support oper- projected upside may already be reflected
2008 .38 .38 .38 .38 1.52 ations in drug discovery, transitional re- in the stock’s current valuation. The
2009 .38 .38 .38 .38 1.52 search, clinical development, regulatory weakened outlook to 2014-2016 will likely
2010 .38 .38 .38 .38 1.52 affairs, and scientific research. Given the hold pending further clarity on pipeline
2011 .38 .38 .38 .38 1.52 cloudy economic outlook in Europe and the development.
2012 .42 U.S., building its presence in China seems Michael Ratty January 13, 2012
(A) Based on avg. shares outstanding through $2.40; ’10, ($3.16). Next egs. report due early ment plan available. Company’s Financial Strength A+
1997, diluted thereafter. Quarters may not sum Feb. (C) In millions, adjusted for stock split. Stock’s Price Stability 85
due to rounding. Excludes nonrecurring gains (B) Dividends historically paid in early January, Price Growth Persistence 25
(losses): ’98, 1¢; ’05, (43¢); ’06, (13¢); ’09, April, July, and October. ■ Dividend reinvest- Earnings Predictability 70
© 2012, Value Line Publishing LLC. All rights reserved. Factual material is obtained from sources believed to be reliable and is provided without warranties of any kind.
THE PUBLISHER IS NOT RESPONSIBLE FOR ANY ERRORS OR OMISSIONS HEREIN. This publication is strictly for subscriber’s own, non-commercial, internal use. No part To subscribe call 1-800-833-0046.
of it may be reproduced, resold, stored or transmitted in any printed, electronic or other form, or used for generating or marketing any printed or electronic publication, service or product.