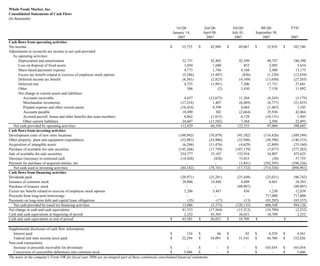
1. Whole Foods Market, Inc.
Consolidated Statements of Cash Flows
(In thousands)
1st Qtr 2nd Qtr 3rd Qtr 4th Qtr YTD
January 14, April 08, July 01, September 30,
2007 2007 2007 2007 2007
Cash flows from operating activities
Net income $ 53,755 $ 45,989 $ 49,067 $ 33,929 $ 182,740
Adjustments to reconcile net income to net cash provided
by operating activities:
Depreciation and amortization 52,731 42,403 42,509 48,747 186,390
Loss on disposal of fixed assets 1,030 1,680 852 2,092 5,654
Share-based payments expense 4,773 1,746 4,168 2,488 13,175
Excess tax benefit related to exercise of employee stock options (5,286) (5,487) (836) (1,230) (12,839)
Deferred income tax benefit (6,561) (2,823) (4,169) (13,650) (27,203)
Deferred rent 4,735 (1,991) 7,206 17,731 27,681
Other 506 (2) 3,430 7,158 11,092
Net change in current assets and liabilities:
Accounts receivable 4,457 (12,675) 11,284 (8,245) (5,179)
Merchandise inventories (37,216) 1,407 (6,469) (8,777) (51,055)
Prepaid expense and other current assets (10,454) 8,598 4,684 (1,483) 1,345
Accounts payable 18,490 302 (2,664) 25,936 42,064
Accrued payroll, bonus and other benefits due team members 6,862 (1,015) 6,129 (10,131) 1,845
Other current liabilities 24,607 (11,582) 7,364 2,504 22,893
Net cash provided by operating activities 112,429 66,550 122,555 97,069 398,603
Cash flows from investing activities
Development costs of new store locations (100,942) (76,879) (95,102) (116,426) (389,349)
Other property, plant and equipment expenditures (52,083) (24,906) (32,948) (30,396) (140,333)
Acquisition of intangible assets (6,246) (11,476) (4,629) (2,809) (25,160)
Purchase of available-for-sale securities (145,268) (17,759) (107,179) (7,077) (277,283)
Sale of available-for-sale securities 234,777 53,107 152,934 34,807 475,625
Decrease (increase) in restricted cash (14,420) (828) 73,033 (30) 57,755
Payment for purchase of acquired entities, net - - (3,841) (592,395) (596,236)
Net cash used in investing activities (84,182) (78,741) (17,732) (714,326) (894,981)
Cash flows from financing activities
Dividends paid (20,971) (25,291) (25,449) (25,031) (96,742)
Issuance of common stock 28,806 14,448 4,488 6,641 54,383
Purchase of treasury stock - - (99,997) - (99,997)
Excess tax benefit related to exercise of employee stock options 5,286 5,487 836 1,230 12,839
Proceeds from long-term borrowings - - - 717,000 717,000
Payments on long-term debt and capital lease obligations (35) (17) (13) (93,292) (93,357)
Net cash provided by (used in) financing activities 13,086 (5,373) (120,135) 606,548 494,126
Net change in cash and cash equivalents 41,333 (17,564) (15,312) (10,709) (2,252)
Cash and cash equivalents at beginning of period 2,252 43,585 26,021 10,709 2,252
Cash and cash equivalents at end of period $ 43,585 $ 26,021 $ 10,709 $ - $ -
Supplemental disclosure of cash flow information:
Interest paid $ 124 $ 66 $ 42 $ 4,329 $ 4,561
Federal and state income taxes paid $ 22,294 $ 54,091 $ 31,541 $ 44,700 $ 152,626
Non-cash transactions:
Increase in proceeds receivable for divestiture $ - $ - $ - $ 165,054 $ 165,054
Conversion of convertible debentures into common stock $ 5,686 $ - $ - $ - $ 5,686
The notes in the company's Form 10K for fiscal year 2006 are an integral part of these condensed consolidated financial statements.