4. SLM CORPORATION
Segment and “Core Earnings”
Consolidated Statements of Income
(In thousands)
Quarter ended March 31, 2008
Asset
Performance Corporate Total ‘‘Core Total
Lending Group and Other Earnings” Adjustments GAAP
(unaudited)
Interest income:
FFELP Stafford and Other
Student Loans . . . . . . . . . . . . $ 494,382 $ — $ — $ 494,382 $ (29,906) $ 464,476
FFELP Consolidation Loans . . . . 988,486 — — 988,486 (151,830) 836,656
Private Education Loans . . . . . . . 749,321 — — 749,321 (305,799) 443,522
Other loans . . . . . . . . . . . . . . . . 23,344 — — 23,344 — 23,344
Cash and investments . . . . . . . . . 141,902 — 6,267 148,169 (24,353) 123,816
Total interest income . . . . . . . . . . . 2,397,435 — 6,267 2,403,702 (511,888) 1,891,814
Total interest expense . . . . . . . . . . 1,824,471 6,840 5,202 1,836,513 (221,068) 1,615,445
Net interest income (loss) . . . . . . . 572,964 (6,840) 1,065 567,189 (290,820) 276,369
Less: provisions for loan losses . . . 181,321 — — 181,321 (44,010) 137,311
Net interest income (loss) after
provisions for loan losses . . . . . . 391,643 (6,840) 1,065 385,868 (246,810) 139,058
Contingency fee revenue . . . . . . . . — 85,306 — 85,306 — 85,306
Collections revenue . . . . . . . . . . . . — 56,361 — 56,361 878 57,239
Guarantor servicing fees . . . . . . . . — — 34,653 34,653 — 34,653
Other income (loss) . . . . . . . . . . . . 44,345 — 50,641 94,986 (201,273) (106,287)
Total other income . . . . . . . . . . . . 44,345 141,667 85,294 271,306 (200,395) 70,911
Restructuring expenses . . . . . . . . . 15,550 434 4,694 20,678 — 20,678
Operating expenses . . . . . . . . . . . . 163,636 106,142 69,655 339,433 16,215 355,648
Total expenses . . . . . . . . . . . . . . . 179,186 106,576 74,349 360,111 16,215 376,326
Income (loss) before income taxes
and minority interest in net
earnings of subsidiaries . . . . . . . 256,802 28,251 12,010 297,063 (463,420) (166,357)
Income tax expense (benefit)(1) . . . . 94,067 10,348 4,399 108,814 (171,302) (62,488)
Minority interest in net earnings of
subsidiaries . . . . . . . . . . . . . . . . — (65) — (65) — (65)
Net income (loss) . . . . . . . . . . . . . $ 162,735 $ 17,968 $ 7,611 $ 188,314 $(292,118) $ (103,804)
(1)
Income taxes are based on a percentage of net income before tax for the individual reportable segment.
4
5. SLM CORPORATION
Segment and “Core Earnings”
Consolidated Statements of Income
(In thousands)
Quarter ended December 31, 2007
Asset
Performance Corporate Total ‘‘Core Total
Lending Group and Other Earnings” Adjustments GAAP
(unaudited)
Interest income:
FFELP Stafford and Other
Student Loans . . . . . . . . . . . $ 705,051 $ — $ — $ 705,051 $ (151,738) $ 553,313
FFELP Consolidation Loans . . . 1,354,573 — — 1,354,573 (259,008) 1,095,565
Private Education Loans . . . . . . 731,217 — — 731,217 (335,255) 395,962
Other loans . . . . . . . . . . . . . . . 25,427 — — 25,427 — 25,427
Cash and investments . . . . . . . . 272,875 — 5,837 278,712 (37,866) 240,846
Total interest income . . . . . . . . . . 3,089,143 — 5,837 3,094,980 (783,867) 2,311,113
Total interest expense . . . . . . . . . . 2,471,613 6,592 5,165 2,483,370 (506,728) 1,976,642
Net interest income (loss) . . . . . . . 617,530 (6,592) 672 611,610 (277,139) 334,471
Less: provisions for loan losses . . . 749,460 — 1 749,461 (175,283) 574,178
Net interest income (loss) after
provisions for loan losses . . . . . (131,930) (6,592) 671 (137,851) (101,856) (239,707)
Contingency fee revenue. . . . . . . . — 91,872 — 91,872 — 91,872
Collections revenue . . . . . . . . . . . — 73,916 — 73,916 2,189 76,105
Guarantor servicing fees . . . . . . . . — — 40,980 40,980 — 40,980
Other income (loss) . . . . . . . . . . . 44,189 — 55,354 99,543 (1,349,444) (1,249,901)
Total other income (loss) . . . . . . . 44,189 165,788 96,334 306,311 (1,347,255) (1,040,944)
Restructuring expenses . . . . . . . . . 19,006 1,774 1,725 22,505 — 22,505
Operating expenses . . . . . . . . . . . 172,434 104,048 88,572 365,054 53,415 418,469
Total expenses . . . . . . . . . . . . . . . 191,440 105,822 90,297 387,559 53,415 440,974
Income (loss) before income taxes
and minority interest in net
earnings of subsidiaries . . . . . . . (279,181) 53,374 6,708 (219,099) (1,502,526) (1,721,625)
Income tax expense (benefit)(1) . . . (103,297) 19,749 2,481 (81,067) (5,837) (86,904)
Minority interest in net earnings of
subsidiaries . . . . . . . . . . . . . . . — 537 — 537 — 537
Net income (loss) . . . . . . . . . . . . $ (175,884) $ 33,088 $ 4,227 $ (138,569) $(1,496,689) $(1,635,258)
(1)
Income taxes are based on a percentage of net income before tax for the individual reportable segment.
5
6. SLM CORPORATION
Segment and “Core Earnings”
Consolidated Statements of Income
(In thousands)
Quarter ended March 31, 2007
Asset
Performance Corporate Total ‘‘Core Total
Lending Group and Other Earnings” Adjustments GAAP
(unaudited)
Interest income:
FFELP Stafford and Other
Student Loans . . . . . . . . . . . . $ 695,353 $ — $ — $ 695,353 $(244,591) $ 450,762
FFELP Consolidation Loans . . . . 1,331,235 — — 1,331,235 (316,389) 1,014,846
Private Education Loans. . . . . . . 657,584 — — 657,584 (319,163) 338,421
Other loans. . . . . . . . . . . . . . . . 27,973 — — 27,973 — 27,973
Cash and investments . . . . . . . . 161,677 — 2,135 163,812 (49,908) 113,904
Total interest income . . . . . . . . . . . 2,873,822 — 2,135 2,875,957 (930,051) 1,945,906
Total interest expense . . . . . . . . . . 2,220,136 6,687 5,568 2,232,391 (700,301) 1,532,090
Net interest income (loss) . . . . . . . 653,686 (6,687) (3,433) 643,566 (229,750) 413,816
Less: provisions for loan losses . . . 197,930 — 606 198,536 (48,206) 150,330
Net interest income (loss) after
provisions for loan losses . . . . . . 455,756 (6,687) (4,039) 445,030 (181,544) 263,486
Contingency fee revenue . . . . . . . . — 87,326 — 87,326 (4) 87,322
Collections revenue. . . . . . . . . . . . — 65,322 — 65,322 240 65,562
Guarantor servicing fees . . . . . . . . — — 39,241 39,241 — 39,241
Other income . . . . . . . . . . . . . . . . 44,418 — 51,317 95,735 232,000 327,735
Total other income . . . . . . . . . . . . 44,418 152,648 90,558 287,624 232,236 519,860
Operating expenses . . . . . . . . . . . . 171,563 93,248 67,505 332,316 23,858 356,174
Income before income taxes and
minority interest in net earnings
of subsidiaries. . . . . . . . . . . . . . 328,611 52,713 19,014 400,338 26,834 427,172
Income tax expense(1) . . . . . . . . . . 121,586 19,504 7,035 148,125 161,889 310,014
Minority interest in net earnings of
subsidiaries . . . . . . . . . . . . . . . — 1,005 — 1,005 — 1,005
Net income (loss) . . . . . . . . . . . . . $ 207,025 $ 32,204 $11,979 $ 251,208 $(135,055) $ 116,153
(1)
Income taxes are based on a percentage of net income before tax for the individual reportable segment.
6
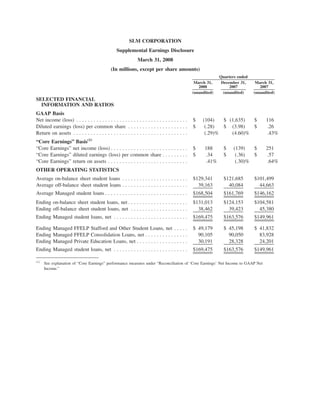
7. SLM CORPORATION
Reconciliation of “Core Earnings’’ Net Income to GAAP Net Income
(In thousands, except per share amounts)
Quarters ended
March 31, December 31, March 31,
2008 2007 2007
(unaudited) (unaudited) (unaudited)
“Core Earnings” net income (loss)(A) . . . . . . . . . . . . . . . . . . . . . . . $ 188,314 $ (138,569) $ 251,208
“Core Earnings” adjustments:
Net impact of securitization accounting . . . . . . . . . .............. (79,146) (2,547) 421,485
Net impact of derivative accounting . . . . . . . . . . . .............. (363,368) (1,396,683) (331,724)
Net impact of Floor Income . . . . . . . . . . . . . . . . . .............. (5,577) (49,844) (39,021)
Net impact of acquired intangibles . . . . . . . . . . . . .............. (15,329) (53,452) (23,906)
Total “Core Earnings” adjustments before income taxes and minority
interest in net earnings of subsidiaries . . . . . . . . . . . . . . . . . . . . . . (463,420) (1,502,526) 26,834
Net tax effect(B) . . . . . . . . . . . . . . . . . . . . . . . . . . . . . . . . . . . . . . . . (171,302) 5,837 (161,889)
Total “Core Earnings” adjustments . . . . . . . . . . . . . . . . . . . . . . . . . . (292,118) (1,496,689) (135,055)
GAAP net income (loss) . . . . . . . . . . . . . . . . . . . . . . . . . . . . . . . . . $(103,804) $(1,635,258) $ 116,153
GAAP diluted earnings (loss) per common share . . . . . . . . . . . . . . . . $ (.28) $ (3.98) $ .26
(A)
“Core Earnings” diluted earnings (loss) per common share . . . . . . . . . . . . . . . . $ .34 $ (.36) $ .57
(B)
Such tax effect is based upon the Company’s “Core Earnings” effective tax rate. For the quarters ended December 31, 2007 and
March 31, 2007, the “Core Earnings” effective tax rate is different than GAAP primarily from the exclusion of the permanent income
tax impact of the equity forward contracts. The Company settled all of its equity forward contracts in January 2008.
“Core Earnings”
In accordance with the Rules and Regulations of the Securities and Exchange Commission (“SEC”), we
prepare financial statements in accordance with generally accepted accounting principles in the United States
of America (“GAAP”). In addition to evaluating the Company’s GAAP-based financial information, manage-
ment evaluates the Company’s business segments on a basis that, as allowed under the Financial Accounting
Standards Board’s Statement of Financial Accounting Standards (“SFAS”) No. 131, “Disclosures about
Segments of an Enterprise and Related Information,” differs from GAAP. We refer to management’s basis of
evaluating our segment results as “Core Earnings” presentations for each business segment and we refer to this
information in our presentations with credit rating agencies and lenders. While “Core Earnings” are not a
substitute for reported results under GAAP, we rely on “Core Earnings” to manage each operating segment
because we believe these measures provide additional information regarding the operational and performance
indicators that are most closely assessed by management.
Our “Core Earnings” are not defined terms within GAAP and may not be comparable to similarly titled
measures reported by other companies. “Core Earnings” net income reflects only current period adjustments to
GAAP net income as described below. Unlike financial accounting, there is no comprehensive, authoritative
guidance for management reporting and as a result, our management reporting is not necessarily comparable
with similar information for any other financial institution. Our operating segments are defined by products
and services or by types of customers, and reflect the manner in which financial information is currently
evaluated by management. Intersegment revenues and expenses are netted within the appropriate financial
statement line items consistent with the income statement presentation provided to management. Changes in
management structure or allocation methodologies and procedures may result in changes in reported segment
financial information.
7
8. Limitations of “Core Earnings”
While GAAP provides a uniform, comprehensive basis of accounting, for the reasons described above,
management believes that “Core Earnings” are an important additional tool for providing a more complete
understanding of the Company’s results of operations. Nevertheless, “Core Earnings” are subject to certain
general and specific limitations that investors should carefully consider. For example, as stated above, unlike
financial accounting, there is no comprehensive, authoritative guidance for management reporting. Our “Core
Earnings” are not defined terms within GAAP and may not be comparable to similarly titled measures
reported by other companies. Unlike GAAP, “Core Earnings” reflect only current period adjustments to GAAP.
Accordingly, the Company’s “Core Earnings” presentation does not represent a comprehensive basis of
accounting. Investors, therefore, may not compare our Company’s performance with that of other financial
services companies based upon “Core Earnings.” “Core Earnings” results are only meant to supplement GAAP
results by providing additional information regarding the operational and performance indicators that are most
closely used by management, the Company’s board of directors, rating agencies and lenders to assess
performance.
Other limitations arise from the specific adjustments that management makes to GAAP results to derive
“Core Earnings” results. For example, in reversing the unrealized gains and losses that result from
SFAS No. 133, “Accounting for Derivative Instruments and Hedging Activities,” on derivatives that do not
qualify for “hedge treatment,” as well as on derivatives that do qualify but are in part ineffective because they
are not perfect hedges, we focus on the long-term economic effectiveness of those instruments relative to the
underlying hedged item and isolate the effects of interest rate volatility, changing credit spreads and changes
in our stock price on the fair value of such instruments during the period. Under GAAP, the effects of these
factors on the fair value of the derivative instruments (but not on the underlying hedged item) tend to show
more volatility in the short term. While presentation of our results on a “Core Earnings” basis provides
important information regarding the performance of our Managed loan portfolio, a limitation of this
presentation is that we present the ongoing spread income on loans that have been sold to a trust we manage.
While we believe that our “Core Earnings” presentation presents the economic substance of our Managed loan
portfolio, it understates earnings volatility from securitization gains. Our “Core Earnings” results exclude
certain Floor Income, which is cash income, from our reported results and therefore may understate earnings
in certain periods. Management’s financial planning and valuation of operating results, however, does not take
into account Floor Income because of its inherent uncertainty, except when it is economically hedged through
Floor Income Contracts.
Pre-Tax Differences between “Core Earnings” and GAAP
Our “Core Earnings” are the primary financial performance measures used by management to evaluate
performance and to allocate resources. Accordingly, financial information is reported to management on a
“Core Earnings” basis by reportable segment, as these are the measures used regularly by our chief operating
decision makers. Our “Core Earnings” are used in developing our financial plans, tracking results, and
establishing corporate performance targets. Management believes this information provides additional insight
into the financial performance of the Company’s core business activities. “Core Earnings” net income reflects
only current period adjustments to GAAP net income, as described in the more detailed discussion of the
differences between “Core Earnings” and GAAP that follows, which includes further detail on each specific
adjustment required to reconcile our “Core Earnings” segment presentation to our GAAP earnings.
1) Securitization Accounting: Under GAAP, certain securitization transactions in our Lending operating
segment are accounted for as sales of assets. Under “Core Earnings” for the Lending operating
segment, we present all securitization transactions on a “Core Earnings” basis as long-term non-
recourse financings. The upfront “gains” on sale from securitization transactions, as well as ongoing
“servicing and securitization revenue” presented in accordance with GAAP, are excluded from “Core
Earnings” and are replaced by interest income, provisions for loan losses, and interest expense as
earned or incurred on the securitization loans. We also exclude transactions with our off-balance sheet
8
9. trusts from “Core Earnings” as they are considered intercompany transactions on a “Core Earnings”
basis.
2) Derivative Accounting: “Core Earnings” exclude periodic unrealized gains and losses that are caused
primarily by the one-sided mark-to-market derivative valuations prescribed by SFAS No. 133 on
derivatives that do not qualify for “hedge treatment” under GAAP. These unrealized gains and losses
occur in our Lending operating segment, and occurred in our Corporate and Other reportable segment
related to equity forward contracts for the prior and year-ago quarters. In our “Core Earnings”
presentation, we recognize the economic effect of these hedges, which generally results in any cash
paid or received being recognized ratably as an expense or revenue over the hedged item’s life. “Core
Earnings” also exclude the gain or loss on equity forward contracts that under SFAS No. 133, are
required to be accounted for as derivatives and are marked to market through earnings. The Company
settled all of its equity forward contracts in January 2008.
3) Floor Income: The timing and amount (if any) of Floor Income earned in our Lending operating
segment is uncertain and in excess of expected spreads. Therefore, we exclude such income from
“Core Earnings” when it is not economically hedged. We employ derivatives, primarily Floor Income
Contracts and futures, to economically hedge Floor Income. As discussed above in “Derivative
Accounting,” these derivatives do not qualify as effective accounting hedges, and therefore, under
GAAP, are marked to market through the “gains (losses) on derivative and hedging activities, net” line
in the consolidated statement of income with no offsetting gain or loss recorded for the economically
hedged items. For “Core Earnings,” we reverse the fair value adjustments on the Floor Income
Contracts and futures economically hedging Floor Income and include the amortization of net
premiums received in income.
4) Acquired Intangibles: Our “Core Earnings” exclude goodwill and intangible impairment and the
amortization of acquired intangibles.
9
10. SLM CORPORATION
SUPPLEMENTAL FINANCIAL INFORMATION RELEASE
FIRST QUARTER 2008
(Dollars in millions, except per share amounts, unless otherwise stated)
The following information (the “Supplemental Financial Information Release” or “Release”) should be
read in connection with SLM Corporation’s (the “Company’s”) press release for first quarter 2008 earnings,
dated April 16, 2008.
The Supplemental Financial Information Release contains forward-looking statements and information
based on management’s current expectations as of the date of the Release. Statements that are not historical
facts, including statements about our beliefs or expectations and statements that assume or are dependent upon
future events, are forward-looking statements. Forward-looking statements are subject to risks, uncertainties,
assumptions and other factors that may cause actual results to be materially different from those reflected in
such forward-looking statements. These factors include, among others, the occurrence of any event, change or
other circumstances that could give rise to our ability to cost-effectively refinance the aggregate $34 billion
asset-backed financing facilities, due February 2009, which closed in the first quarter of 2008 (collectively, the
“2008 Asset-Backed Financing Facilities”), including any potential foreclosure on the student loans under
those facilities following their termination; increased financing costs; limited liquidity; any adverse outcomes
in any significant litigation to which we are a party; our derivative counterparties terminating their positions
with the Company if permitted by their contracts and the Company substantially incurring additional costs to
replace any terminated positions; changes in the terms of student loans and the educational credit marketplace
(including changes resulting from new laws and regulations and from the implementation of applicable laws
and regulations) which, among other things, may reduce the volume, average term and yields on student loans
under the Federal Family Education Loan Program (“FFELP”), may result in loans being originated or
refinanced under non-FFELP programs, or may affect the terms upon which banks and others agree to sell
FFELP loans to the Company. The Company could also be affected by: changes in the demand for educational
financing or in financing preferences of lenders, educational institutions, students and their families; incorrect
estimates or assumptions by management in connection with the preparation of our consolidated financial
statements; changes in the composition of our Managed FFELP and Private Education Loan portfolios;
changes in the general interest rate environment and in the securitization markets for education loans, which
may increase the costs or limit the availability of financings necessary to initiate, purchase or carry education
loans; changes in projections of losses from loan defaults; changes in general economic conditions; changes in
prepayment rates and credit spreads; and changes in the demand for debt management services and new laws
or changes in existing laws that govern debt management services. All forward-looking statements contained
in the Release are qualified by these cautionary statements and are made only as of the date this Release is
filed. The Company does not undertake any obligation to update or revise these forward-looking statements to
conform the statement to actual results or changes in the Company’s expectations.
Definitions for capitalized terms in this document can be found in the Company’s 2007 Form 10-K filed
with the Securities and Exchange Commission (“SEC”) on February 29, 2008.
Certain reclassifications have been made to the balances as of and for the quarters ended March 31, 2007
and December 31, 2007, to be consistent with classifications adopted for the quarter ended March 31, 2008.
10
11. DISCUSSION OF CONSOLIDATED RESULTS OF OPERATIONS
Three Months Ended March 31, 2008 Compared to Three Months Ended December 31, 2007
For the three months ended March 31, 2008, our net loss was $104 million or $.28 diluted loss per share,
compared to a net loss of $1.6 billion, or $3.98 diluted loss per share, for the three months ended December 31,
2007. The effective tax rate for those periods was 38 percent and 5 percent, respectively. The movement in the
effective tax rate was primarily driven by the permanent tax impact of excluding non-taxable gains and losses
on the equity forward contracts which are marked to market through earnings under the Financial Accounting
Standards Board’s (“FASB’s”) Statement of Financial Accounting Standards (“SFAS”) No. 133, “Accounting
for Derivative Instruments and Hedging Activities.” Pre-tax income increased by $1.6 billion versus the prior
quarter primarily due to a $1.1 billion decrease in net losses on derivative and hedging activities, which was
mostly comprised of losses on our equity forward contracts in the fourth quarter of 2007. Losses on derivative
and hedging activities were $273 million in the first quarter of 2008 compared to $1.3 billion in the prior
quarter. The Company settled all of its outstanding equity forward contracts in January 2008.
There were no gains on student loan securitizations in the first quarter of 2008 or the fourth quarter of
2007 because we did not complete any off-balance sheet securitizations. The Company adopted SFAS No. 159,
“The Fair Value Option for Financial Assets and Financial Liabilities — Including an Amendment of FASB
Statement No. 115,” on January 1, 2008, and elected the fair value option on all of the Residual Interests
effective January 1, 2008. The Company made this election in order to simplify the accounting for Residual
Interests by having all Residual Interests under one accounting model. Prior to this election, Residual Interests
were accounted for either under SFAS No. 115, “Accounting for Certain Investments in Debt and Equity
Securities,” with changes in fair value recorded through other comprehensive income or under SFAS No. 155,
“Accounting for Certain Hybrid Financial Instruments,” with changes in fair value recorded through income.
The Company reclassified the related accumulated other comprehensive income of $198 million into retained
earnings, and as a result, equity was not impacted at transition on January 1, 2008. Changes in fair value of
Residual Interests on and after January 1, 2008 are recorded through the income statement. The Company has
not elected the fair value option for any other financial instruments at this time. Servicing and securitization
revenue increased by $85 million from $23 million in the fourth quarter of 2007 to $108 million in the first
quarter of 2008. This increase was primarily due to a current-quarter $88 million unrealized mark-to-market
loss recorded under SFAS No. 159 compared to a prior-quarter $137 million unrealized mark-to-market loss,
which included both impairment and an unrealized mark-to-market loss recorded under SFAS No. 155. Also
contributing to the increase in servicing and securitization revenue was an increase in Embedded Floor Income
due to the decrease in interest rates during the current quarter. Embedded Floor Income was $46 million in the
first quarter of 2008 compared to $8 million in the fourth quarter of 2007.
Net interest income after provisions for loan losses increased by $379 million in the first quarter of 2008
over the fourth quarter of 2007. This increase was due to a $437 million decrease in provisions for loan losses,
offset by a $58 million decrease in net interest income. The decrease in net interest income was primarily due
to a decrease in the student loan spread (see “LENDING BUSINESS SEGMENT — Net Interest Income —
Net Interest Margin — On-Balance Sheet”). The decrease in provisions for loan losses relates to significantly
higher provision amounts recorded in the fourth quarter of 2007 for Private Education Loans, FFELP loans,
and mortgage loans primarily due to a weakening U.S. economy (see “LENDING BUSINESS SEGMENT —
Allowance for Private Education Loan Losses; and — Total Provisions for Loan Losses”).
In the first quarter of 2008, fee and other income and collections revenue totaled $271 million, a
$31 million decrease from $302 million in the prior quarter. Operating expenses decreased by $62 million
from $418 million in the fourth quarter of 2007 to $356 million in the first quarter of 2008. The decrease in
operating expenses was primarily due to a decrease in goodwill and acquired intangible impairments of
$37 million and to a decrease in Merger-related expenses of $18 million compared to the fourth quarter of
2007.
The Company is currently restructuring its business in a response to the impact of The College Cost
Reduction and Access Act of 2007 (“CCRAA”), and current challenges in the capital markets. As part of the
Company’s cost reduction efforts, restructuring expenses of $21 million and $23 million were recognized in
11
12. the first quarter of 2008 and the fourth quarter of 2007, respectively. The majority of these restructuring
expenses were severance costs related to the elimination of approximately 1,000 positions (representing
approximately nine percent of the overall employee population) across all areas of the Company. The
Company is still in the preliminary phase of assessing all potential restructuring activities and as a result, the
Company cannot estimate the total expected restructuring expenses at this time.
The Company adopted SFAS No. 157, “Fair Value Measurements,” on January 1, 2008, with no resulting
impact to the financial statements.
Three Months Ended March 31, 2008 Compared to Three Months Ended March 31, 2007
For the three months ended March 31, 2008, our net loss was $104 million or $.28 diluted loss per share,
compared to net income of $116 million, or $.26 diluted earnings per share, for the three months ended
March 31, 2007. The effective tax rate for those periods was 38 percent and 73 percent, respectively. The
movement in the effective tax rate was primarily driven by the permanent tax impact of excluding non-taxable
gains and losses on the equity forward contracts which are marked to market through earnings under
SFAS No. 133, as discussed above. Losses on derivative and hedging activities were $273 million in the first
quarter of 2008 compared to $357 million in the year-ago quarter. The Company settled all of its outstanding
equity forward contracts in January 2008.
Pre-tax income decreased by $593 million versus the year-ago quarter primarily due to no gains on
student loan securitizations in the first quarter of 2008, since the Company did not complete any off-balance
sheet securitizations in the current quarter, compared to $367 million of securitization gains related to one
Private Education Loan securitization in the year-ago quarter. Servicing and securitization revenue decreased
by $144 million from $252 million in the first quarter of 2007 to $108 million in the first quarter of 2008.
This decrease was primarily due to a current-quarter $88 million unrealized mark-to-market loss recorded
under SFAS No. 159 compared to a year-ago quarter $68 million unrealized mark-to-market gain, which
included both impairment and an unrealized mark-to-market gain recorded under SFAS No. 155. Partially
offsetting the decrease in servicing and securitization revenue was an increase in Embedded Floor Income due
to the decrease in interest rates during the current quarter. Embedded Floor Income was $46 million in the
first quarter of 2008 compared to $1 million in the first quarter of 2007.
Net interest income after provisions for loan losses decreased by $124 million in the first quarter from the
year-ago quarter. This decrease was due to a $137 million decrease in net interest income, offset by a
$13 million decrease in provisions for loan losses. The decrease in net interest income was primarily due to a
decrease in the student loan spread (see “LENDING BUSINESS SEGMENT — Net Interest Income —
Net Interest Margin — On-Balance Sheet”).
In the first quarter of 2008, fee and other income and collections revenue totaled $271 million, an
$18 million decrease from $289 million in the year-ago quarter. Operating expenses remained unchanged at
$356 million in the first quarter of 2008 compared to the first quarter of 2007. Restructuring expenses of
$21 million were recognized in the first quarter of 2008, as previously discussed, with no such expenses
recognized in the year-ago quarter.
Other Income
The following table summarizes the components of “Other income” in the consolidated statements of
income for the quarters ended March 31, 2008, December 31, 2007 and March 31, 2007.
March 31, December 31, March 31,
2008 2007 2007
Late fees and forbearance fees . . . . . . . . . . . . . . . . . . . . . . . . $37 $34 $35
Asset servicing and other transaction fees . . . . . . . . . . . . . . . . 26 32 25
Loan servicing fees . . . . . . . . . . . . . . . . . . . . . . . . . . . . . . . . 7 6 8
Gains on sales of mortgages and other loan fees . . . . . . . . . . . 1 1 3
Other . . . . . . . . . . . . . . . . . . . . . . . . . . . . . . . . . . . . . . . . . . . 23 20 25
Total other income . . . . . . . . . . . . . . . . . . . . . . . . . . . . . . . . . $94 $93 $96
12
13. EARNINGS RELEASE SUMMARY
The following table summarizes GAAP income statement items (on a tax-effected basis) that are
disclosed separately in the Company’s press releases of earnings or the Company’s quarterly earnings
conference calls for the quarters ended March 31, 2008, December 31, 2007, and March 31, 2007.
Quarters ended
March 31, December 31, March 31,
(in thousands) 2008 2007 2007
Reported net income (loss) . . . . . . . . . . . . . . . . . . . . . . . . . . . . . . . . $(103,804) $(1,635,258) $116,153
Preferred stock dividends . . . . . . . . . . . . . . . . . . . . . . . . . . . . . . . . . . (29,025) (9,622) (9,093)
Reported net income (loss) attributable to common stock . . . . . . .... (132,829) (1,644,880) 107,060
Expense items disclosed separately (tax-effected):
Merger-related financing fees(1) . . . . . . . . . . . . . . . . . . . . . . . . . .... — 7,833 —
Merger-related professional fees and other costs . . . . . . . . . . . . . .... — 9,286 —
Restructuring expenses . . . . . . . . . . . . . . . . . . . . . . . . . . . . . . . .... 12,903 14,178 —
Acceleration of premium amortization expense on loans(2) . . . . . .... 33,818 — —
Total expense items disclosed separately (tax-effected) . . . . . . . . . . . . 46,721 31,297 —
Net income (loss) attributable to common stock excluding the impact
of items disclosed separately . . . . . . . . . . . . . . . . . . . . . . . . . . . . . $ (86,108) $(1,613,583) $107,060
Average common and common equivalent shares outstanding(3) . . . . . 466,580 413,049 418,449
(1)
Merger-related financing fees are the commitment and liquidity fees related to the financing facility in connection with the Merger
Agreement, now terminated. See “LIQUIDITY AND CAPITAL RESOURCES.”
(2)
The Company’s decision to cease consolidating FFELP Stafford loans and Consolidation Loans for the foreseeable future (considering
the CCRAA’s impact on the economics of a Consolidation Loan as well as the Company’s increased cost of funds given the current
credit market environment) resulted in a one-time, cumulative catch-up adjustment in premium amortization expense, due to shorten-
ing the assumed average lives of Stafford loans, which previously had an assumption that a portion of the underlying Stafford loans
would consolidate internally which extends the average life of such loans. Consolidation Loans generally have longer terms to matu-
rity than Stafford loans.
(3)
Common equivalent shares outstanding were anti-dilutive for the quarters ended March 31, 2008 and December 31, 2007.
13
14. The following table summarizes “Core Earnings” income statement items (on a tax-effected basis) that
are disclosed separately in the Company’s press releases of earnings or the Company’s quarterly earnings
conference calls for the quarters ended March 31, 2008, December 31, 2007, and March 31, 2007.
Quarters ended
March 31, December 31, March 31,
(in thousands) 2008 2007 2007
“Core Earnings” net income (loss) . . . . . . . . . . . . . . . . . . . . . . . . . . . . $188,314 $(138,569) $251,208
Preferred stock dividends. . . . . . . . . . . . . . . . . . . . . . . . . . . . . . . . . . . (29,025) (9,622) (9,093)
“Core Earnings” net income (loss) attributable to common stock . . . . . 159,289 (148,191) 242,115
Expense items disclosed separately (tax-effected):
Merger-related financing fees(1) . . . . . . . . . . . . . . . . . . . . . . . . . . . . . . — 7,833 —
Merger-related professional fees and other costs . . . . . . . . . . . . . . . . . . — 9,286 —
Restructuring expenses . . . . . . . . . . . . . . . . . . . . . . . . . . . . . . . . . . . . 13,110 14,178 —
Acceleration of premium amortization expense on loans(2) . . . . . . . . . . 52,106 — —
Total expense items disclosed separately (tax-effected) . . . . . . . . . . . . . 65,216 31,297 —
“Core Earnings” net income (loss) attributable to common stock
excluding the impact of items disclosed separately . . . . . . . . . . . . . . 224,505 (116,894) 242,115
Adjusted for debt expense of contingently convertible debt instruments,
net of tax . . . . . . . . . . . . . . . . . . . . . . . . . . . . . . . . . . . . . . . . . . . . — — 17,510
“Core Earnings” net income (loss) attributable to common stock,
adjusted . . . . . . . . . . . . . . . . . . . . . . . . . . . . . . . . . . . . . . . . . . . . . $224,505 $(116,894) $259,625
Average common and common equivalent shares outstanding(3) . . . . . . 467,247 413,049 458,739
(1)
Merger-related financing fees are the commitment and liquidity fees related to the financing facility in connection with the Merger
Agreement, now terminated. See “LIQUIDITY AND CAPITAL RESOURCES.”
(2)
The Company’s decision to cease consolidating FFELP Stafford loans and Consolidation Loans for the foreseeable future (considering
the CCRAA’s impact on the economics of a Consolidation Loan as well as the Company’s increased cost of funds given the current
credit market environment) resulted in a one-time, cumulative catch-up adjustment in premium amortization expense, due to shorten-
ing the assumed average lives of Stafford loans, which previously had an assumption that a portion of the underlying Stafford loans
would consolidate internally which extends the average life of such loans. Consolidation Loans generally have longer terms to matu-
rity than Stafford loans.
(3)
Common equivalent shares outstanding were anti-dilutive for the fourth quarter of 2007.
BUSINESS SEGMENTS
The results of operations of the Company’s Lending, Asset Performance Group (“APG”), and Corporate
and Other business segments are presented below, using our “Core Earnings” presentation.
The Lending business segment section includes all discussion of income and related expenses associated
with the net interest margin, the student loan spread and its components, the provisions for loan losses, and
other fees earned on our Managed portfolio of student loans. The APG business segment reflects the fees
earned and expenses incurred in providing accounts receivable management and collection services. Our
Corporate and Other business segment includes our remaining fee businesses and other corporate expenses that
do not pertain directly to the primary segments identified above.
Pre-tax Differences between “Core Earnings” and GAAP
Our “Core Earnings” are the primary financial performance measures used by management to evaluate
performance and to allocate resources. Accordingly, financial information is reported to management on a
“Core Earnings” basis by reportable segment, as these are the measures used regularly by our chief operating
decision makers. Our “Core Earnings” are used in developing our financial plans, tracking results, and
establishing corporate performance targets. Management believes this information provides additional insight
14
15. into the financial performance of the Company’s core business activities. “Core Earnings” net income reflects
only current period adjustments to GAAP net income, as described in the more detailed discussion of the
differences between “Core Earnings” and GAAP that follows, which includes further detail on each specific
adjustment required to reconcile our “Core Earnings” segment presentation to our GAAP earnings.
1) Securitization Accounting: Under GAAP, certain securitization transactions in our Lending operating
segment are accounted for as sales of assets. Under “Core Earnings” for the Lending operating
segment, we present all securitization transactions on a “Core Earnings” basis as long-term non-
recourse financings. The upfront “gains” on sale from securitization transactions, as well as ongoing
“servicing and securitization revenue” presented in accordance with GAAP, are excluded from “Core
Earnings” and are replaced by interest income, provisions for loan losses, and interest expense as
earned or incurred on the securitization loans. We also exclude transactions with our off-balance sheet
trusts from “Core Earnings” as they are considered intercompany transactions on a “Core Earnings”
basis.
The following table summarizes “Core Earnings” securitization adjustments for the Lending operating
segment for the quarters ended March 31, 2008, December 31, 2007 and March 31, 2007.
Quarters ended
March 31, December 31, March 31,
2008 2007 2007
“Core Earnings” securitization adjustments:
Net interest income on securitized loans, before provisions for
loan losses and before intercompany transactions . . . . . . . . . . $(194) $(169) $(216)
Provisions for loan losses . . . . . . . . . . . . . . . . . . . . . . . . . . . . . 44 176 49
Net interest income on securitized loans, after provisions for
loan losses, before intercompany transactions. . . . . . . . . . . . . (150) 7 (167)
Intercompany transactions with off-balance sheet trusts . . . . . . . (37) (32) (30)
Net interest income on securitized loans, after provisions for
loan losses . . . . . . . . . . . . . . . . . . . . . . . . . . . . . . . . . . . . . . (187) (25) (197)
Gains on student loan securitizations . . . . . . . . . . . . . . . . . . . . . — — 367
Servicing and securitization revenue . . . . . . . . . . . . . . . . . . . . . 108 23 252
Total “Core Earnings” securitization adjustments . . . . . . . . . . . . $ (79) $ (2) $ 422
“Intercompany transactions with off-balance sheet trusts” in the above table relate primarily to losses
incurred through the repurchase of delinquent loans from our off-balance sheet securitization trusts.
When Private Education Loans in our securitization trusts settling before September 30, 2005, become
180 days delinquent, we typically exercise our contingent call option to repurchase these loans at par
value out of the trust and record a loss for the difference in the par value paid and the fair market
value of the loan at the time of purchase. We do not hold the contingent call option for any trusts
settled after September 30, 2005.
2) Derivative Accounting: “Core Earnings” exclude periodic unrealized gains and losses that are caused
primarily by the one-sided mark-to-market derivative valuations prescribed by SFAS No. 133 on
derivatives that do not qualify for “hedge treatment” under GAAP. These unrealized gains and losses
occur in our Lending operating segment, and occurred in our Corporate and Other reportable segment
related to equity forward contracts in the prior and year-ago quarters. In our “Core Earnings”
presentation, we recognize the economic effect of these hedges, which generally results in any cash
paid or received being recognized ratably as an expense or revenue over the hedged item’s life. “Core
Earnings” also exclude the gain or loss on equity forward contracts that under SFAS No. 133, are
required to be accounted for as derivatives and are marked-to-market through earnings.
SFAS No. 133 requires that changes in the fair value of derivative instruments be recognized currently
in earnings unless specific hedge accounting criteria, as specified by SFAS No. 133, are met. We
15
16. believe that our derivatives are effective economic hedges, and as such, are a critical element of our
interest rate risk management strategy. However, some of our derivatives, primarily Floor Income
Contracts, certain basis swaps and equity forward contracts (discussed in detail below), do not qualify
for “hedge treatment” as defined by SFAS No. 133, and the stand-alone derivative must be marked-to-
market in the income statement with no consideration for the corresponding change in fair value of the
hedged item. The gains and losses described in “Gains (losses) on derivative and hedging activities,
net” are primarily caused by interest rate and foreign currency exchange rate volatility, changing credit
spreads and changes in our stock price during the period as well as the volume and term of derivatives
not receiving hedge treatment.
Our Floor Income Contracts are written options that must meet more stringent requirements than other
hedging relationships to achieve hedge effectiveness under SFAS No. 133. Specifically, our Floor
Income Contracts do not qualify for hedge accounting treatment because the paydown of principal of
the student loans underlying the Floor Income embedded in those student loans does not exactly match
the change in the notional amount of our written Floor Income Contracts. Under SFAS No. 133, the
upfront payment is deemed a liability and changes in fair value are recorded through income
throughout the life of the contract. The change in the value of Floor Income Contracts is primarily
caused by changing interest rates that cause the amount of Floor Income earned on the underlying
student loans and paid to the counterparties to vary. This is economically offset by the change in value
of the student loan portfolio, including our Retained Interests, earning Floor Income but that offsetting
change in value is not recognized under SFAS No. 133. We believe the Floor Income Contracts are
economic hedges because they effectively fix the amount of Floor Income earned over the contract
period, thus eliminating the timing and uncertainty that changes in interest rates can have on Floor
Income for that period. Prior to SFAS No. 133, we accounted for Floor Income Contracts as hedges
and amortized the upfront cash compensation ratably over the lives of the contracts.
Basis swaps are used to convert floating rate debt from one floating interest rate index to another to
better match the interest rate characteristics of the assets financed by that debt. We primarily use basis
swaps to change the index of our floating rate debt to better match the cash flows of our student loan
assets that are primarily indexed to a commercial paper, Prime or Treasury bill index. In addition, we
use basis swaps to convert debt indexed to the Consumer Price Index to 3 month LIBOR debt.
SFAS No. 133 requires that when using basis swaps, the change in the cash flows of the hedge
effectively offset both the change in the cash flows of the asset and the change in the cash flows of
the liability. Our basis swaps hedge variable interest rate risk, however they generally do not meet this
effectiveness test because most of our FFELP student loans can earn at either a variable or a fixed
interest rate depending on market interest rates. We also have basis swaps that do not meet the
SFAS No. 133 effectiveness test that economically hedge off-balance sheet instruments. As a result,
under GAAP these swaps are recorded at fair value with changes in fair value reflected currently in
the income statement.
Under SFAS No. 150, “Accounting for Certain Financial Instruments with Characteristics of both
Liabilities and Equity,” equity forward contracts that allow a net settlement option either in cash or the
Company’s stock are required to be accounted for as derivatives in accordance with SFAS No. 133. As
a result, we account for our equity forward contracts as derivatives in accordance with SFAS No. 133
and mark them to market through earnings. They do not qualify as effective SFAS No. 133 hedges, as
a requirement to achieve hedge accounting is the hedged item must impact net income and the
settlement of these contracts through the purchase of our own stock does not impact net income. The
Company settled all of its equity forward contracts in January 2008.
16
17. The table below quantifies the adjustments for derivative accounting under SFAS No. 133 on net
income for the quarters ended March 31, 2008, December 31, 2007 and March 31, 2007, when
compared with the accounting principles employed in all years prior to the SFAS No. 133
implementation.
Quarters ended
March 31, December 31, March 31,
2008 2007 2007
“Core Earnings” derivative adjustments:
Gains (losses) on derivative and hedging activities, net, included
in other income(1) . . . . . . . . . . . . . . . . . . . . . . . . . . . . . . . . . $(273) $(1,338) $(357)
Less: Realized (gains) losses on derivative and hedging
activities, net(1) . . . . . . . . . . . . . . . . . . . . . . . . . . . . . . . . . . . (91) (61) 25
Unrealized gains (losses) on derivative and hedging activities,
net . . . . . . . . . . . . . . . . . . . . . . . . . . . . . . . . . . . . . . . . . . . . (364) (1,399) (332)
Other pre-SFAS No. 133 accounting adjustments . . . . . . . . . . . . 1 2 —
Total net impact of SFAS No. 133 derivative accounting . . . . . . $(363) $(1,397) $(332)
(1)
See “Reclassification of Realized Gains (Losses) on Derivative and Hedging Activities” below for a detailed breakdown of
the components of realized losses on derivative and hedging activities.
Reclassification of Realized Gains (Losses) on Derivative and Hedging Activities
SFAS No. 133 requires net settlement income/expense on derivatives and realized gains/losses related
to derivative dispositions (collectively referred to as “realized gains (losses) on derivative and hedging
activities”) that do not qualify as hedges under SFAS No. 133 to be recorded in a separate income
statement line item below net interest income. The table below summarizes the realized losses on
derivative and hedging activities, and the associated reclassification on a “Core Earnings” basis for the
quarters ended March 31, 2008, December 31, 2007 and March 31, 2007.
Quarters ended
March 31, December 31, March 31,
2008 2007 2007
Reclassification of realized gains (losses) on derivative and
hedging activities:
Net settlement expense on Floor Income Contracts reclassified
to net interest income . . . . . . . . . . . . . . . . . . . . . . . . . . . . . . $(140) $ (37) $ (7)
Net settlement income (expense) on interest rate swaps
reclassified to net interest income . . . . . . . . . . . . . . . . . . . . . 231 95 (18)
Net realized gains (losses) on terminated derivative contracts
reclassified to other income . . . . . . . . . . . . . . . . . . . . . . . . . . — 3 —
Total reclassifications of realized (gains) losses on derivative
and hedging activities . . . . . . . . . . . . . . . . . . . . . . . . . . . . . . 91 61 (25)
Add: Unrealized gains (losses) on derivative and hedging
activities, net(1) . . . . . . . . . . . . . . . . . . . . . . . . . . . . . . . . . . . (364) (1,399) (332)
Gains (losses) on derivative and hedging activities, net . . . . . . . $(273) $(1,338) $(357)
(1)
“Unrealized gains (losses) on derivative and hedging activities, net” comprises the following unrealized mark-to-market
gains (losses):
Quarters ended
March 31, December 31, March 31,
2008 2007 2007
Floor Income Contracts . . . . . . . . . . . . . . . . . . . . . . . . . . . . . . . . . . $(295) $ (145) $ 5
Equity forward contracts . . . . . . . . . . . . . . . . . . . . . . . . . . . . . . . . . — (1,485) (412)
Basis swaps . . . . . . . . . . . . . . . . . . . . . . . . . . . . . . . . . . . . . . . . . (132) 206 60
Other . . . . . . . . . . . . . . . . . . . . . . . . . . . . . . . . . . . . . . . . . . . . . . 63 25 15
Total unrealized gains (losses) on derivative and hedging activities, net . . . $(364) $(1,399) $(332)
17
18. Unrealized gains and losses on Floor Income Contracts are primarily caused by changes in interest
rates. In general, an increase in interest rates results in an unrealized gain and vice versa. Unrealized
gains and losses on equity forward contracts fluctuate with changes in the Company’s stock price.
Unrealized gains and losses on basis swaps result from changes in the spread between indices,
primarily as it relates to Consumer Price Index (“CPI”) swaps economically hedging debt issuances
indexed to CPI and on changes in the forward interest rate curves that impact basis swaps hedging
repricing risk between quarterly reset debt and daily reset assets.
3) Floor Income: The timing and amount (if any) of Floor Income earned in our Lending operating
segment is uncertain and in excess of expected spreads. Therefore, we exclude such income from
“Core Earnings” when it is not economically hedged. We employ derivatives, primarily Floor Income
Contracts and futures, to economically hedge Floor Income. As discussed above in “Derivative
Accounting,” these derivatives do not qualify as effective accounting hedges, and therefore, under
GAAP, they are marked-to-market through the “gains (losses) on derivative and hedging activities,
net” line in the consolidated statement of income with no offsetting gain or loss recorded for the
economically hedged items. For “Core Earnings,” we reverse the fair value adjustments on the Floor
Income Contracts and futures economically hedging Floor Income and include the amortization of net
premiums received in income.
The following table summarizes the Floor Income adjustments in our Lending operating segment for
the quarters ended March 31, 2008, December 31, 2007 and March 31, 2007.
Quarters ended
March 31, December 31, March 31,
2008 2007 2007
“Core earnings” Floor Income adjustments:
Floor Income earned on Managed loans, net of payments on
Floor Income Contracts . . . . . . . . . . . . . . . . . . . . . . . . . . . . . $ 32 $— $—
Amortization of net premiums on Floor Income Contracts and
futures in net interest income . . . . . . . . . . . . . . . . . . . . . . . . (38) (50) (39)
Total “Core Earnings” Floor Income adjustments . . . . . . . . . . . . $ (6) $(50) $(39)
4) Acquired Intangibles: Our “Core Earnings” exclude goodwill and intangible impairment and the
amortization of acquired intangibles. For the quarters ended March 31, 2008, December 31, 2007 and
March 31, 2007, goodwill and intangible impairment and the amortization of acquired intangibles
totaled $15 million, $53 million and $24 million, respectively. The changes from the prior periods are
mostly due to the amounts of impairment recognized. In the fourth quarter of 2007, we recognized
impairments related principally to our mortgage origination and mortgage purchased paper businesses
including approximately $20 million of goodwill and $10 million of value attributed to certain banking
relationships. In the first quarter of 2007, we recognized intangible impairments of $9 million in
connection with certain tax exempt bonds previously acquired through the purchase of certain
subsidiaries. We did not recognize any impairment in the first quarter of 2008.
18
19. LENDING BUSINESS SEGMENT
In our Lending business segment, we originate and acquire federally guaranteed student loans and Private
Education Loans, which are not federally guaranteed. The majority of our Private Education Loans is made in
conjunction with a FFELP Stafford loan and as a result is marketed through the same marketing channels as
FFELP Stafford loans. While FFELP loans and Private Education Loans have different overall risk profiles
due to the federal guarantee of the FFELP loans, they share many of the same characteristics such as similar
repayment terms, the same marketing channel and sales force, and are originated and serviced on the same
servicing platform. Finally, where possible, the borrower receives a single bill for both FFELP and Private
Education Loans.
The following table includes “Core Earnings” results for our Lending business segment.
Quarters ended
March 31, December 31, March 31,
2008 2007 2007
“Core Earnings” interest income:
FFELP Stafford and Other Student Loans . . . . . . . . . . . . . . . . . . . . . $ 494 $ 705 $ 695
FFELP Consolidation Loans . . . . . . . . . . . . . . . . . . . . . . . . . . . . . . . 989 1,355 1,331
Private Education Loans . . . . . . . . . . . . . . . . . . . . . . . . . . . . . . . . . . 749 731 658
Other loans . . . . . . . . . . . . . . . . . . . . . . . . . . . . . . . . . . . . . . . . . . . . 23 25 28
Cash and investments . . . . . . . . . . . . . . . . . . . . . . . . . . . . . . . . . . . . 142 273 162
Total “Core Earnings” interest income. . . . . . . . . . . . . . . . . . . . . . . . . . 2,397 3,089 2,874
Total “Core Earnings” interest expense . . . . . . . . . . . . . . . . . . . . . . . . . 1,824 2,471 2,220
Net “Core Earnings” interest income . . . . . . . . . . . . . . . . . . . . . . . . . . . 573 618 654
Less: provisions for loan losses . . . . . . . . . . . . . . . . . . . . . . . . . . . . . . . 181 750 198
Net “Core Earnings” interest income (loss) after provisions for loan
losses . . . . . . . . . . . . . . . . . . . . . . . . . . . . . . . . . . . . . . . . . . . . . . . . 392 (132) 456
Other income . . . . . . . . . . . . . . . . . . . . . . . . . . . . . . . . . . . . . . . . . . . . 44 44 44
Restructuring expenses . . . . . . . . . . . . . . . . . . . . . . . . . . . . . . . . . . . . . 15 19 —
Operating expenses. . . . . . . . . . . . . . . . . . . . . . . . . . . . . . . . . . . . . . . . 164 172 171
Total expenses . . . . . . . . . . . . . . . . . . . . . . . . . . . . . . . . . . . . . . . . . . . 179 191 171
Income (loss) before income taxes . . . . . . . . . . . . . . . . . . . . . . . . . . . . 257 (279) 329
Income tax expense (benefit) . . . . . . . . . . . . . . . . . . . . . . . . . . . . . . . . 94 (103) 122
“Core Earnings” net income (loss) . . . . . . . . . . . . . . . . . . . . . . . . . . . . $ 163 $ (176) $ 207
Net Interest Income
Changes in net interest income are primarily due to fluctuations in the student loan and other asset spread
discussed below, the growth of our student loan portfolio, and changes in the level of cash and investments we
hold on our balance sheet for liquidity purposes.
19