1. Financial Data 2006 – 1996
Leggett & Platt, Incorporated
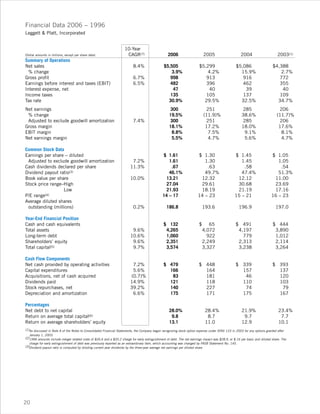
10-Year
(Dollar amounts in millions, except per share data) CAGR(7) 2006 2005 2004 2003(1)
Summary of Operations
Net sales 8.4% $5,505 $5,299 $5,086 $4,388
% change 3.9% 4.2% 15.9% 2.7%
Gross profit 6.7% 998 913 916 772
Earnings before interest and taxes (EBIT) 6.5% 482 396 462 355
Interest expense, net 47 40 39 40
Income taxes 135 105 137 109
Tax rate 30.9% 29.5% 32.5% 34.7%
Net earnings 300 251 285 206
% change 19.5% (11.9)% 38.6% (11.7)%
Adjusted to exclude goodwill amortization 7.4% 300 251 285 206
Gross margin 18.1% 17.2% 18.0% 17.6%
EBIT margin 8.8% 7.5% 9.1% 8.1%
Net earnings margin 5.5% 4.7% 5.6% 4.7%
Common Stock Data
Earnings per share – diluted $ 1.61 $ 1.30 $ 1.45 $ 1.05
Adjusted to exclude goodwill amortization 7.2% 1.61 1.30 1.45 1.05
Cash dividends declared per share 11.3% .67 .63 .58 .54
Dividend payout ratio(3) 46.1% 49.7% 47.4% 51.3%
Book value per share 10.0% 13.21 12.32 12.12 11.00
Stock price range–High 27.04 29.61 30.68 23.69
Low 21.93 18.19 21.19 17.16
P/E range(4) 14 – 17 14 – 23 15 – 21 16 – 23
Average diluted shares
outstanding (millions) 0.2% 186.8 193.6 196.9 197.0
Year-End Financial Position
Cash and cash equivalents $ 132 $ 65 $ 491 $ 444
Total assets 9.6% 4,265 4,072 4,197 3,890
Long-term debt 10.6% 1,060 922 779 1,012
Shareholders’ equity 9.6% 2,351 2,249 2,313 2,114
Total capital(5) 9.7% 3,574 3,327 3,238 3,264
Cash Flow Components
Net cash provided by operating activities 7.2% $ 479 $ 448 $ 339 $ 393
Capital expenditures 5.6% 166 164 157 137
Acquisitions, net of cash acquired (0.7)% 83 181 46 120
Dividends paid 14.9% 121 118 110 103
Stock repurchases, net 39.2% 140 227 74 79
Depreciation and amortization 6.6% 175 171 175 167
Percentages
Net debt to net capital 28.0% 28.4% 21.9% 23.4%
Return on average total capital(6) 9.8 8.7 9.7 7.7
Return on average shareholders’ equity 13.1 11.0 12.9 10.1
(1)As discussed in Note A of the Notes to Consolidated Financial Statements, the Company began recognizing stock option expense under SFAS 123 in 2003 for any options granted after
January 1, 2003.
(2)1996 amounts include merger related costs of $26.6 and a $20.2 charge for early extinguishment of debt. The net earnings impact was $28.9, or $.16 per basic and diluted share. The
charge for early extinguishment of debt was previously reported as an extraordinary item, which accounting was changed by FASB Statement No. 145.
(3)Dividend payout ratio is computed by dividing current year dividends by the three-year average net earnings per diluted share.
20