Governor Olli Rehn: Dialling back monetary restraint
ecolab 2_DscrptBusnFinHighlight
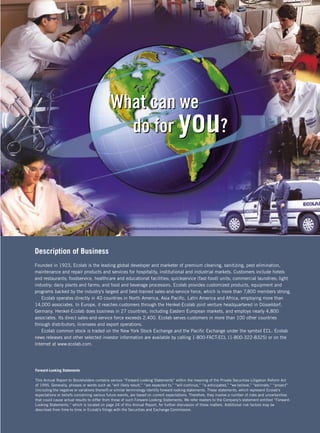
1. What can we
you?
do for
Description of Business
Founded in 1923, Ecolab is the leading global developer and marketer of premium cleaning, sanitizing, pest elimination,
maintenance and repair products and services for hospitality, institutional and industrial markets. Customers include hotels
and restaurants; foodservice, healthcare and educational facilities; quickservice (fast-food) units; commercial laundries; light
industry; dairy plants and farms; and food and beverage processors. Ecolab provides customized products, equipment and
programs backed by the industry’s largest and best-trained sales-and-service force, which is more than 7,800 members strong.
Ecolab operates directly in 40 countries in North America, Asia Pacific, Latin America and Africa, employing more than
14,000 associates. In Europe, it reaches customers through the Henkel-Ecolab joint venture headquartered in Düsseldorf,
Germany. Henkel-Ecolab does business in 27 countries, including Eastern European markets, and employs nearly 4,800
associates. Its direct sales-and-service force exceeds 2,400. Ecolab serves customers in more than 100 other countries
through distributors, licensees and export operations.
Ecolab common stock is traded on the New York Stock Exchange and the Pacific Exchange under the symbol ECL. Ecolab
news releases and other selected investor information are available by calling 1-800-FACT-ECL (1-800-322-8325) or on the
Internet at www.ecolab.com.
Forward-Looking Statements
This Annual Report to Stockholders contains various “Forward-Looking Statements” within the meaning of the Private Securities Litigation Reform Act
of 1995. Generally, phrases or words such as “will likely result,” “are expected to,” “will continue,” “is anticipated,” “we believe,” “estimate,” “project”
(including the negative or variations thereof) or similar terminology identify forward-looking statements. These statements, which represent Ecolab’s
expectations or beliefs concerning various future events, are based on current expectations. Therefore, they involve a number of risks and uncertainties
that could cause actual results to differ from those of such Forward-Looking Statements. We refer readers to the Company’s statement entitled “Forward-
Looking Statements,” which is located on page 24 of this Annual Report, for further discussion of these matters. Additional risk factors may be
described from time to time in Ecolab’s filings with the Securities and Exchange Commission.
2. Financial
highlights
Percent Change
2000 2000
(thousands, except per share) 1999 1998 1999
$2,264,313 9%
Net Sales $2,080,012 $1,888,226 10%
197,878* 13
Income from Continuing Operations Before Unusual Items 175,786 154,506 14
8.7%
Percent of Sales 8.5% 8.2%
1.50* 15
Diluted Income Per Common Share 1.31 1.15 14
131,946 (2)
Diluted Weighted-Average Common Shares Outstanding 134,419 134,047 –
0.490 13
Cash Dividends Declared per Common Share 0.435 0.390 12
315,486 7
Cash Provided by Continuing Operating Activities 293,494 274,529 7
150,009 3
Capital Expenditures 145,622 147,631 (1)
757,007 (1)
Shareholders’ Equity 762,016 690,541 10
26.0%
Return on Beginning Equity 25.5% 28.0%
370,969 32
Total Debt 281,074 295,032 (5)
32.9%
Total Debt to Capitalization 26.9% 29.9%
$1,714,011 8%
Total Assets $1,585,946 $1,470,995 8%
Net Sales (Dollars in Millions) Income (Dollars in Millions) Contents
$2,264 $198*
Financial Highlights, 11
$2,080 $176
$1,888
$155 Shareholders Letter, 12
$1,640
$134
$1,490
Operations Review, 16
$113
Financial Report, 24
Board of Directors and Officers, 52
Shareholder Information and Services, 53
Business Overview, gatefold-back cover
1996 1997 1998 1999 2000 1996 1997 1998 1999 2000
Diluted Income per Share (Dollars) Dividends Declared per Share (Dollars)
$1.50* $0.490
All product names and certain informa-
$0.435
$1.31
$0.390
$1.15 tion appearing in italic type in the text
$0.335
$1.00
$0.290 of this annual report are trademarks,
$0.85
brand names, service marks or copyright
material of Ecolab Inc., Kay Chemical
Ecolab 2000 Annual Report
Company or Henkel-Ecolab.
1996 1997 1998 1999 2000 1996 1997 1998 1999 2000
*Excludes a net gain of $8.2 million, or $0.06 per diluted share for unusual items in 2000: gain on
the sale of the Jackson business, restructuring expenses and cumulative effect of change in accounting
for revenue recognition. Net income for 2000 was $206,127, or $1.56 per diluted share.
11