Beginners Guide to TikTok for Search - Rachel Pearson - We are Tilt __ Bright...
Municipal Municipal Issuance Survey2010 20091207 Sifma
1. SIFMA 2010 Municipal Issuance Survey
Introduction
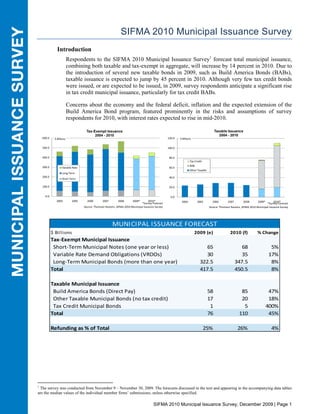
Respondents to the SIFMA 2010 Municipal Issuance Survey1 forecast total municipal issuance,
combining both taxable and tax-exempt in aggregate, will increase by 14 percent in 2010. Due to
the introduction of several new taxable bonds in 2009, such as Build America Bonds (BABs),
taxable issuance is expected to jump by 45 percent in 2010. Although very few tax credit bonds
were issued, or are expected to be issued, in 2009, survey respondents anticipate a significant rise
in tax credit municipal issuance, particularly for tax credit BABs.
Concerns about the economy and the federal deficit, inflation and the expected extension of the
Build America Bond program, featured prominently in the risks and assumptions of survey
respondents for 2010, with interest rates expected to rise in mid-2010.
Tax-Exempt Issuance Taxable Issuance
2004 - 2010 2004 - 2010
600.0 $ Billions 120.0 $ Billions
500.0 100.0
400.0 80.0
Tax Credit
300.0 BAB
Varable Rate 60.0
Other Taxable
Long Term
200.0 40.0
Short Term
100.0 20.0
0.0 0.0
2004 2005 2006 2007 2008 2009* 2010* 2004 2005 2006 2007 2008 2009* 2010*
*Survey Forecast *Survey Forecast
Source: Thomson Reuters, SIFMA 2010 Municipal Issuance Survey Source: Thomson Reuters, SIFMA 2010 Municipal Issuance Survey
MUNICIPAL ISSUANCE FORECAST
$ Billions 2009 (e) 2010 (f) % Change
Tax-Exempt Municipal Issuance
Short-Term Municipal Notes (one year or less) 65 68 5%
Variable Rate Demand Obligations (VRDOs) 30 35 17%
Long-Term Municipal Bonds (more than one year) 322.5 347.5 8%
Total 417.5 450.5 8%
Taxable Municipal Issuance
Build America Bonds (Direct Pay) 58 85 47%
Other Taxable Municipal Bonds (no tax credit) 17 20 18%
Tax Credit Municipal Bonds 1 5 400%
Total 76 110 45%
Refunding as % of Total 25% 26% 4%
1
The survey was conducted from November 9 – November 30, 2009. The forecasts discussed in the text and appearing in the accompanying data tables
are the median values of the individual member firms’ submissions, unless otherwise specified.
SIFMA 2010 Municipal Issuance Survey, December 2009 | Page 1
2. Issuance Forecast Highlights
The SIFMA 2010 Municipal Issuance Survey (Survey) projects tax-exempt municipal issuance
will total $450.5 billion in 2010, a 7.9 percent rise from $418 billion estimated for 2009, with
increased issuance in all categories. Long-term tax-exempt municipal issuance is projected to be
$347.5 billion in 2010, up 7.8 percent from the $323 billion estimate for 20092, while short-term
issuance is projected to increase to $68 billion in 2010 from $65 billion for 2009.3 Variable rate
demand obligation (VRDO) issuance is projected to be $35 billion in 2010, a 16.7 percent
increase from the $30 billion estimate for 2009.4
On the taxable side, the Survey projects direct pay BAB issuance will be $85 billion in 2010, a
46.6 percent increase from the estimated $58 billion total in 2009.5 Other taxable municipal bond
issuance, which excludes tax credit bonds, is forecast to be $20 billion in 2010, a 17.6 percent
increase from the $17 billion estimate in 2009.6
Tax credit municipal bond issuance is projected to be $5 billion in 2010, five times the $1 billion
estimate for 2009.7 Although virtually no tax credit Build America Bonds were issued in 2009,
respondents expect tax credit BABs to be the largest issuance type of tax credit municipal bond in
2010, followed by qualified school construction bonds (QSCBs), clean renewable energy bonds
(CREBs), and qualified zone academy bonds (QZABs).
Refundings are expected to account for 25 percent of total municipal issuance in 2009 and are
forecast to rise slightly to 26 percent in 2010.8
Over 80 percent of Survey respondents agreed that the largest issuing use-of-proceeds sector
would be general purpose bonds in both 2009 and 2010, with a very small minority expecting
transportation or education to be the largest sectors instead for both 2009 and 2010. In prior years,
both the general purpose and education sectors have been the largest issuing sectors.
TOP ISSUING SECTOR
2004 General Purpose
2005 Education
2006 Education
2007 General Purpose
2008 Education
2009* General Purpose
2010* General Purpose
Source: Thomson Reuters, SIFMA Municipal Issuance Survey
*Survey estimate
When asked about risks and assumptions underlying their forecasts, over half of the Survey
respondents answering this question indicated that the extension of the BAB program past its
current scheduled December 2010 expiry was an important assumption in their issuance forecasts.
The absence of significant additional federal stimulus programs or other federal legislation
affecting municipal issuance or the value of tax-exempt bonds were also mentioned.
2
Survey estimates for long-term municipal bonds ranged from $250 to $400 billion for 2009 and from $250 to $552 billion for 2010.
3
Survey estimates for short-term municipal notes ranged from $50 to $73 billion for 2009 and from $50 to $100 billion for 2010.
4
Survey estimates for variable rate demand obligations ranged from $27 to $120 billion for 2009 and from $20 to $150 billion for 2010.
5
Survey estimates for direct pay Build America Bonds ranged from $40 to $80 billion for 2009 and from $60 to $160 billion for 2010.
6
Survey estimates for other taxable municipal bond issuance (excluding tax credit) ranged from $1 to $20 billion for 2009 and from $3 to $35 billion
for 2010.
7
Survey estimates for tax credit municipal bonds ranged from $47 million to $7 billion for 2009 and from $75 million to $20 billion in 2010.
8
Survey estimates for refunding ranged from 10 to 40 percent for 2009 and from 8 to 45 percent for 2010.
SIFMA 2010 Municipal Issuance Survey, December 2009 | Page 2
3. Interest Rate Forecast Highlights
Interest Rates 10 Year AAA G.O. Muni to 10Y Treasury
5.0
Dec. 2008 - Dec. 2010 Dec. 2008 - Dec. 2010
Percent 180
4.5
160
4.0
3.5
140
3.0
2.5 Federal Funds Target Rate 120
2.0 2Y Treasury note yield
10Y Treasury bond yield 100
1.5
1.0
80
0.5 10Y AAA G.O. Muni to 10Y Treasury
yield
0.0 60
Dec-08 Mar-09 Jun-09 Sep-09 Dec-09 Mar-10 Jun-10 Sep-10 Dec-10 Dec-08 Mar-09 Jun-09 Sep-09 Dec-09 Mar-10 Jun-10 Sep-10 Dec-10
Sources: Federal Reserve, SIFMA 2010 Municipal Issuance Survey Sources: Bloomberg, SIFMA 2010 Municipal Issuance Survey
Survey respondents offered relatively uniform views on interest rates in the coming year,
expecting a gradual rise in early 2010 due to slight inflationary pressures and an improving
economy, beginning with increases to the 2-year and 10-year Treasury yields, followed by the
federal funds target rate.
The two-year Treasury note yield is expected to rise in early 2010, with respondents forecasting
the yield to be 1.05 percent at end-March 30, 1.36 percent by end-June, 1.8 percent at end-
September and 2.0 percent by year-end.9 The 10-year Treasury note yield is also expected to
begin rising in the first quarter of 2010, with yields forecast to be 3.75 at end-March, 3.29 percent
at end-in June, 3.98 percent at end-September, and 4.38 percent by year-end.10 The federal funds
target rate is expected to stay low throughout the first half of next year, rising to 0.5 percent in the
third quarter and then 1.0 percent by the end of 2010.
The ratio of the yield on AAA G.O. municipal securities to the 10-year Treasury benchmark was
expected to decrease slightly, returning ratios to where they were before the credit crisis. For the
months of March, June, September and December 2010, respondents expect the ratio to be 85
percent, 87 percent, 84 percent, and 80 percent respectively as the 10-year Treasury yield
continues its trend higher.
The noted risks to the interest rate forecast are all on the upside. Over half of the Survey
respondents answering this question expressed some concern over inflation; however, one
respondent noted that “until capacity utilization rises, there is still plenty of room for expansion to
keep inflation low.” Others stated concern over the size of the federal deficit and expected
borrowing needs to play a risk as well.
9
The two-year Treasury note yield averaged 0.77 percent during the survey period, November 9 through November 30, 2009.
10
The 10-year Treasury note yield averaged 3.4 percent during the survey period, November 9 through November 30, 2009.
SIFMA 2010 Municipal Issuance Survey, December 2009 | Page 3
4. PARTICIPANTS11
Barclays Capital
Citigroup Inc.
Estrada Hinojosa
First Southwest Company
Goldman, Sachs & Co.
Herbert J. Sims & Co., Inc.
Janney Montgomery Scott Inc.
Jefferies & Company, Inc.
Lebenthal & Co., LLC
Morgan Stanley
M.R. Beal & Co.
Raymond James & Associates, Inc.
Roosevelt & Cross, Inc.
Sterne Agee
Stone & Youngberg LLC
11
Multiple responses may be received from a single firm and were counted as separate responses for the purposes of this survey.
SIFMA 2010 Municipal Issuance Survey, December 2009 | Page 4
5. RESEARCH
Kyle Brandon
Managing Director, Director of Research
kbrandon@sifma.org
Sharon Sung
Research Analyst, Research
ssung@sifma.org
SURVEYS
Nancy Cosentino
Manager, Surveys
ncosentino@sifma.org
MUNICIPAL DIVISION
Leslie Norwood
Managing Director, Assistant General Counsel
lnorwood@sifma.org
Michael Decker
Managing Director
mdecker@sifma.org
Leon J. Bijou
Managing Director, Associate General Counsel
lbijou@sifma.org
The Securities Industry and Financial Markets Association (SIFMA) prepared this material for informational
purposes only. SIFMA obtained this information from multiple sources believed to be reliable as of the date
of publication; SIFMA, however, makes no representations as to the accuracy or completeness of such third
party information. SIFMA has no obligation to update, modify or amend this information or to otherwise
notify a reader thereof in the event that any such information becomes outdated, inaccurate, or incomplete.
SIFMA 2010 Municipal Issuance Survey, December 2009 | Page 5