1. eBay EBAY MARKETPLACES
Average Selling Price of Merchandise on
ANALYSIS for NASDAQ : EBAY MARCH 15, 2011 eBay 4
eBay Transaction Take Rate 5
Listings-to-Sales Conversion Rate for
Merchandise on eBay 6
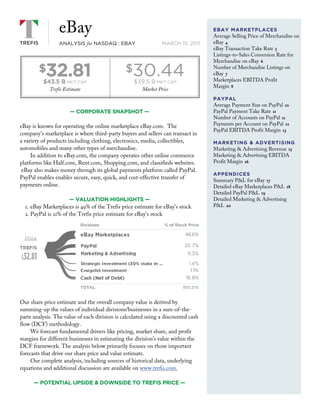
$ 32.81
$43.5 B MKT CAP
$ 30.44
$39.5 B MKT CAP
Number of Merchandise Listings on
eBay 7
Marketplaces EBITDA Profit
Margin 8
Trefis Estimate Market Price
PAYPAL
Average Payment Size on PayPal 10
— CORPORATE SNAPSHOT — PayPal Payment Take Rate 11
Number of Accounts on PayPal 11
eBay is known for operating the online marketplace eBay.com. The Payments per Account on PayPal 12
PayPal EBITDA Profit Margin 13
company's marketplace is where third-party buyers and sellers can transact in
a variety of products including clothing, electronics, media, collectibles, MARKETING & ADVERTISING
automobiles and many other types of merchandise. Marketing & Advertising Revenue 15
In addition to eBay.com, the company operates other online commerce Marketing & Advertising EBITDA
platforms like Half.com, Rent.com, Shopping.com, and classifieds websites. Profit Margin 16
eBay also makes money through its global payments platform called PayPal.
APPENDICES
PayPal enables enables secure, easy, quick, and cost-effective transfer of Summary P&L for eBay 17
payments online. Detailed eBay Marketplaces P&L 18
Detailed PayPal P&L 19
— VALUATION HIGHLIGHTS — Detailed Marketing & Advertising
1. eBay Marketplaces is 49% of the Trefis price estimate for eBay's stock P&L 20
2. PayPal is 21% of the Trefis price estimate for eBay's stock
Our share price estimate and the overall company value is derived by
summing-up the values of individual divisions/businesses in a sum-of-the-
parts analysis. The value of each division is calculated using a discounted cash
flow (DCF) methodology.
We forecast fundamental drivers like pricing, market share, and profit
margins for different businesses in estimating the division’s value within the
DCF framework. The analysis below primarily focuses on those important
forecasts that drive our share price and value estimate.
Our complete analysis, including sources of historical data, underlying
equations and additional discussion are available on www.trefis.com.
— POTENTIAL UPSIDE & DOWNSIDE TO TREFIS PRICE —
2. Below are key drivers of eBay's value that present opportunities for upside or
downside to the current Trefis price estimate for eBay:
eBay Marketplaces
• eBay Transaction Take Rate: We currently forecast take rate, eBay's
commission on items sold, to decrease from about 8% in 2010 to 7.1% by
the end of the Trefis forecast period. There could be 6% upside to the
Trefis price estimate if take rate were to remain flat at around 8%.
• Marketplaces EBITDA Profit Margin: We currently forecast
marketplaces margin to increase from about 34% in 2010 to nearly 36% by
the end of the Trefis forecast period. There could be 17% upside to the
Trefis price estimate if margin were to rebound to 2005 levels of about
46%. On the other hand, there could be 13% downside to the Trefis
price estimate if margins continued falling, reaching 20% by the end of
the Trefis forecast period.
PayPal
• Payments per Account on PayPal: We currently forecast that the
average number of payments per PayPal account will remain flat at
around 1.3. There could be 9% upside to the Trefis price estimate if
payments were to rebound to 2005 levels of 1.7 payments per account.
On the other hand, there could be 16% downside to the Trefis price
estimate if payments per PayPal account fell to 0.5 by the end of the
Trefis forecast period.
• PayPal EBITDA Profit Margin: We currently forecast PayPal margins
to increase from about 18% in 2010 to 24% by the end of the Trefis
forecast period. There could be 12% downside to the Trefis price
estimate if margins fell to 2009 levels of 9%.
For additional details, select a driver above or select a division from the
interactive Trefis split for eBay at the top of the page.
— SOURCES OF VALUE —
We estimate that eBay Marketplaces is the most valuable segment for the
following reasons:
Marketplaces' Take Rate Higher than PayPal Take Rate
The take rate represents the average commission made by eBay on
transactions. We estimate eBay's take rate for items sold through its
marketplaces to be around 8% by 2010 compared to a PayPal take rate of 3.6%
in the same period.
Marketplaces' Margins Higher than PayPal Margins
We estimate that eBay Marketplaces will have operating margins of around
34% by 2010. In comparison, we estimate that PayPal will have 18% operating
margins by 2010.
TREFIS ANALYSIS for EBAY CONTENT@TREFIS.COM + 1 617 394 8763 •2
3. — KEY TRENDS —
Focus on Increasing Conversion Rate
Conversion rate is a key focus area for eBay, as it seeks to increase the success
of sellers in converting listed items to sold items. eBay has implemented a
number of features to increase the conversion rate on Marketplaces. One of
the more important changes they've made is improving functionality and
stepping up efforts related to Trust and Safety.
Growing PayPal User Base
PayPal users will continue to grow as eBay continues to integrate Paypal into
its adjacent Marketplaces platforms like Shopping.com and Rent.com--and
through increased penetration of PayPal on third party merchant platforms,
as eBay increases its focus on SMEs.
Increasing Payments Competition
Google Checkout and credit card merchants will limit eBay's ability to
increase revenues by increasing its commission on PayPal transactions ("take
rate").
TREFIS ANALYSIS for EBAY CONTENT@TREFIS.COM + 1 617 394 8763 •3
4. eBay Marketplaces
The eBay Marketplaces division constitutes 48.6% of our $32.81 price estimate for this stock, based on our sum of the parts
analysis.The most important drivers for the eBay Marketplaces business are:
• Average Selling Price of Merchandise on eBay
• eBay Transaction Take Rate
• Listings-to-Sales Conversion Rate for Merchandise on eBay
• Number of Merchandise Listings on eBay
• Marketplaces EBITDA Profit Margin
— AVERAGE SELLING PRICE OF MERCHANDISE ON EBAY —
This represents the average sale price of items sold on eBay's properties including eBay.com, Half.com, Rent.com and
Shopping.com. The average price incorporates the wide range of prices found on eBay--from low priced merchandise to
expensive electronics, motor vehicles, and boats.
Average Selling Price of Merchandise on eBay ($)
60
50
40
30
20
10
0
2007 2008 2009 2010 2011 2012 2013 2014 2015 2016 2017
Average Selling Price of Merchandise on eBay has declined from around $60 in 2007 to $51 in 2009. We expect the same
dynamic to decline for 2010 before picking up again.
Forecast Rationale
1. WEAK ECONOMY IS FORCING CONSUMERS TO TRADE DOWN ON PURCHASES
We believe that selling prices may decline significantly in 2010 (more in International markets), as users continue to
trade down their purchases. Prices may snap back in 2011 and increase gradually afterward.
2. AVERAGE PRICES ARE A FUNCTION OF THE MIX OF ITEMS SOLD
Average Selling Price of Merchandise on eBay is also a function of the mix of items listed and sold on the platform.
Average Selling Price of Merchandise on eBay was impacted negatively in 2009, as higher priced auto sales were
TREFIS ANALYSIS for EBAY CONTENT@TREFIS.COM + 1 617 394 8763 •4
5. decimated by macroeconomic factors and declines in consumer spending.
Sources for historical data and explanations can be found on the Trefis.com website (link)
— EBAY TRANSACTION TAKE RATE —
The eBay Transaction Take Rate represents eBay's commission on items sold. Take rates are primarily a function of
pricing actions initiated by eBay to drive higher-priced listings and higher conversion rates on their platforms.
eBay Transaction Take Rate (%)
7.5
5.0
2.5
0.0
2007 2008 2009 2010 2011 2012 2013 2014 2015 2016 2017
After experiencing growth in prior years, eBay witnessed a stagnation in its take rate in 2008 and 2009 due to weak
economy and competition. We expect the eBay Transaction Take Rate to increase.
Forecast Rationale
1. EBAY'S VOLUME VS. PRICING DECISIONS
There is a strategic trade-off between between volume and price. eBay has shown the willingness to use pricing as a
means to bring more sellers on board, as well as to provide incentives for sellers to enhance the user experience by
engaging in safer, simpler transactions. We expect that to continue to be the case.
2. MIX OF THE PRODUCTS SOLD
Higher priced products have lower take rates
3. MORE COMPETITION
We expect Amazon--as well as brick and mortar stalwarts like Wal-Mart--to make continued efforts to expand and
improve their online presence.
4. MORE DISCOUNTS TO POWERSELLERS
We expect eBay to continue providing more discounts to powersellers, as they improve their service levels.
Sources for historical data and explanations can be found on the Trefis.com website (link)
TREFIS ANALYSIS for EBAY CONTENT@TREFIS.COM + 1 617 394 8763 •5
6. — LISTINGS-TO-SALES CONVERSION RATE FOR MERCHANDISE ON EBAY —
This represents the percentage of items for sale listed on eBay that are actually sold. If the conversion rate is increasing
while total listings remain the same or continue to increase, this means that the number of items sold on eBay has
increased
Listings-to-Sales Conversion Rate for Merchandise on eBay (%)
40
30
20
10
0
2007 2008 2009 2010 2011 2012 2013 2014 2015 2016 2017
Listings-to-Sales Conversion Rate for Merchandise on eBay has stayed more or less in a tight range of 39-43% over the
years. We would expect the conversion rates to stay stable going forward as well.
Forecast Rationale
Supporting:
1. REWARDS PROGRAMS LIKE EBAY BUCKS TO DRIVE SALES – eBay has introduced a few programs like the eBay Bucks (in
August 2010) in which shoppers can earn 2% of the purchase value of qualified items and are issued an eBay Bucks
certificate at the end of each quarter. This sum can then be redeemed within the next 30 days. According to the eBay
management, over three million shoppers have enrolled in the eBay Bucks program and spent five times more than
those not enrolled till October 2010. If eBay continues to come up with such innovative programs, this conversion
rate could actually increase in the future
2. ENHANCED CONSUMER EXPERIENCE DRIVEN BY RATINGS-BASED FEE INCENTIVES FOR SELLERS – DSR (Detailed Seller
Ratings) based fee incentives for sellers is motivating them to exceed buyer expectations in all respects, which creates
a positive feedback loop that brings more buyers on the site and leads to increasing conversion rates.
3. ENHANCED CONSUMER EXPERIENCE DRIVEN BY RATINGS-BASED FEE INCENTIVES FOR SELLERS
DSR (Detailed Seller Ratings) based fee incentives for sellers is motivating them to exceed buyer expectations in all
respects, which creates a positive feedback loop that brings more buyers on the site and leads to increasing conversion
rates.
4. AS EBAY ATTACKS FRAUD IN MORE EFFICIENT WAYS
eBay continuously updates its fraud detection software. For example, eBay can detect if someone is selling most items
significantly below the sticker prices. eBay has more robust authentication programs--especially for sellers of higher-
TREFIS ANALYSIS for EBAY CONTENT@TREFIS.COM + 1 617 394 8763 •6
7. valued goods. It can even gathers phone numbers, addresses, and credit reports if needed; and keeps on adding
features like password key chains to reduce instances of fraud on their platforms.
5. AS EBAY MAKES SEARCH ON ITS PLATFORM MORE EFFICIENT
Mitigating:
6. RISING CONVERSION RATES OF LISTINGS CAN LEAD TO MORE LISTINGS
Although the positive factors listed above may initially increase conversion rates, such initiatives over the long run
may not necessarily translate into a higher sales to listing ratio, since more listings are likely to be added, putting
downward pressure on the ratio.
Sources for historical data and explanations can be found on the Trefis.com website (link)
— NUMBER OF MERCHANDISE LISTINGS ON EBAY —
This represents the number of items for sale listed on eBay's properties including eBay.com, Half.com, and
Shopping.com.
Number of Merchandise Listings on eBay (Bil)
5
4
3
2
1
0
2007 2008 2009 2010 2011 2012 2013 2014 2015 2016 2017
The number of listings have increased from 2.4 million in 2006 to 2.9 million in 2009. We expect listings to grow.
Forecast Rationale
1. TRADITIONAL RETAILERS HAVE STARTED TO LIST THEIR MERCHANDISE ON EBAY – Traditional retail players like the
U.K.'s Saville Row, Jigsaw and Ed Hardy have started to list their merchandise on eBay website. We believe such
trend will benefit eBay by dramatically increasing its merchandise listings.
2. NUMBER OF INTERNET USERS CONTINUE TO GROW RAPIDLY – Global Internet-users have increased from 700 million
in 2003 to around 1.7 billion in 2009, and is expected to be around 2 billion by the end of 2010. We expect the rapid
increase of internet users in the future also.
TREFIS ANALYSIS for EBAY CONTENT@TREFIS.COM + 1 617 394 8763 •7
8. 3. ONLINE RETAILING CONTINUES TO GROW, AS IT STILL REPRESENTS LESS THAN 10% IN THE US AND 5%
INTERNATIONALLY OF TOTAL RETAIL SPENDING ON "ELECTRONICS AND GENERAL MERCHANDISE" – Online retail
penetration of Electronics and General Merchandise in the US in 2009 was around 10% having grown from 5% in
2004. We expect the penetration to continue to grow. Online retail penetration of Electronics and General
Merchandise outside the US in 2009 was around 5.7%, having more than doubled from 2.4% in 2004.
4. ACTIVE USERS ON THE SITE CONTINUE TO INCREASE – eBay had 90 million active users in 2009 as compared to just 48
million in 2004.
5. NUMBER OF LISTINGS PER ACTIVE USER CONTINUES TO INCREASE – The number of listings per active user has gone
up in response to efforts put in place by eBay to simplify the fee structure. eBay has made significant reductions in the
insertion fee for fixed price listings.
Sources for historical data and explanations can be found on the Trefis.com website (link)
— MARKETPLACES EBITDA PROFIT MARGIN —
Earnings Before Interest, Taxes, Depreciation and Amortization (EBITDA) are profits after factoring in typical expenses,
such as Cost of Goods and Services Sold, SG&A Expenses, and R&D Expenses. EBITDA Margin represents divisional
EBITDA as a percentage of divisional revenues. We adjust EBITDA figures to exclude non-recurring charges and non-
cash charges, such as Stock-Based Compensation Expenses.
Marketplaces EBITDA Profit Margin (%)
40
30
20
10
0
2007 2008 2009 2010 2011 2012 2013 2014 2015 2016 2017
Marketplaces EBITDA Profit Margin has been 30-36% in recent years. We expect Marketplaces EBITDA Profit Margin
to remain constant.
Forecast Rationale
1. CONTINUED TOUGH PRICING--AND THUS TAKE RATE DECREASES--SHOULD KEEP A LID ON MARKETPLACES MARGINS.
2. LACK OF OPERATING LEVERAGE – SG&A at least needs to keep pace with revenues, as growth moves away from
auctions to fixed-price formats, where the competition is much stiffer.
TREFIS ANALYSIS for EBAY CONTENT@TREFIS.COM + 1 617 394 8763 •8
9. 3. PRICING WILL FIX THE SELLER SIDE OF THE TRANSACTION FOR EBAY – Lower fees will drive an increase in sellers
and listings. However, to drive conversion of those listings into eventual sales, eBay has a lot of work ahead to
facilitate a more enriched buyer experience on the site, which would mean continued investments in R&D to improve
the Finding facility on its platforms or to enhance its safety and trust features.
Sources for historical data and explanations can be found on the Trefis.com website (link)
2007 2008 2009 2010 2011 2012 2013 2014 2015 2016 2017
Total Revenue (Bil $) 4.68 4.71 4.46 4.80 5.17 5.57 6.00 6.46 6.96 7.50 8.08
Direct Expense (Bil $) 2.61 3.03 3.08 3.12 3.32 3.57 3.78 4.08 4.39 4.73 5.10
Indirect Expense (Bil $) 0.35 1.02 0.34 0.79 0.67 0.76 0.85 0.93 1.01 1.13 1.23
Gross Profit (Bil $) 2.07 1.68 1.38 1.68 1.86 2.00 2.21 2.38 2.57 2.77 2.98
Free Cash Flow (Bil $) N/A N/A N/A N/A 1.19 1.24 1.36 1.46 1.55 1.64 1.76
In addition, you can see the detailed P&L for the eBay Marketplaces business in the Appendix (link)
TREFIS ANALYSIS for EBAY CONTENT@TREFIS.COM + 1 617 394 8763 •9
10. PayPal
The most important drivers for the PayPal business are:
• Average Payment Size on PayPal
• PayPal Payment Take Rate
• Number of Accounts on PayPal
• Payments per Account on PayPal
• PayPal EBITDA Profit Margin
— AVERAGE PAYMENT SIZE ON PAYPAL —
This represents the average size of each transaction carried out through Paypal.
Average Payment Size on PayPal ($)
70
60
50
40
30
20
10
0
2007 2008 2009 2010 2011 2012 2013 2014 2015 2016 2017
Average Payment Size on PayPal declined from a peak of $68.02 in 2007 to $64.09 in 2009, owing to weak economy. We
expect Average Payment Size on PayPal to increase in future.
Forecast Rationale
1. AVERAGE PAYMENT SIZE FOR PAYPAL HIGHER THAN THE AVERAGE SELLING PRICE ON MARKETPLACES, IMPLYING
THAT EITHER: – The average price of items sold--and thus payments size--is higher for non-eBay platforms; or. The
transactions carried out through PayPal--out of all transactions on eBay's Marketplaces--have a higher average selling
price associated.
2. FUTURE AVERAGE PRICING TRENDS. – % of Paypal Total Payment Volume (TPV) that is generated from the eBay
platform has declined from around 64% in 2006 to 44% in 2009. The average price of items sold on non-eBay
platforms is higher as mentioned above. Since PayPal's penetration of non-eBay could continue to increase, this
situation will create an upward bias in the overall average prices for PayPal.
Sources for historical data and explanations can be found on the Trefis.com website (link)
TREFIS ANALYSIS for EBAY CONTENT@TREFIS.COM + 1 617 394 8763 •10
11. — PAYPAL PAYMENT TAKE RATE —
This represents the average commission made by PayPal on each transaction.
PayPal Payment Take Rate (%)
4.0
3.5
3.0
2.5
2.0
1.5
1.0
0.5
0.0
2007 2008 2009 2010 2011 2012 2013 2014 2015 2016 2017
The PayPal Payment Take Rate has remained in a range of 3.5-3.9% from 2003 to 2009. We expect the take rate to be
under marginal downward pressure going forward as a result of increased competition.
Forecast Rationale
1. INTENSELY COMPETITIVE NATURE OF PAYMENTS TO BE A CONTINUED HEADWIND TO PRICING – eBay faces a range of
competitors in the payments segments, including Google Checkout, credit card merchant processors like Amex, First
Data, Amazon payments, and money remittance companies like Western Union. . The competitive nature of
payments will ensure that take rates face a gradual compression in the future.
Sources for historical data and explanations can be found on the Trefis.com website (link)
— NUMBER OF ACCOUNTS ON PAYPAL —
Represents the number of users having a PayPal accounts
TREFIS ANALYSIS for EBAY CONTENT@TREFIS.COM + 1 617 394 8763 •11
12. Number of Accounts on PayPal (Mil)
250
200
150
100
50
0
2007 2008 2009 2010 2011 2012 2013 2014 2015 2016 2017
The number of accounts has been growing at a tremendous pace for many years. Number of Accounts on PayPal
increased from around 31 million in 2006 to 77 million by 2009. The growth is a reflection of eBay's concerted efforts to
integrate PayPal into its "Marketplaces" segment and forge strategic relationships with a diversified group of leading
online commerce portals like Blue Nile and Toys R US. We expect the growth rate in user accounts to decelerate, but still
continue at respectable double-digit pace in both US and International markets for the foreseeable future.
Forecast Rationale
1. INCREASED TOTAL PAYMENT VOLUME OF PAYPAL ON EBAY'S MARKETPLACES PLATFORMS
PayPal increased its Total Payment Volume from eBay's marketplaces from $24 billion in 2006 to around $31 billion
in 2009. This growth was however, slower than the growth of Paypal's overall TPV, which increased from $38 billion
in 2006 to $72 billion in 2009. We would expect the TPV from eBay marketplaces to continue to increase going
forward, as eBay continues to integrate PayPal into its adjacent marketplaces platforms like Shopping.com and
Rent.com. In addition, eBay's focus on Buyer protection programs will increase and enhance PayPal use on the
platform
2. INCREASED PENETRATION OF PAYPAL ON THIRD PARTY MERCHANT PLATFORMS
Paypal's TPV penetration of third party merchants has steadily increased from 36% in 2006 to 56% in 2009. PayPal
has already forged relationships with leading ecommerce websites like Blue Nile, Southwest Airlines, Barnes &
Noble, and Toys R US. We would expect growth in this segment to continue as eBay focuses more on small and
medium businesses, as well as proprietors.
Sources for historical data and explanations can be found on the Trefis.com website (link)
— PAYMENTS PER ACCOUNT ON PAYPAL —
This represents the number of transactions per Paypal user per month.
TREFIS ANALYSIS for EBAY CONTENT@TREFIS.COM + 1 617 394 8763 •12
13. Payments per Account on PayPal (per Month)
1.25
1.00
0.75
0.50
0.25
0.00
2007 2008 2009 2010 2011 2012 2013 2014 2015 2016 2017
Payments per account have declined from 1.7 in 2005 to 1.2 in 2009. We expect the payments per account to stabilize.
Forecast Rationale
Supporting:
1. INCREASING PAYPAL PRESENCE OFF EBAY AT MERCHANT SITES
Payments per Account on PayPal should rise as eBay expands its partnerships with more third party sites to use
PayPal.
Mitigating:
2. THE LONG TAIL EFFECT
Contrary to the growth trend in the number of accounts, the number of transactions has been decreasing at a rapid
pace. We would expect that trend to continue as marginal users are likely to be low quality (i.e. not as heavy users of
the e-commerce functionality as early adopters generally are).
Sources for historical data and explanations can be found on the Trefis.com website (link)
— PAYPAL EBITDA PROFIT MARGIN —
Earnings Before Interest, Taxes, Depreciation and Amortization (EBITDA) are profits after factoring in typical expenses,
such as Cost of Goods and Services Sold, SG&A Expenses, and R&D Expenses. EBITDA Margin represents divisional
EBITDA as a percentage of divisional revenues. We adjust EBITDA figures to exclude non-recurring charges and non-
cash charges, such as Stock-Based Compensation Expenses.
TREFIS ANALYSIS for EBAY CONTENT@TREFIS.COM + 1 617 394 8763 •13
14. PayPal EBITDA Profit Margin (%)
25
20
15
10
5
0
2007 2008 2009 2010 2011 2012 2013 2014 2015 2016 2017
The PayPal EBITDA Profit Margin has been 9-16% in recent years. We expect PayPal EBITDA Profit Margin to
increase. For eBay's overall operating margins, we expect a continued shift towards lower margin PayPal. In terms of
individual segments, we expect the following dynamics to impact the operating margins going forward:
Forecast Rationale
1. THE PAYMENTS BUSINESS IS SIGNIFICANTLY MORE COMPETITIVE THAN MARKETPLACES – This should make
continued investments necessary. However, given that a significant majority of the business comes from eBay, that
part of the business is shielded from competitive threats, which will marginalize the threat of competition.
2. AS AN OFFSET TO COMPETITION, EBAY WILL BE SHIFTING ITS CURRENT MIX OF TRANSACTIONS ON PAYPAL – This
will likely involve a switch from credit card based to bank account or direct PayPal account based payments, which are
higher margin. We are assuming a constant margin profile over the explicit period forecast, as competition and the
transaction mix factors offset each other.
Sources for historical data and explanations can be found on the Trefis.com website (link)
2007 2008 2009 2010 2011 2012 2013 2014 2015 2016 2017
Total Revenue (Bil $) 1.84 2.32 2.64 3.26 3.94 4.67 5.42 6.16 7.01 7.97 9.07
Direct Expense (Bil $) 1.40 1.94 2.40 2.64 3.15 3.68 4.22 4.74 5.32 6.05 6.88
Indirect Expense (Bil $) 0.14 0.50 0.20 0.54 0.51 0.64 0.77 0.88 1.02 1.20 1.37
Gross Profit (Bil $) 0.44 0.38 0.24 0.62 0.79 0.99 1.20 1.42 1.69 1.92 2.18
Free Cash Flow (Mil $) N/A N/A N/A N/A 281 345 430 540 668 720 810
In addition, you can see the detailed P&L for the PayPal business in the Appendix (link)
TREFIS ANALYSIS for EBAY CONTENT@TREFIS.COM + 1 617 394 8763 •14
15. Marketing & Advertising
The most important drivers for the Marketing & Advertising business are:
• Marketing & Advertising Revenue
• Marketing & Advertising EBITDA Profit Margin
— MARKETING & ADVERTISING REVENUE —
Marketing & Advertising revenues are derived from the sale of advertisements on Marketplaces as well as from classifieds
fees. Revenues from comparison-shopping site shopping.com are also included.
Marketing & Advertising Revenue ($ Bil)
2.0
1.5
1.0
0.5
0.0
2007 2008 2009 2010 2011 2012 2013 2014 2015 2016 2017
• Overall marketing and ad revenue as a % of total revenue has increased from nearly 9% in 2004 to around 14% in
2009; and we expect that trend to continue.
Forecast Rationale
1. BETTER MONETIZATION OF USER TRAFFIC ON VARIOUS EBAY SITES WILL CONTINUE TO DRIVE REVENUE GROWTH –
Marketing revenues have grown at a faster pace than overall eBay revenues over the past years. We expect that trend
to continue going forward, as eBay better monetizes its vast user base and traffic through text and graphical
advertisements.
2. E-COMMERCE TO DRIVE GROWTH IN ADJACENT MARKETS AS WELL – Online retail is a mid-single digit percentage of
overall retail sales in the US. We believe that as that percentage grows, so will the use of adjacent markets like online
comparison shopping sites, such as eBay's shopping.com. eBay makes money from shopping.com primarily through
advertising, but also through referral fees paid by retailers whose traffic and sales comes from shopping.com.
Sources for historical data and explanations can be found on the Trefis.com website (link)
— MARKETING & ADVERTISING EBITDA PROFIT MARGIN —
TREFIS ANALYSIS for EBAY CONTENT@TREFIS.COM + 1 617 394 8763 •15
16. Earnings Before Interest, Taxes, Depreciation and Amortization (EBITDA) are profits after factoring in typical expenses,
such as Cost of Goods and Services Sold, SG&A Expenses, and R&D Expenses. EBITDA Margin represents divisional
EBITDA as a percentage of divisional revenues. We adjust EBITDA figures to exclude non-recurring charges and non-
cash charges, such as Stock-Based Compensation Expenses.
Forecast Rationale
We expect marketing and advertising margins to increase slightly over the foreseeable future for the following reasons:
1. REVENUE GROWTH TO GO ALONG WITH HIGHER FIXED COST
We expect marketing and advertising revenue to grow in the low double-digits teens rate. However, we also expect
the fixed-cost to increase proportionally, which will keep a tab on margins increase in the future.
Marketing & Advertising EBITDA Profit Margin (%)
40
30
20
10
0
2007 2008 2009 2010 2011 2012 2013 2014 2015 2016 2017
Sources for historical data and explanations can be found on the Trefis.com website (link)
2007 2008 2009 2010 2011 2012 2013 2014 2015 2016 2017
Total Revenue (Bil $) 0.77 0.96 1.05 1.10 1.23 1.36 1.48 1.60 1.73 1.87 2.06
Direct Expense (Bil $) 0.42 0.57 0.69 0.71 0.80 0.88 0.96 1.04 1.12 1.21 1.34
Indirect Expense (Mil $) 58.3 208 81.0 181 159 186 209 228 251 281 312
Gross Profit (Mil $) 351 387 360 386 433 476 518 560 605 655 722
Free Cash Flow (Mil $) N/A N/A N/A N/A 273 290 309 331 354 374 410
In addition, you can see the detailed P&L for the Marketing & Advertising business in the Appendix (link)
TREFIS ANALYSIS for EBAY CONTENT@TREFIS.COM + 1 617 394 8763 •16