Salesforce Partners | Tips for Creating Dashboards

Salesforce Partners Tip. Dashboards show data from custom reports as visual components. They provide a snapshot of key metrics and performance indicators for your organization. You can create up to 20 components per dashboard. Salesforce partners and administrators control access to dashboards by storing them in folders with certain visibility settings. Dashboard folders can be public, hidden, or restricted to groups, roles, or territories. If you have access to a folder, you can view its dashboards. To view a dashboard component, users also need access to the folder for the underlying source report. Looking for Salesforce partners to help you with your next project? Check out OnPath. We're certified award-winning Salesforce partners and Canadian Eh! http://www.onpath.com/salesforce-optimization-services

Recommended
Recommended
More Related Content
More from Piper powered by Icontrol
More from Piper powered by Icontrol (7)
Recently uploaded
Recently uploaded (20)
Salesforce Partners | Tips for Creating Dashboards
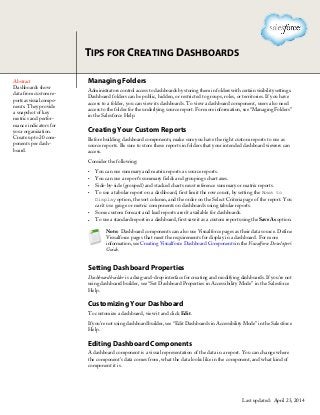
- 1. Abstract Dashboards show data from custom re- ports as visual compo- nents. They provide a snapshot of key metrics and perfor- mance indicators for your organization. Create up to 20 com- ponents per dash- board. Managing Folders Administrators control access to dashboards by storing them in folders with certain visibility settings. Dashboard folders can be public, hidden, or restricted to groups, roles, or territories. If you have access to a folder, you can view its dashboards. To view a dashboard component, users also need access to the folder for the underlying source report. For more information, see “Managing Folders” in the Salesforce Help. Creating Your Custom Reports Before building dashboard components, make sure you have the right custom reports to use as source reports. Be sure to store these reports in folders that your intended dashboard viewers can access. Consider the following: • You can use summary and matrix reports as source reports. • You can use a report's summary fields and groupings chart axes. • Side-by-side (grouped) and stacked charts must reference summary or matrix reports. • To use a tabular report on a dashboard, first limit the row count, by setting the Rows to Display option, the sort column, and the order on the Select Criteria page of the report. You can't use gauge or metric components on dashboards using tabular reports. • Some custom forecast and lead reports aren’t available for dashboards. • To use a standard report in a dashboard, first save it as a custom report using the SaveAs option. Note: Dashboard components can also use Visualforce pages as their data source. Define Visualforce pages that meet the requirements for display in a dashboard. For more information, see Creating Visualforce Dashboard Components in the Visualforce Developer's Guide. Setting Dashboard Properties Dashboard builder is a drag-and-drop interface for creating and modifying dashboards. If you're not using dashboard builder, see “Set Dashboard Properties in Accessibility Mode” in the Salesforce Help. Customizing Your Dashboard To customize a dashboard, view it and click Edit. If you're not using dashboard builder, see “Edit Dashboards in Accessibility Mode” in the Salesforce Help. Editing Dashboard Components A dashboard component is a visual representation of the data in a report. You can change where the component’s data comes from, what the data looks like in the component, and what kind of component it is. TIPS FOR CREATING DASHBOARDS Last updated: April 23, 2014
- 2. If you're not using dashboard builder, see “Adding and Editing Dashboard Components in Accessibility Mode” in the Salesforce Help. Refreshing Your Dashboards • Cick Refresh while viewing a dashboard to reload the most recent data. • Users with the “Schedule Dashboards” permission can schedule refreshes daily, weekly, or monthly. Once the refresh completes, Salesforce sends email to the selected users and groups. Note: Dashboard components that include Visualforce pages and s-controls may not display in dashboard refresh notifications. Users must view them in Salesforce. For more information, see “Refresh Dashboard Data” in the Salesforce Help. For more information about analytics features, see Getting Started with Analytics. 2 Tips for Creating Dashboards