Elliott wave and Fibonacci analysis on 010809
•
1 like•204 views

Elliott wave zigzag, motive wave, counting waves, Fibonacci extension, Fibonacci retracement, expanded flat, and corrective combination are profiled in this evening report by TheMarketDetective.com

Recommended
More Related Content
More from David Waggoner
Recently uploaded
Recently uploaded (20)
Elliott wave and Fibonacci analysis on 010809
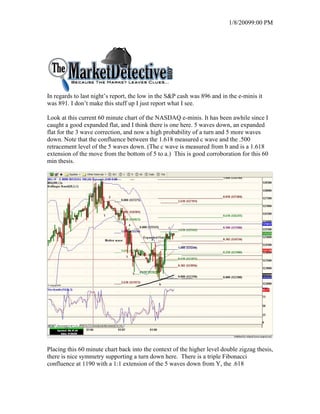
- 1. 1/8/20099:00 PM In regards to last night’s report, the low in the S&P cash was 896 and in the e-minis it was 891. I don’t make this stuff up I just report what I see. Look at this current 60 minute chart of the NASDAQ e-minis. It has been awhile since I caught a good expanded flat, and I think there is one here. 5 waves down, an expanded flat for the 3 wave correction, and now a high probability of a turn and 5 more waves down. Note that the confluence between the 1.618 measured c wave and the .500 retracement level of the 5 waves down. (The c wave is measured from b and is a 1.618 extension of the move from the bottom of 5 to a.) This is good corroboration for this 60 min thesis. Placing this 60 minute chart back into the context of the higher level double zigzag thesis, there is nice symmetry supporting a turn down here. There is a triple Fibonacci confluence at 1190 with a 1:1 extension of the 5 waves down from Y, the .618
- 2. 1/8/20099:00 PM retracement of the move up from X and a .382 retracement of the entire move off the low. This is a powerful confluence of support and a good place to extend up. My bias is that price will not get more than a few ticks above 1255, but if it does, continued upside risk increases significantly above 1262. A better barometer for upside risk is probably the laggard S&P e-minis and a breakout above 917, the .500 retracement level shown on the 60 min chart below. ES911 is the level that coincides with NQ1255 and is the higher probable turning point. Notice that I have a different sub-structure wave count on the 60 minute ES chart than I do on the NQ chart, but both charts work with their respective interpreted wave counts and Fibonacci proportion.
- 3. 1/8/20099:00 PM TMD/DW The market detective provides personal market opinion based on sound technical analysis and research. However, no warranty is given or implied as to its true reliability. The market detective will make errors and mistakes. The market detective is not an investment adviser and is not making recommendations to buy, sell, or place orders relating to the futures contracts, ETFs, or stocks that he writes about. The responsibility for decisions made from information contained in this service are solely that of the individual subscriber. The individual must fully research and make his/her own decisions before acting on any information provided by the market detective. The market detective assumes no responsibility for subscriber investment or trading results.