School level : SHS 2 Curriculum area: Elective Maths Class time : 80min (two periods)
2.
Determine how changesin the parameters of a quadratic equation in the polynomial form affect the graph Determine how to use the polynomial form of a polynomial quadratic equation to find the location of the vertex on a graph. Apply the vertex of a quadratic function in a realistic setting.
3.
Think of thefollowing scenarios and describe the path when: a golf ball is played at one end of a park to another A basketball is thrown with the aim of scoring (You can sketch the path on a sheet of paper)
4.
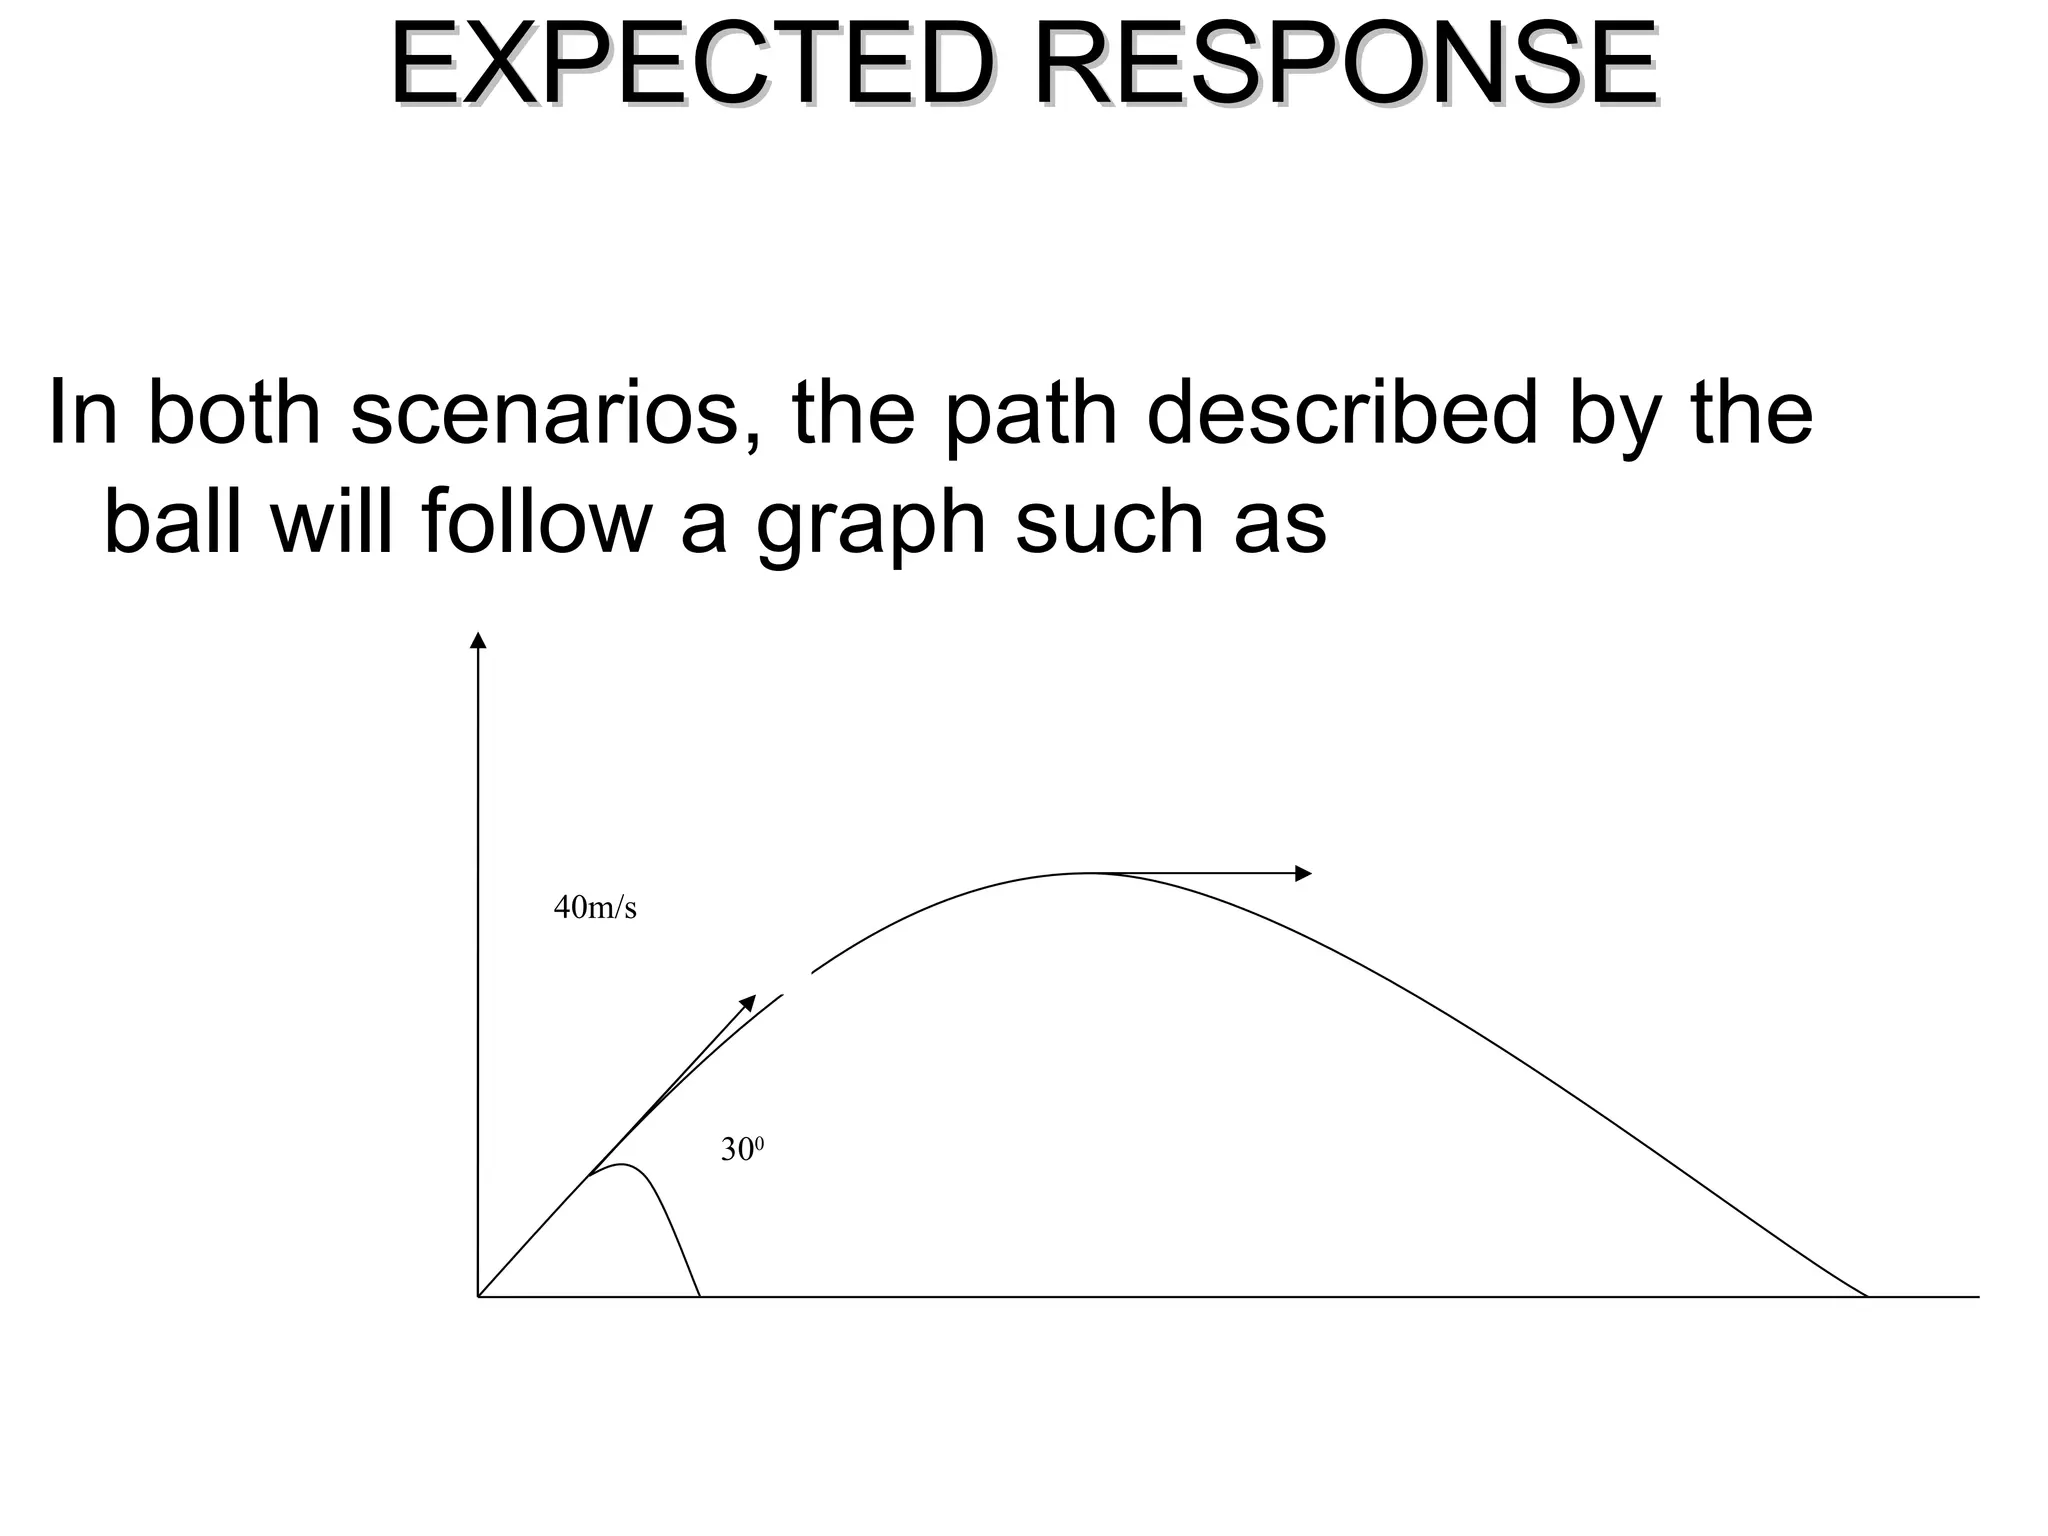
In both scenarios,the path described by the ball will follow a graph such as EXPECTED RESPONSE 30 0 40m/s
5.
Considering the quadraticfunction, y=ax 2 +bx +k. What are the parameters of the quadratic function?
6.
The nature ofthe graph The nature of the quadratic curve when a is either positive or negative or zero. Graph 1 The nature of the graph when the absolute value of a is either increasing or decreasing. [ [click here ), check here too ]]]]
7.
The effects ofthe value of k on the quadratic curve. That is increasing and decreasing the value of k . click here
8.
The effects ofthe value of b on the quadratic curve. Click Determination of the axis of symmetry and its corresponding y value.
9.
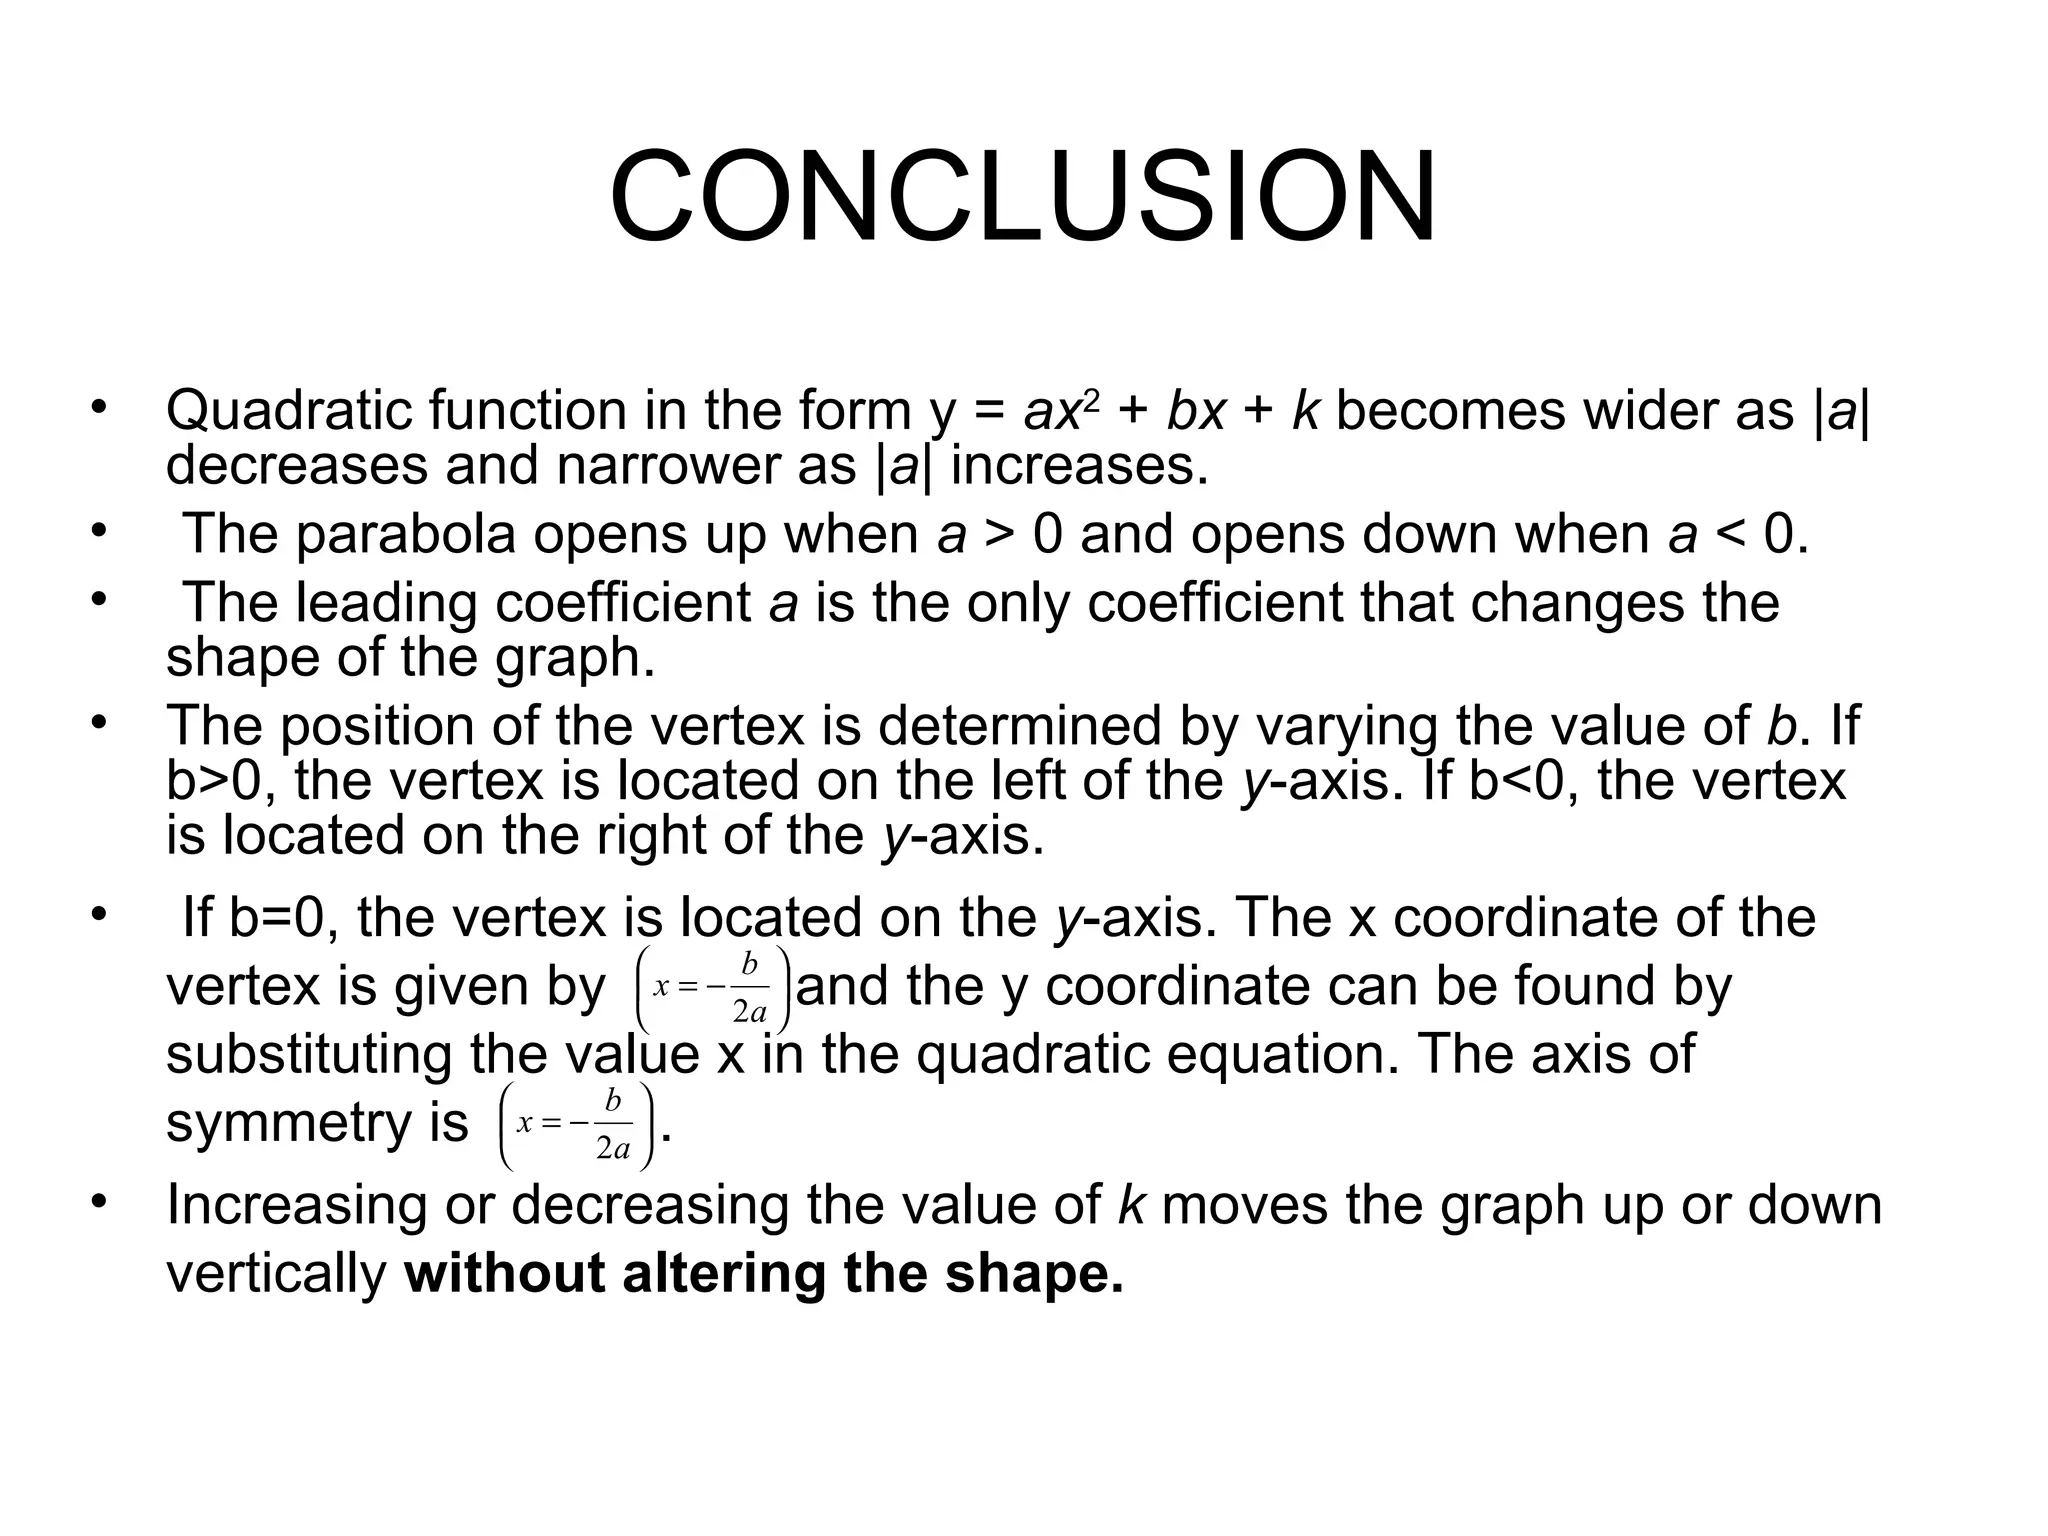
CONCLUSION Quadratic functionin the form y = ax 2 + bx + k becomes wider as | a | decreases and narrower as | a | increases. The parabola opens up when a > 0 and opens down when a < 0. The leading coefficient a is the only coefficient that changes the shape of the graph. The position of the vertex is determined by varying the value of b . If b>0, the vertex is located on the left of the y -axis. If b<0, the vertex is located on the right of the y -axis. If b=0, the vertex is located on the y -axis. The x coordinate of the vertex is given by and the y coordinate can be found by substituting the value x in the quadratic equation. The axis of symmetry is . Increasing or decreasing the value of k moves the graph up or down vertically without altering the shape.

![The nature of the graph The nature of the quadratic curve when a is either positive or negative or zero. Graph 1 The nature of the graph when the absolute value of a is either increasing or decreasing. [ [click here ), check here too ]]]]](https://image.slidesharecdn.com/presentation1-100702061249-phpapp01/75/Quadratic-in-the-polynomial-form-6-2048.jpg)