The document presents a study analyzing call data from several million telecom customers to predict customer churn, highlighting that social network influence significantly predicts cancellations. It demonstrates that subscribers connected to cancellers are twice as likely to churn and discusses the performance gains achieved using a dedicated analytics platform. The analysis indicates that while call quality does not correlate with churn, social connections within the calling network strongly influence customer retention.
The Social Effect:Predicting Telecom Customer Churn with Call DataMichael E. Driscoll, Ph.D.Principal, FounderFebruary 16, 2010
2.
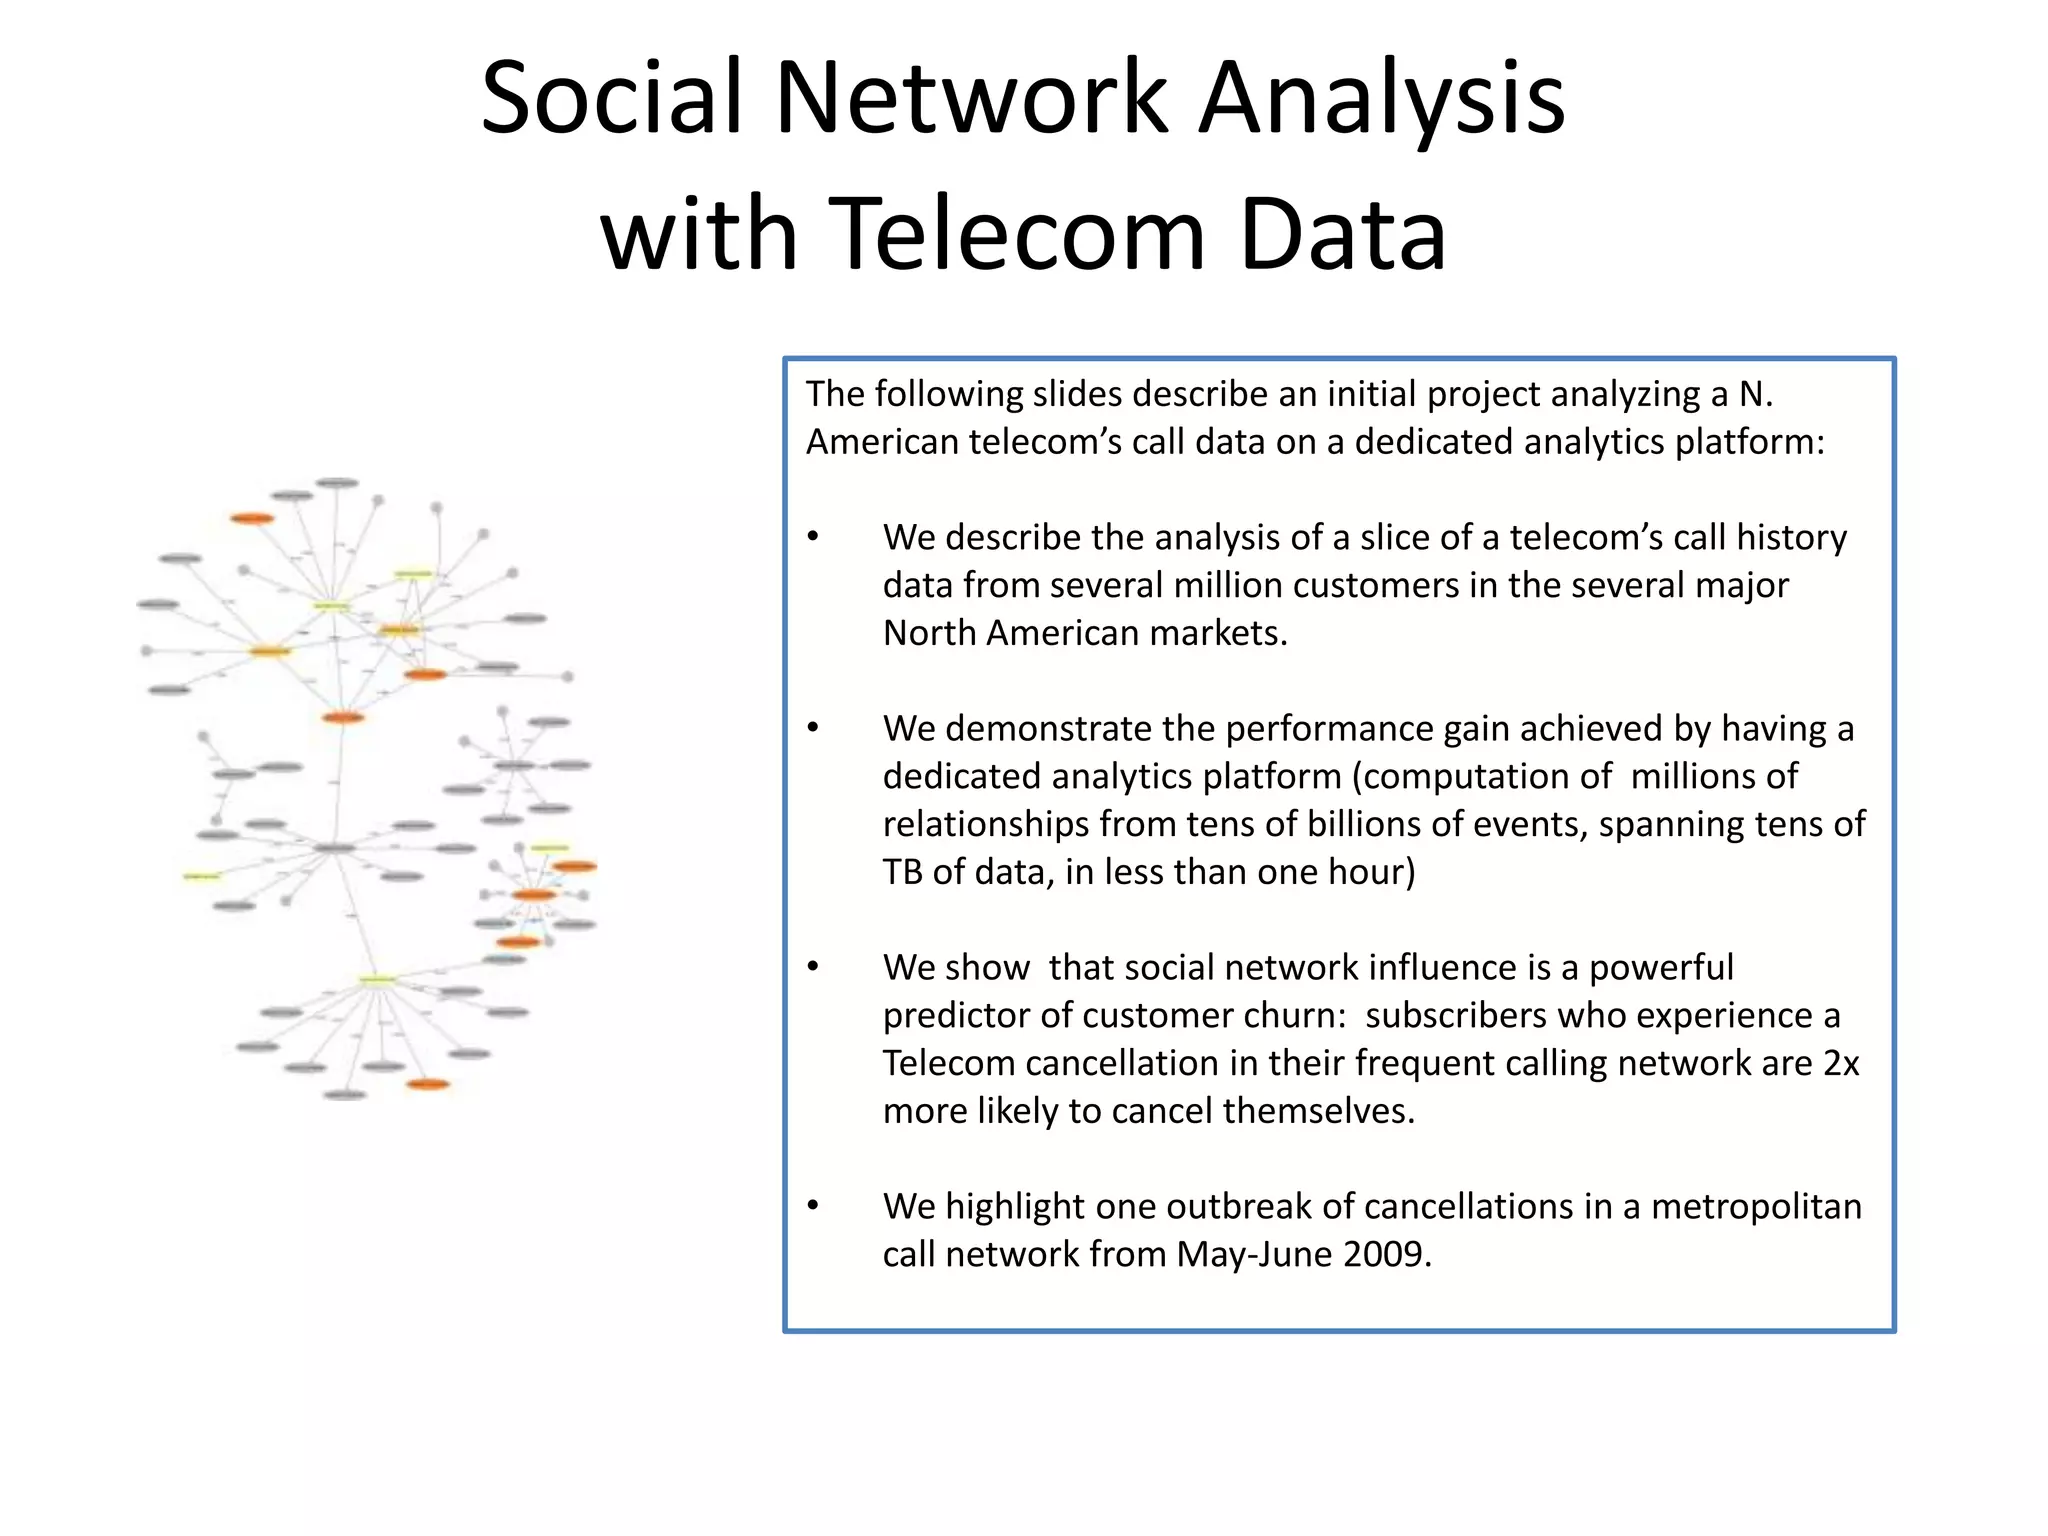
Social Network Analysiswith Telecom DataThe following slides describe an initial project analyzing a N. American telecom’s call data on a dedicated analytics platform:We describe the analysis of a slice of a telecom’s call history data from several million customers in the several major North American markets.We demonstrate the performance gain achieved by having a dedicated analytics platform (computation of millions of relationships from tens of billions of events, spanning tens of TB of data, in less than one hour)We show that social network influence is a powerful predictor of customer churn: subscribers who experience a Telecom cancellation in their frequent calling network are 2x more likely to cancel themselves.We highlight one outbreak of cancellations in a metropolitan call network from May-June 2009.
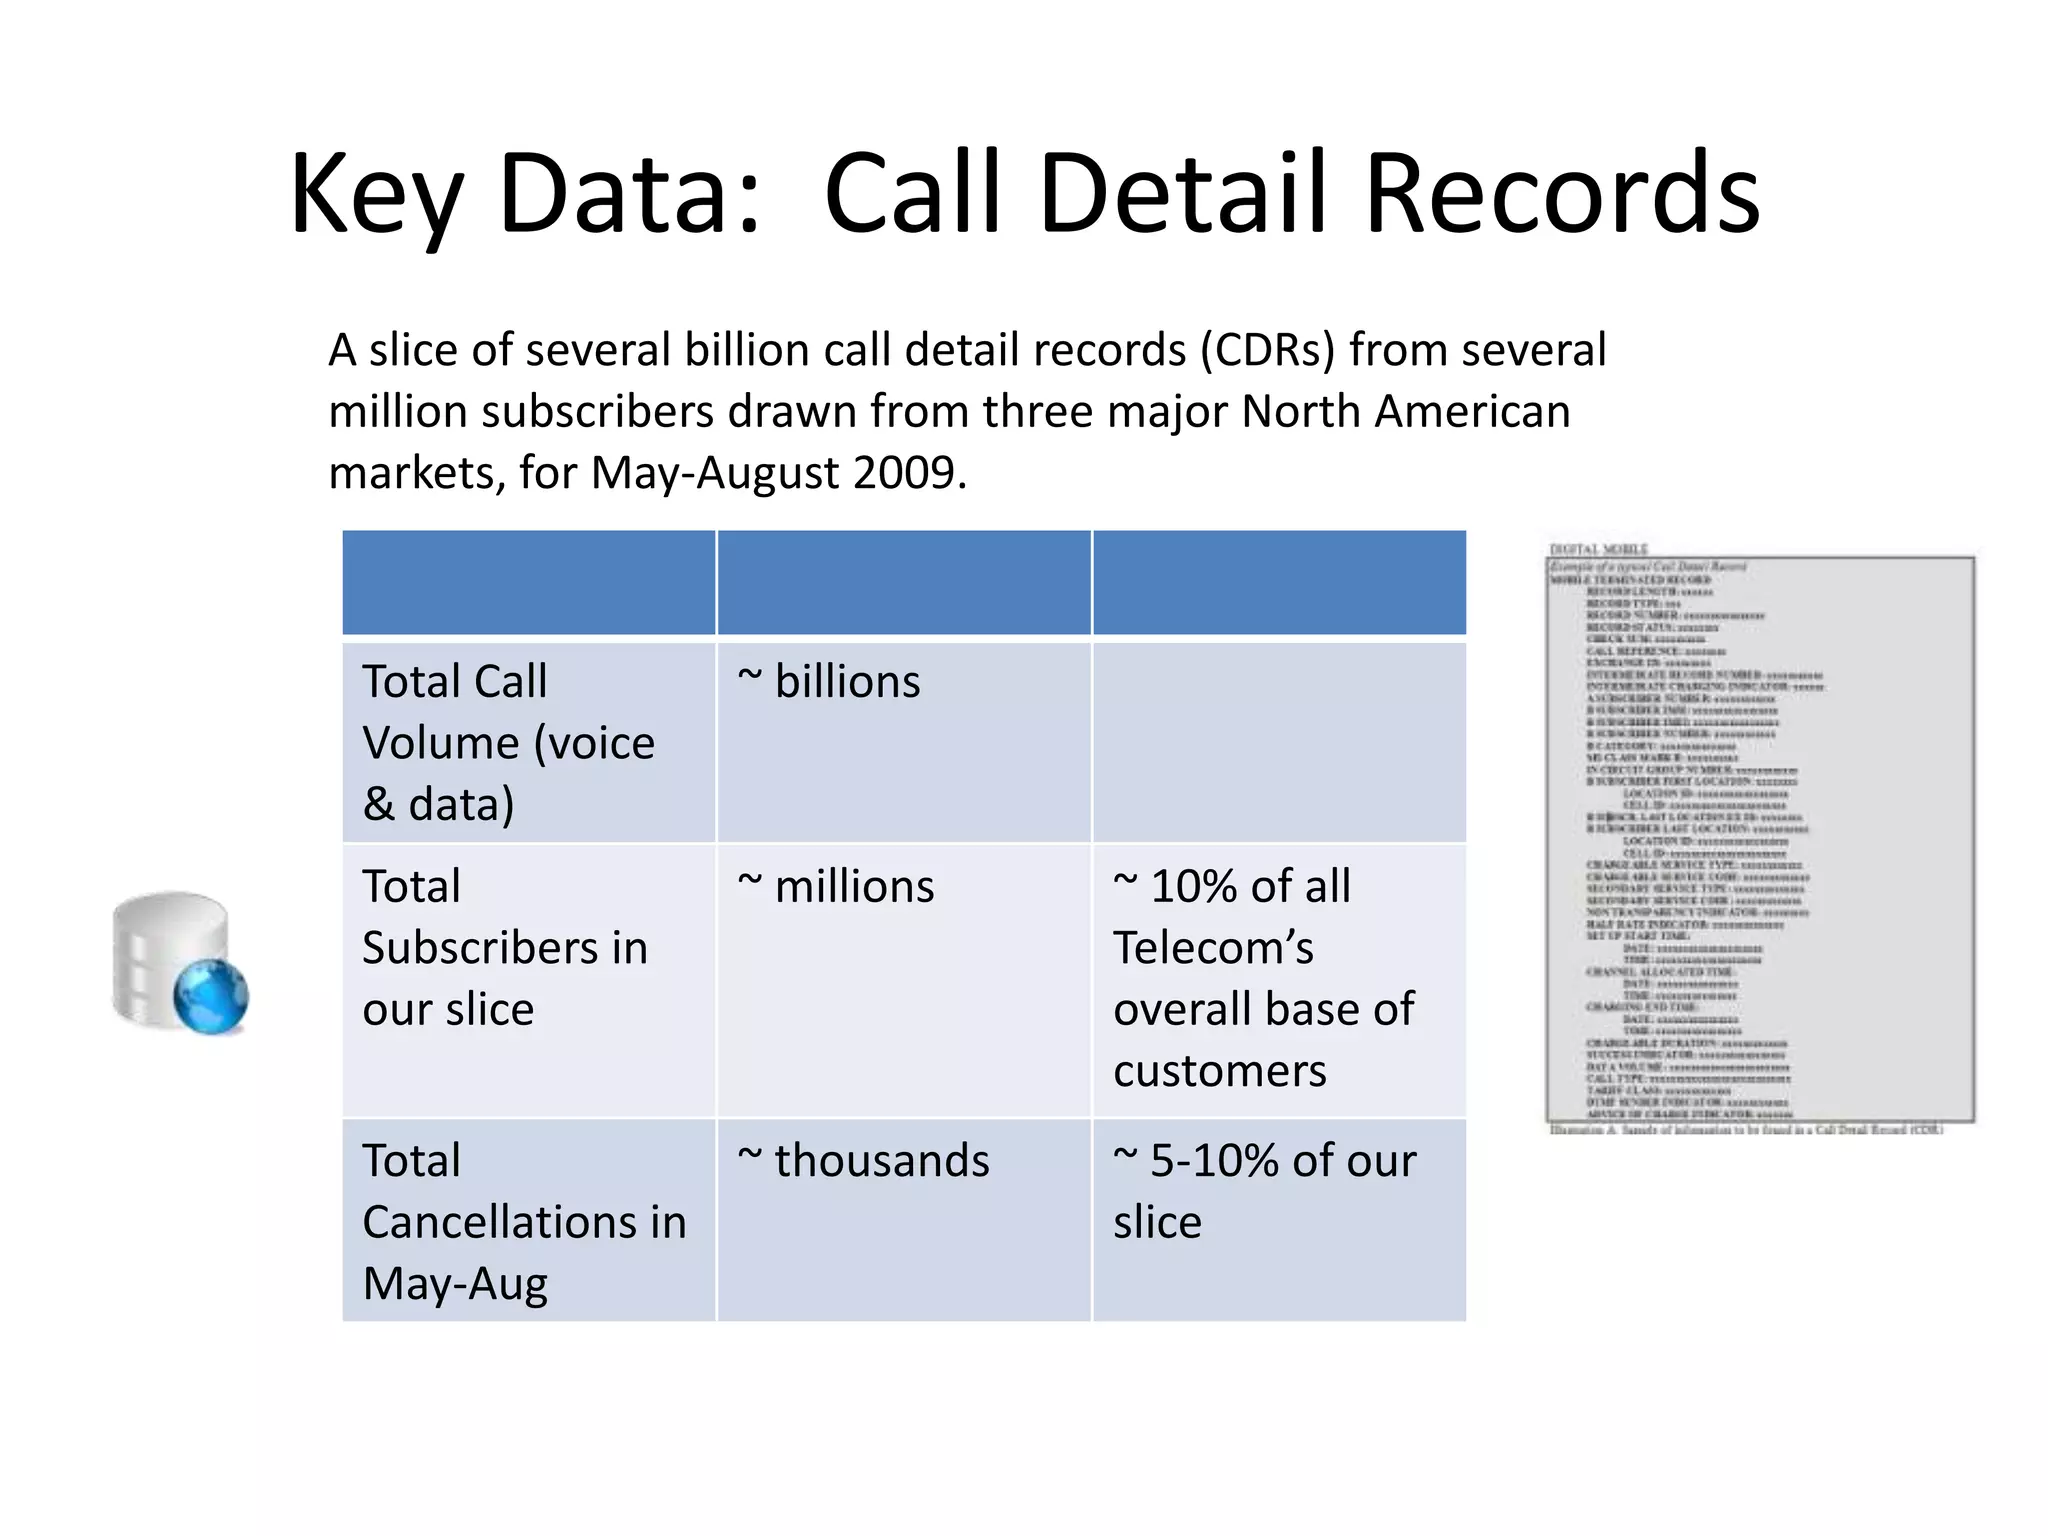
Key Data: Call Detail RecordsA slice of several billion call detail records (CDRs) from several million subscribers drawn from three major North American markets, for May-August 2009.
5.
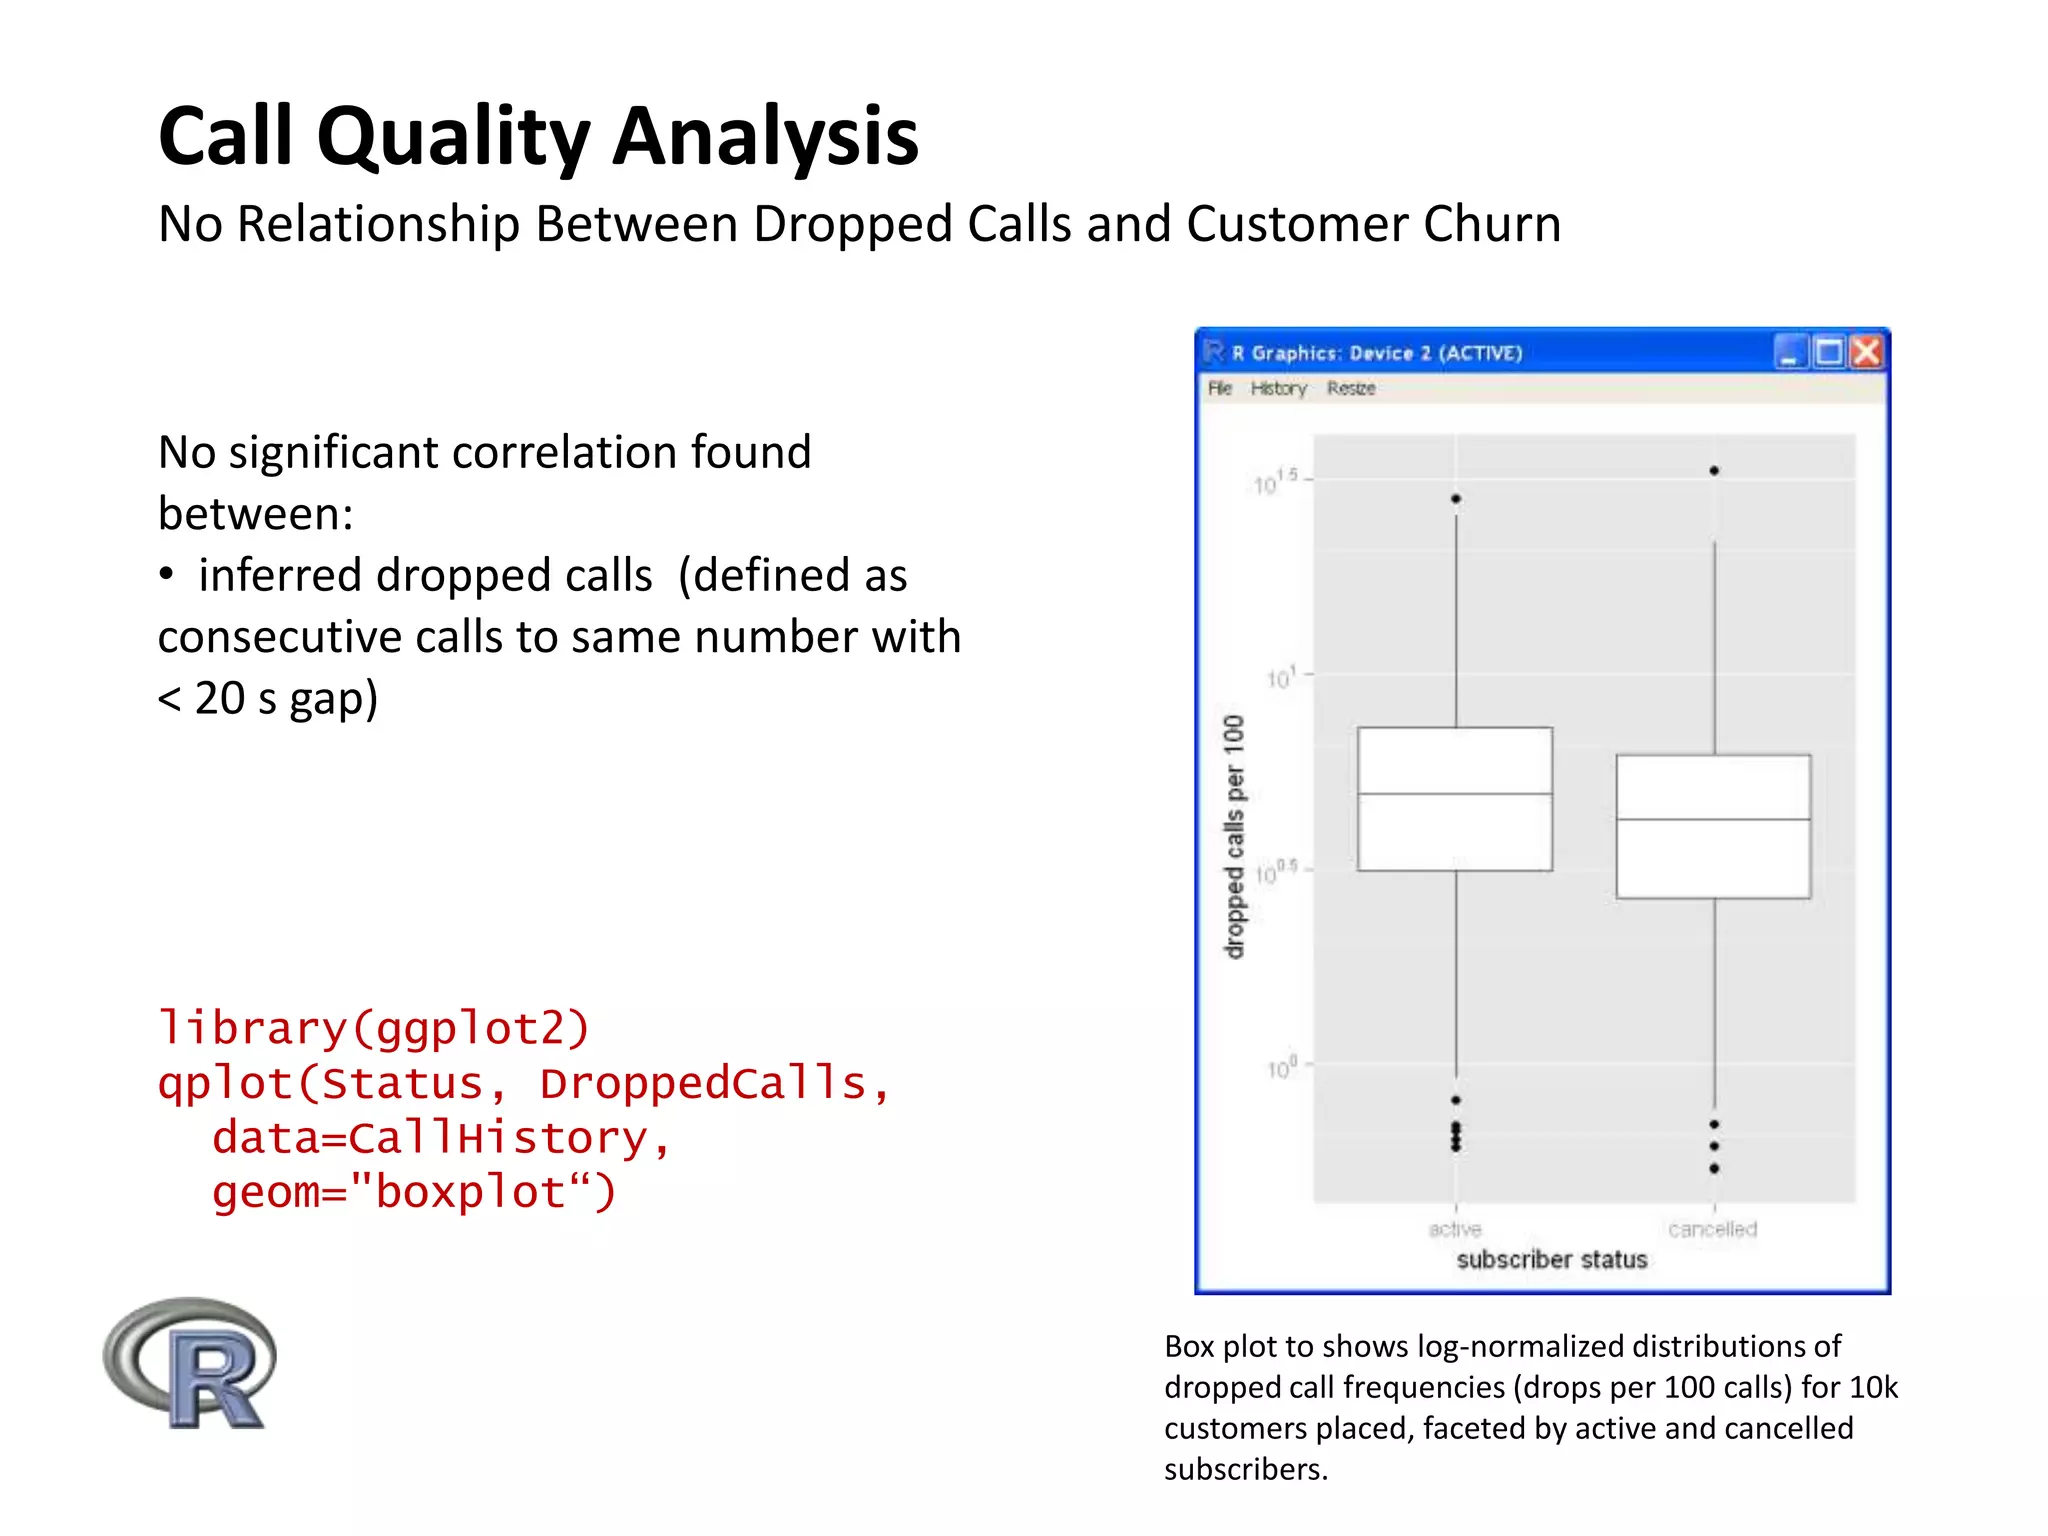
Call Quality AnalysisNoRelationship Between Dropped Calls and Customer ChurnNo significant correlation found between: inferred dropped calls (defined as consecutive calls to same number with < 20 s gap)library(ggplot2)qplot(Status, DroppedCalls, data=CallHistory,geom="boxplot“)Box plot to shows log-normalized distributions of dropped call frequencies (drops per 100 calls) for 10k customers placed, faceted by active and cancelled subscribers.
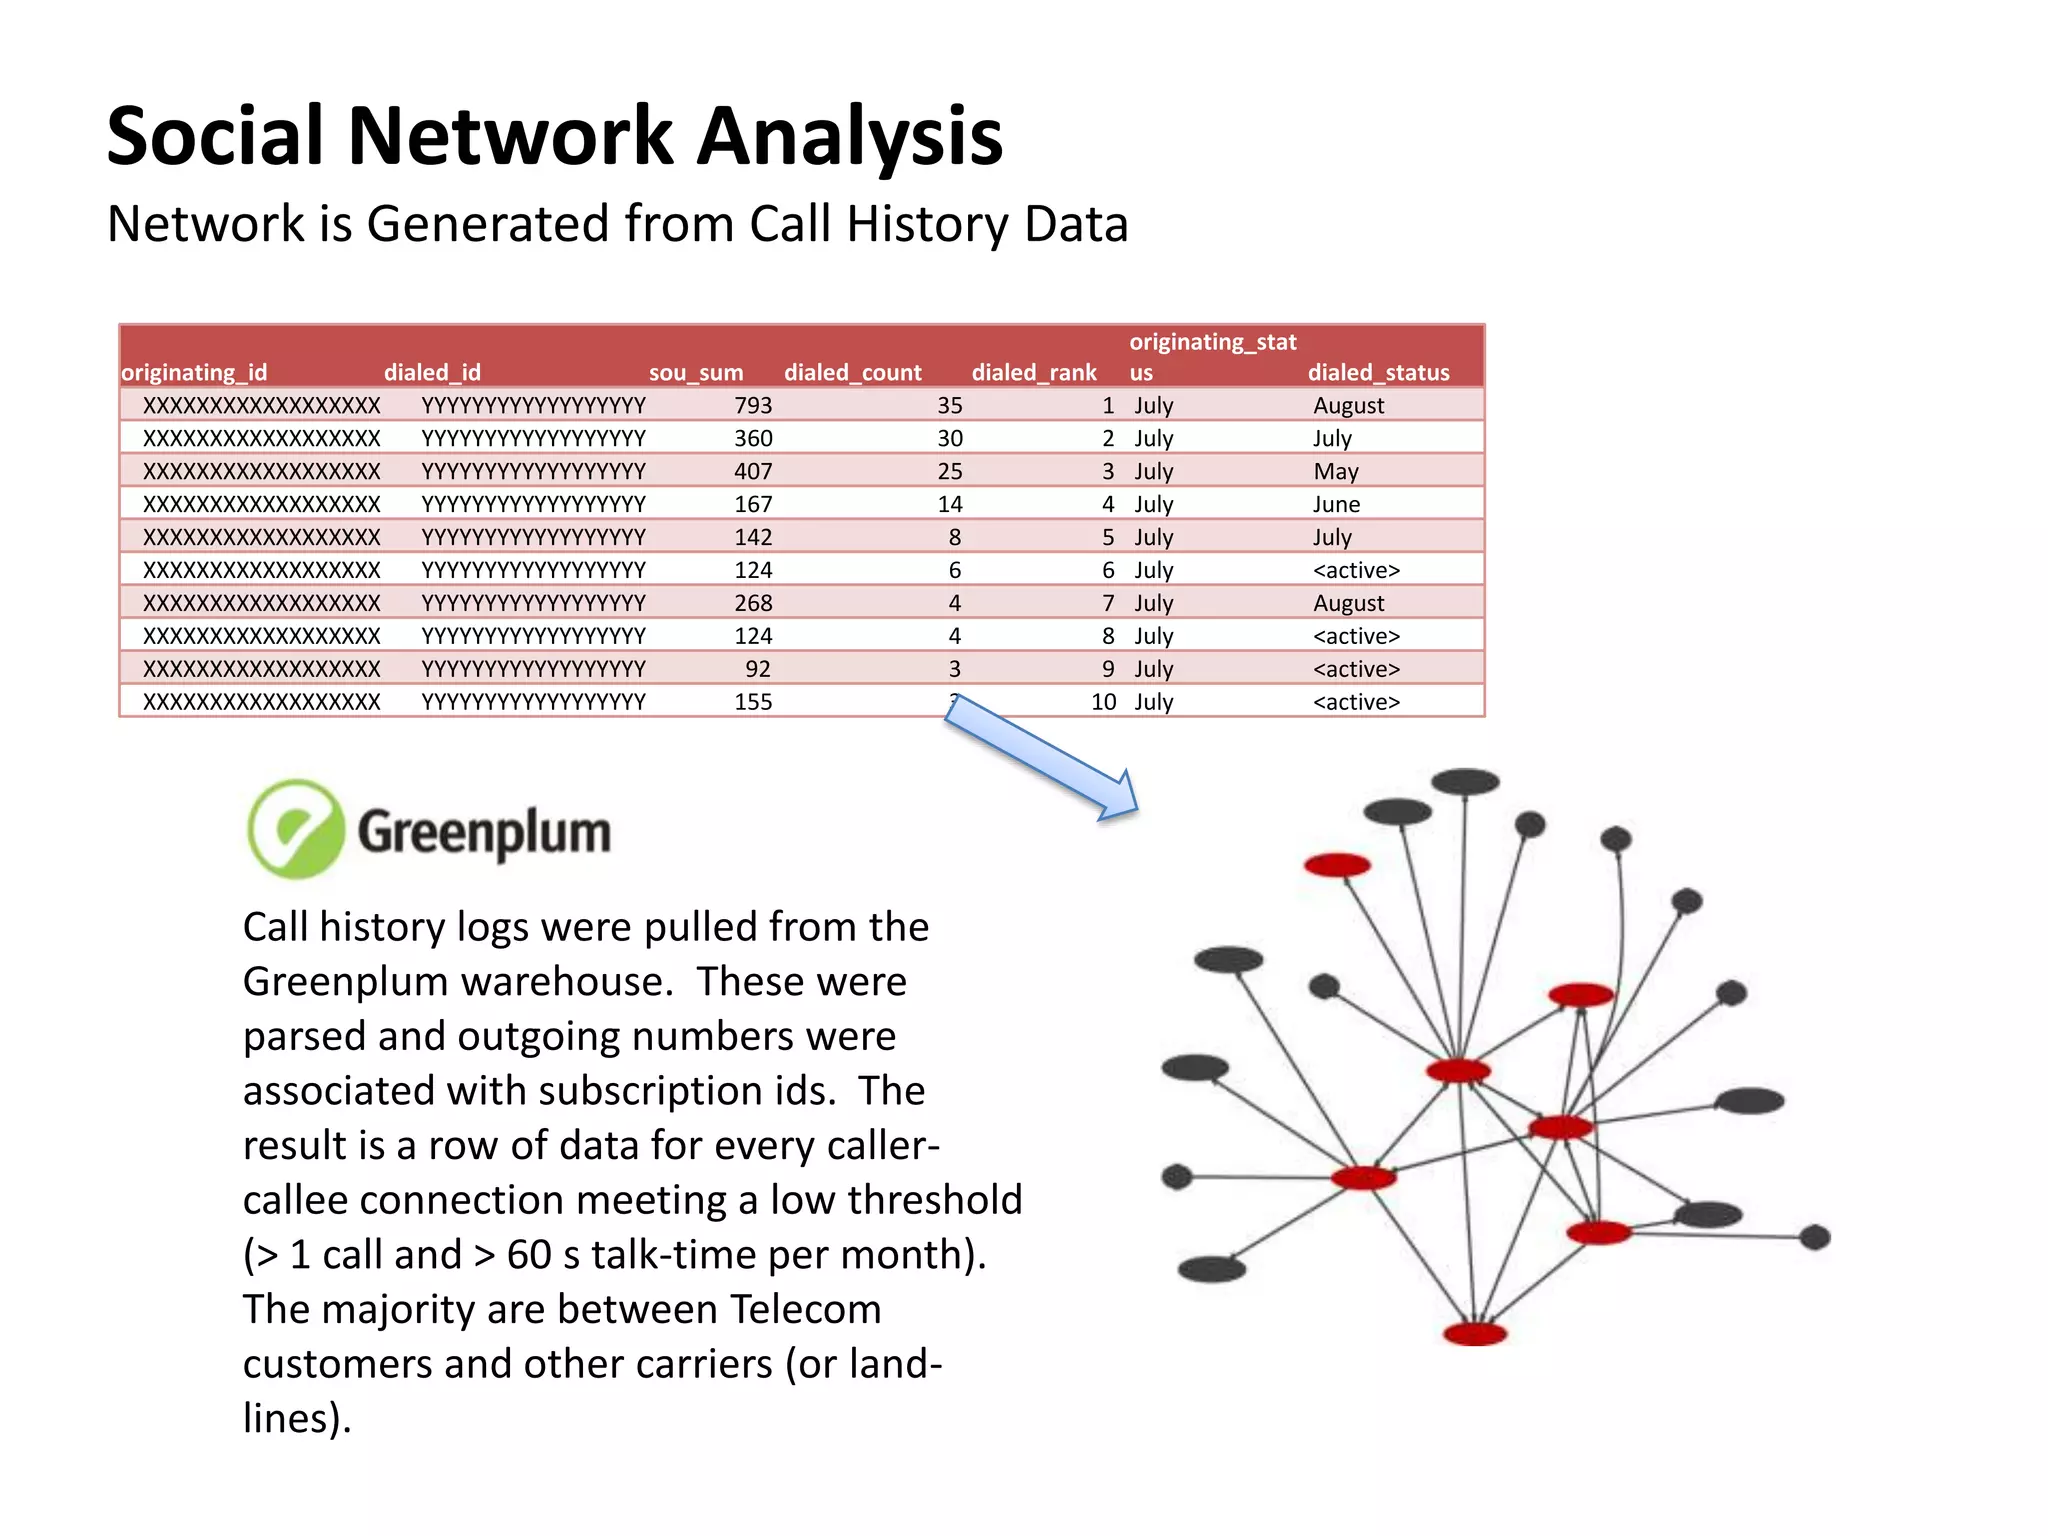
Social Network AnalysisNetworkis Generated from Call History DataCall history logs were pulled from the Greenplum warehouse. These were parsed and outgoing numbers were associated with subscription ids. The result is a row of data for every caller-callee connection meeting a low threshold (> 1 call and > 60 s talk-time per month). The majority are between Telecom customers and other carriers (or land-lines).
Our Tool: The R Programming LanguageDownload R at http://www.r-project.org/
10.
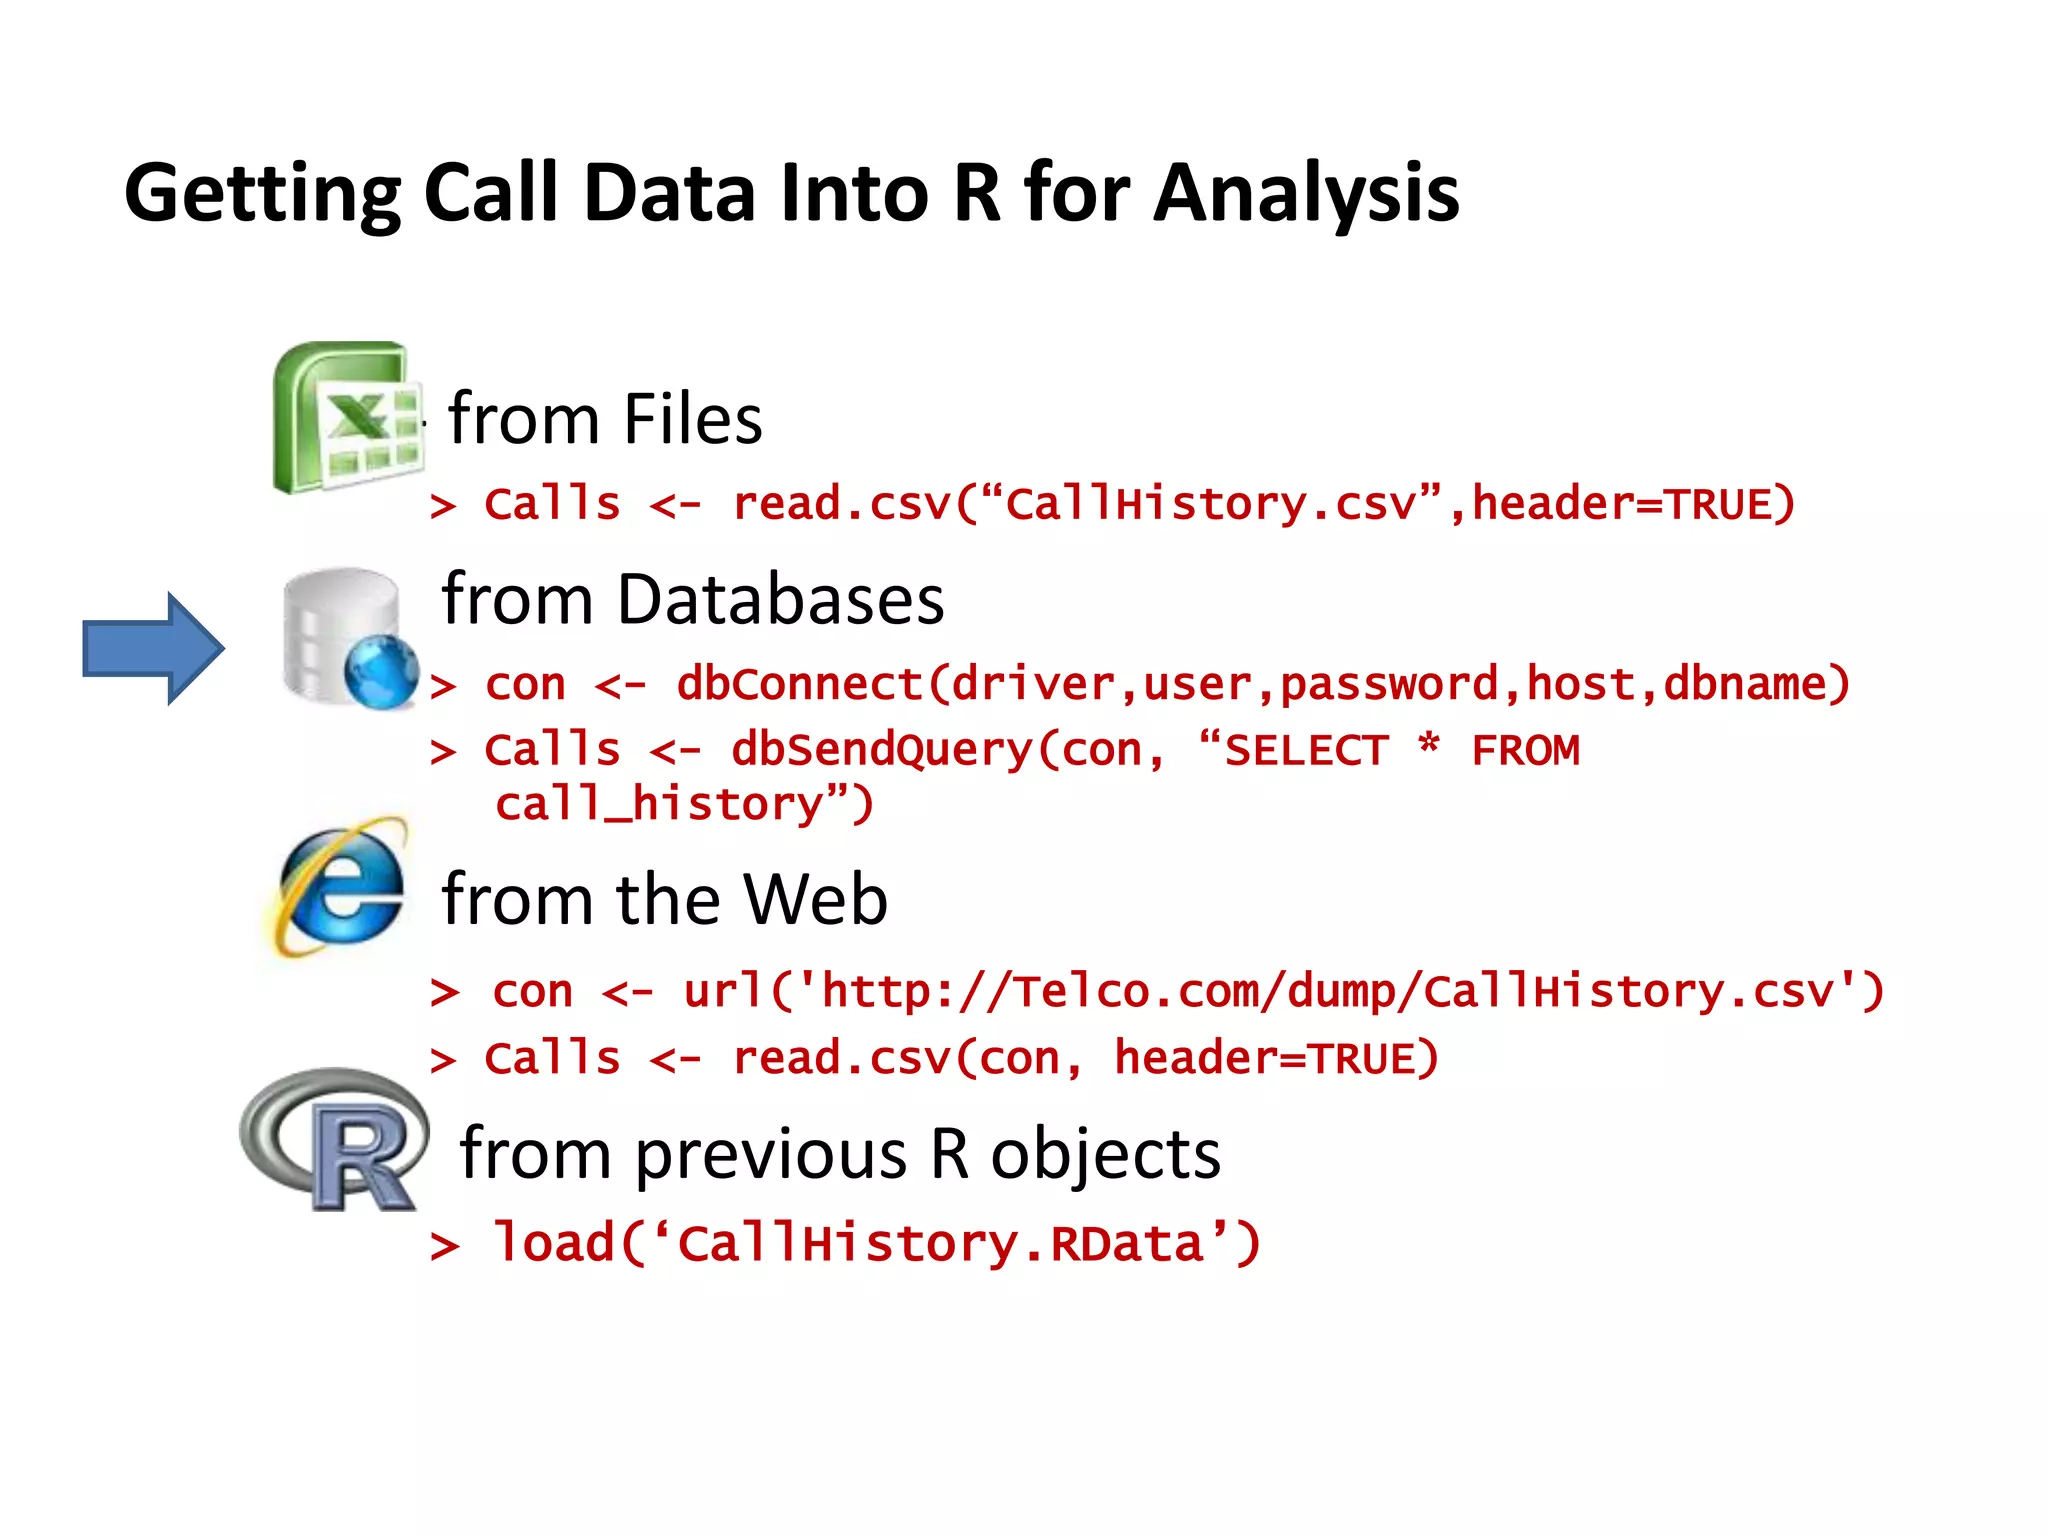
Getting Call DataInto R for Analysis - from Files> Calls <- read.csv(“CallHistory.csv”,header=TRUE) from Databases> con <- dbConnect(driver,user,password,host,dbname)> Calls <- dbSendQuery(con, “SELECT * FROM call_history”) from the Web> con <- url('http://Telco.com/dump/CallHistory.csv')> Calls <- read.csv(con, header=TRUE) from previous R objects> load(‘CallHistory.RData’)
11.
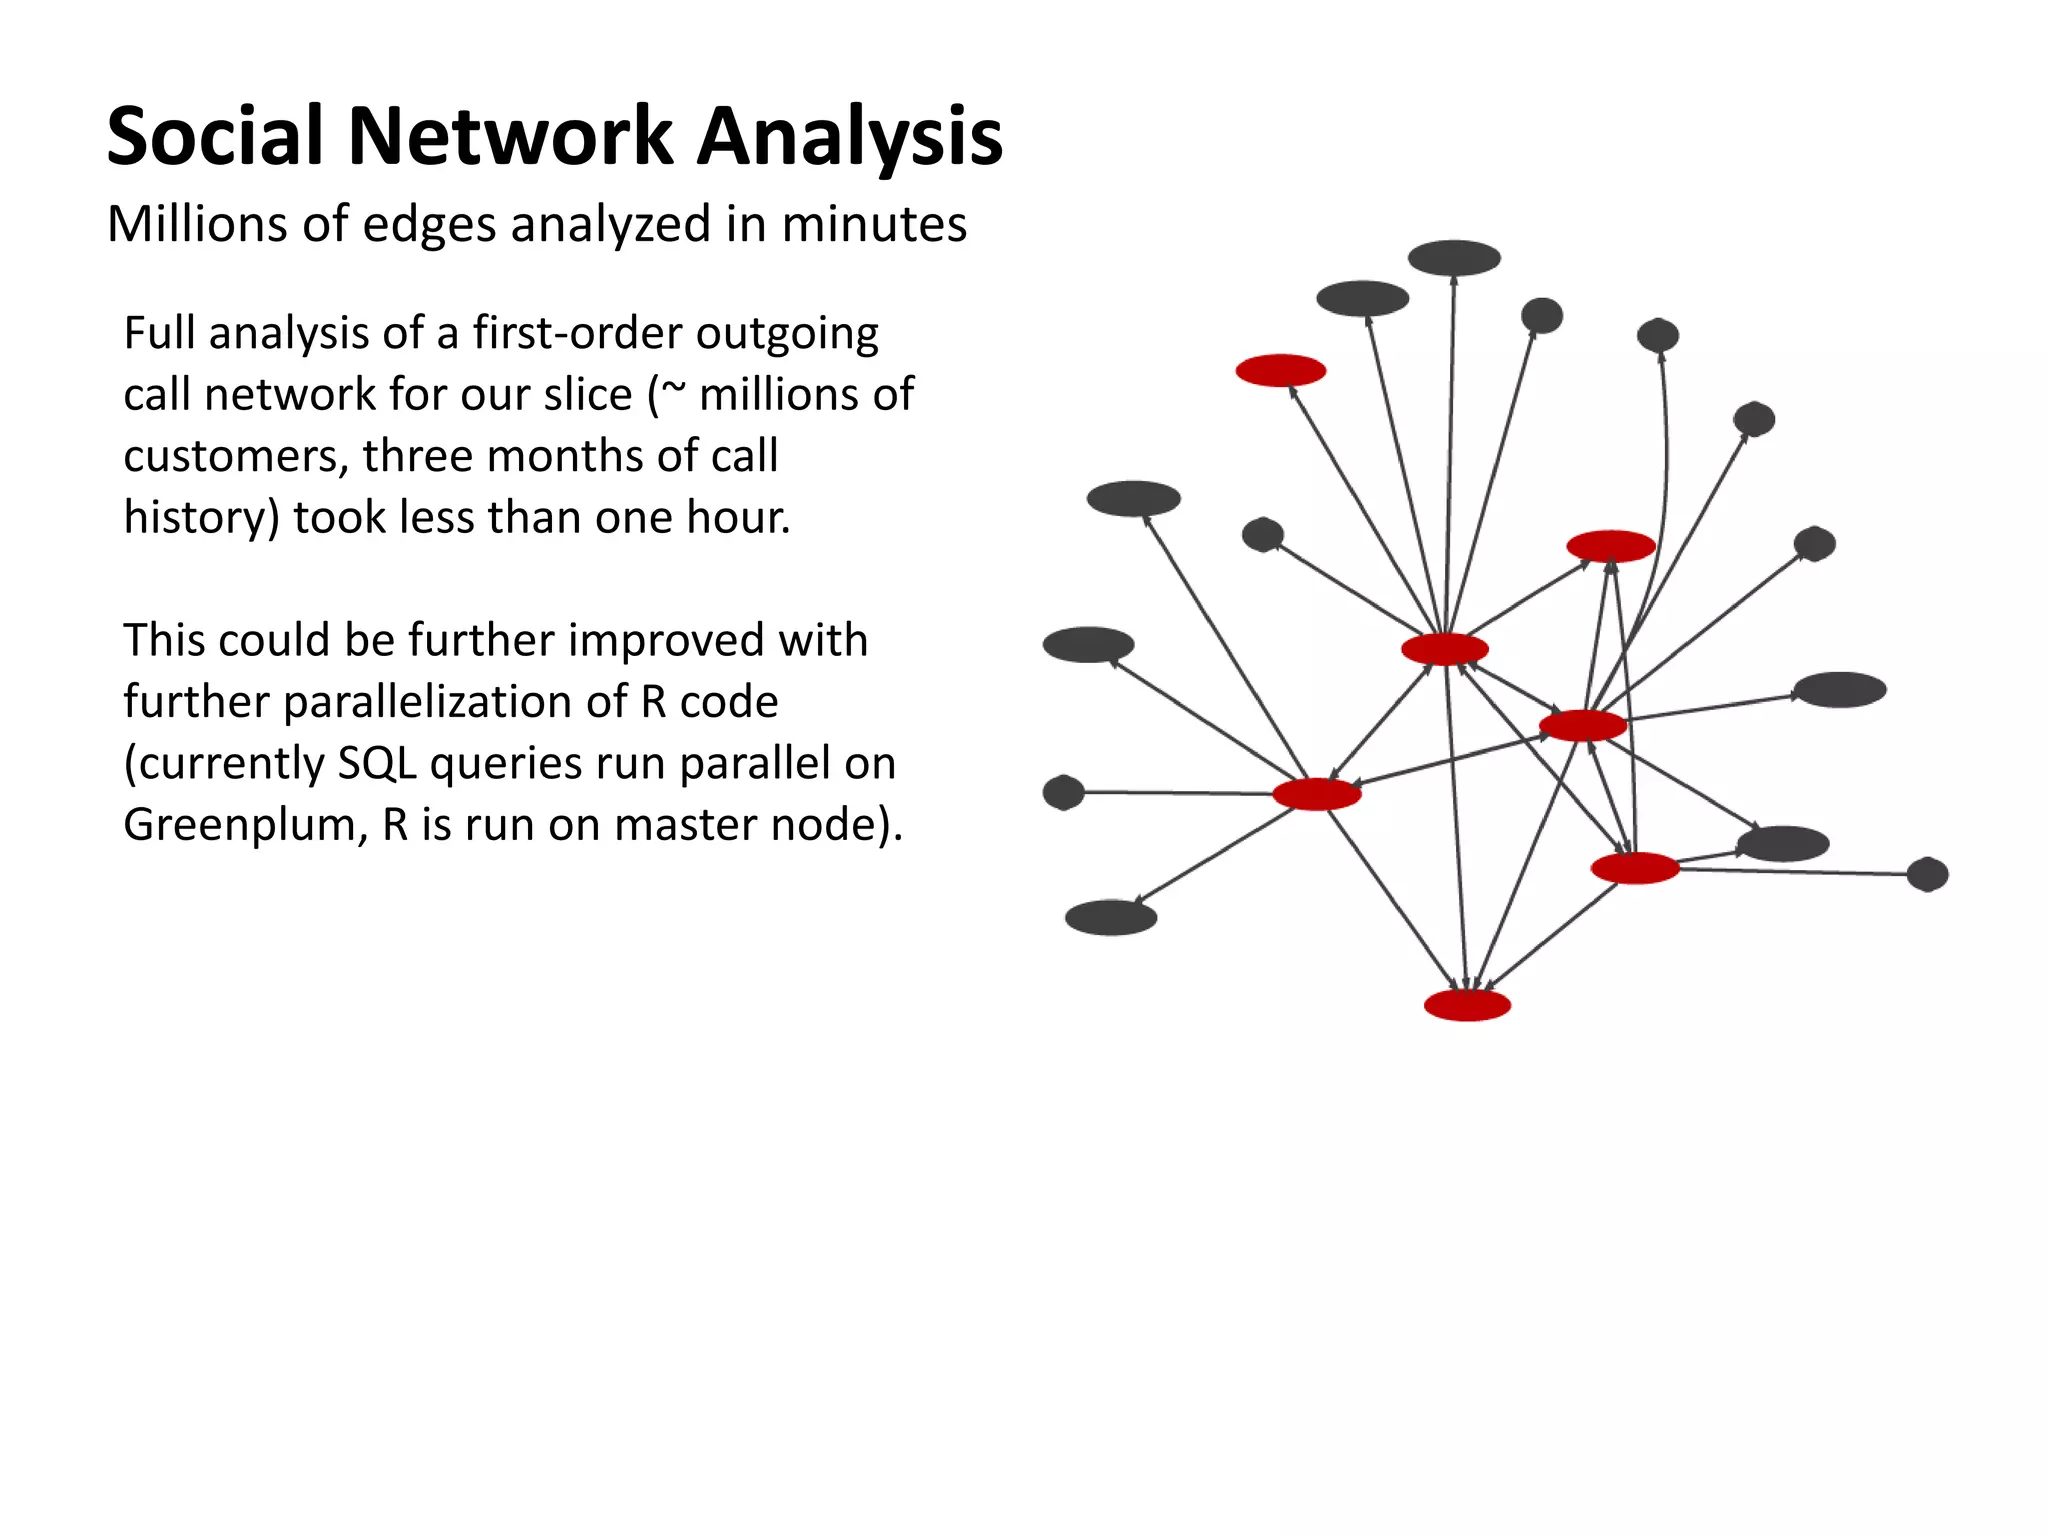
Social Network AnalysisMillionsof edges analyzed in minutesFull analysis of a first-order outgoing call network for our slice (~ millions of customers, three months of call history) took less than one hour.This could be further improved with further parallelization of R code (currently SQL queries run parallel on Greenplum, R is run on master node).
12.
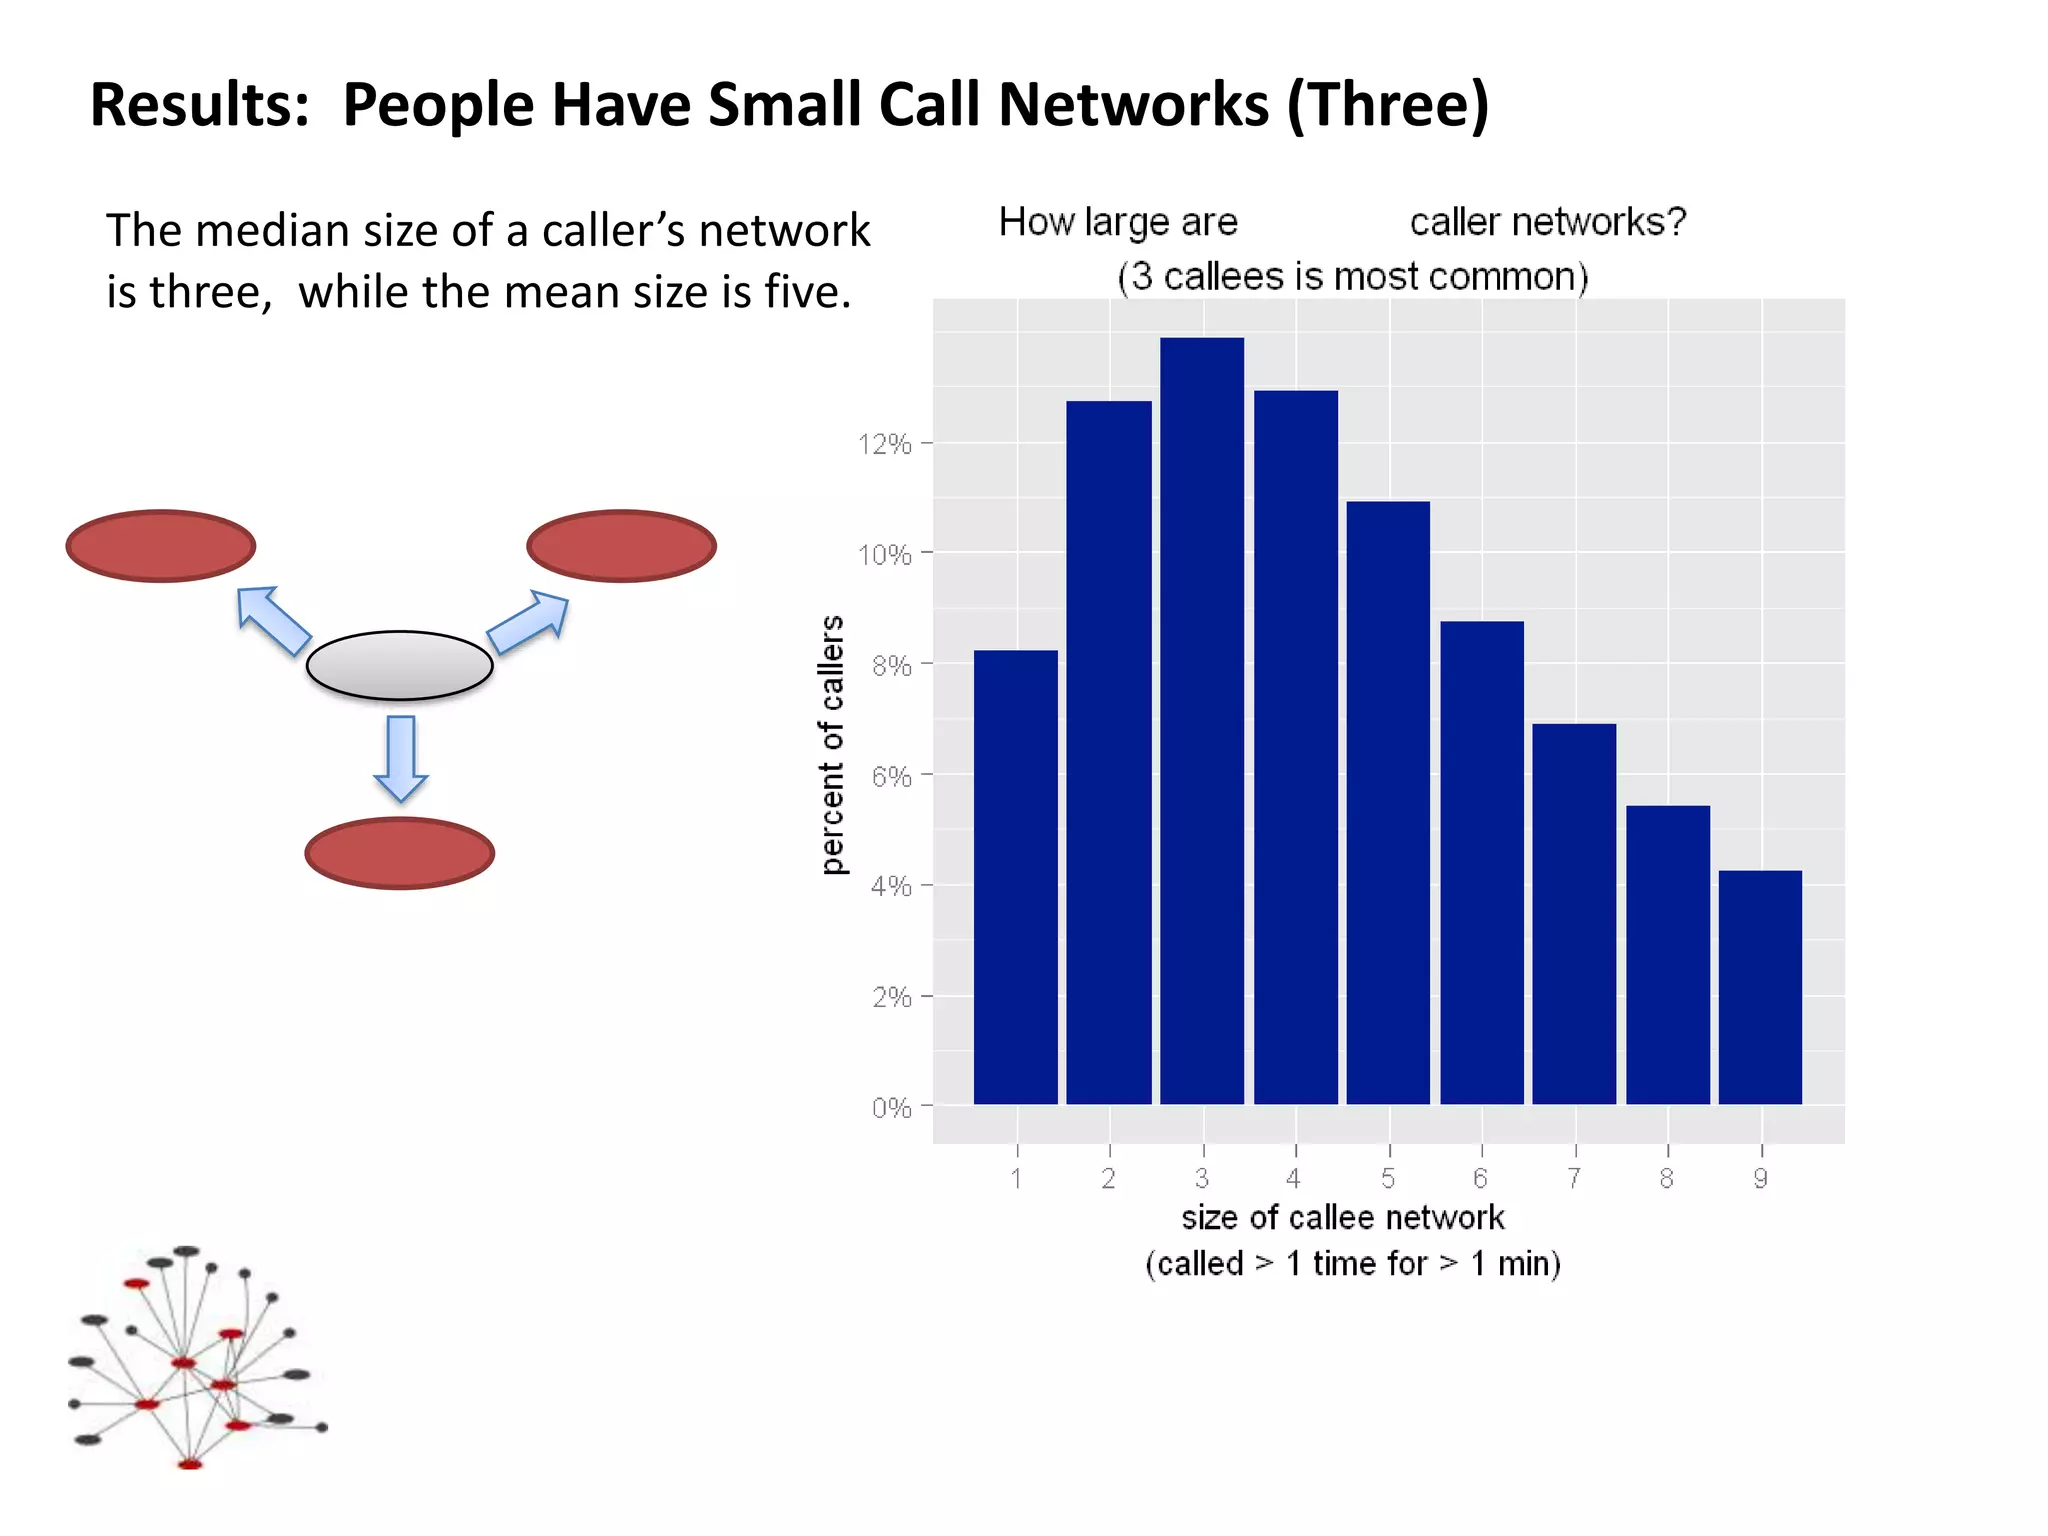
Results: PeopleHave Small Call Networks (Three)The median size of a caller’s network is three, while the mean size is five.
13.
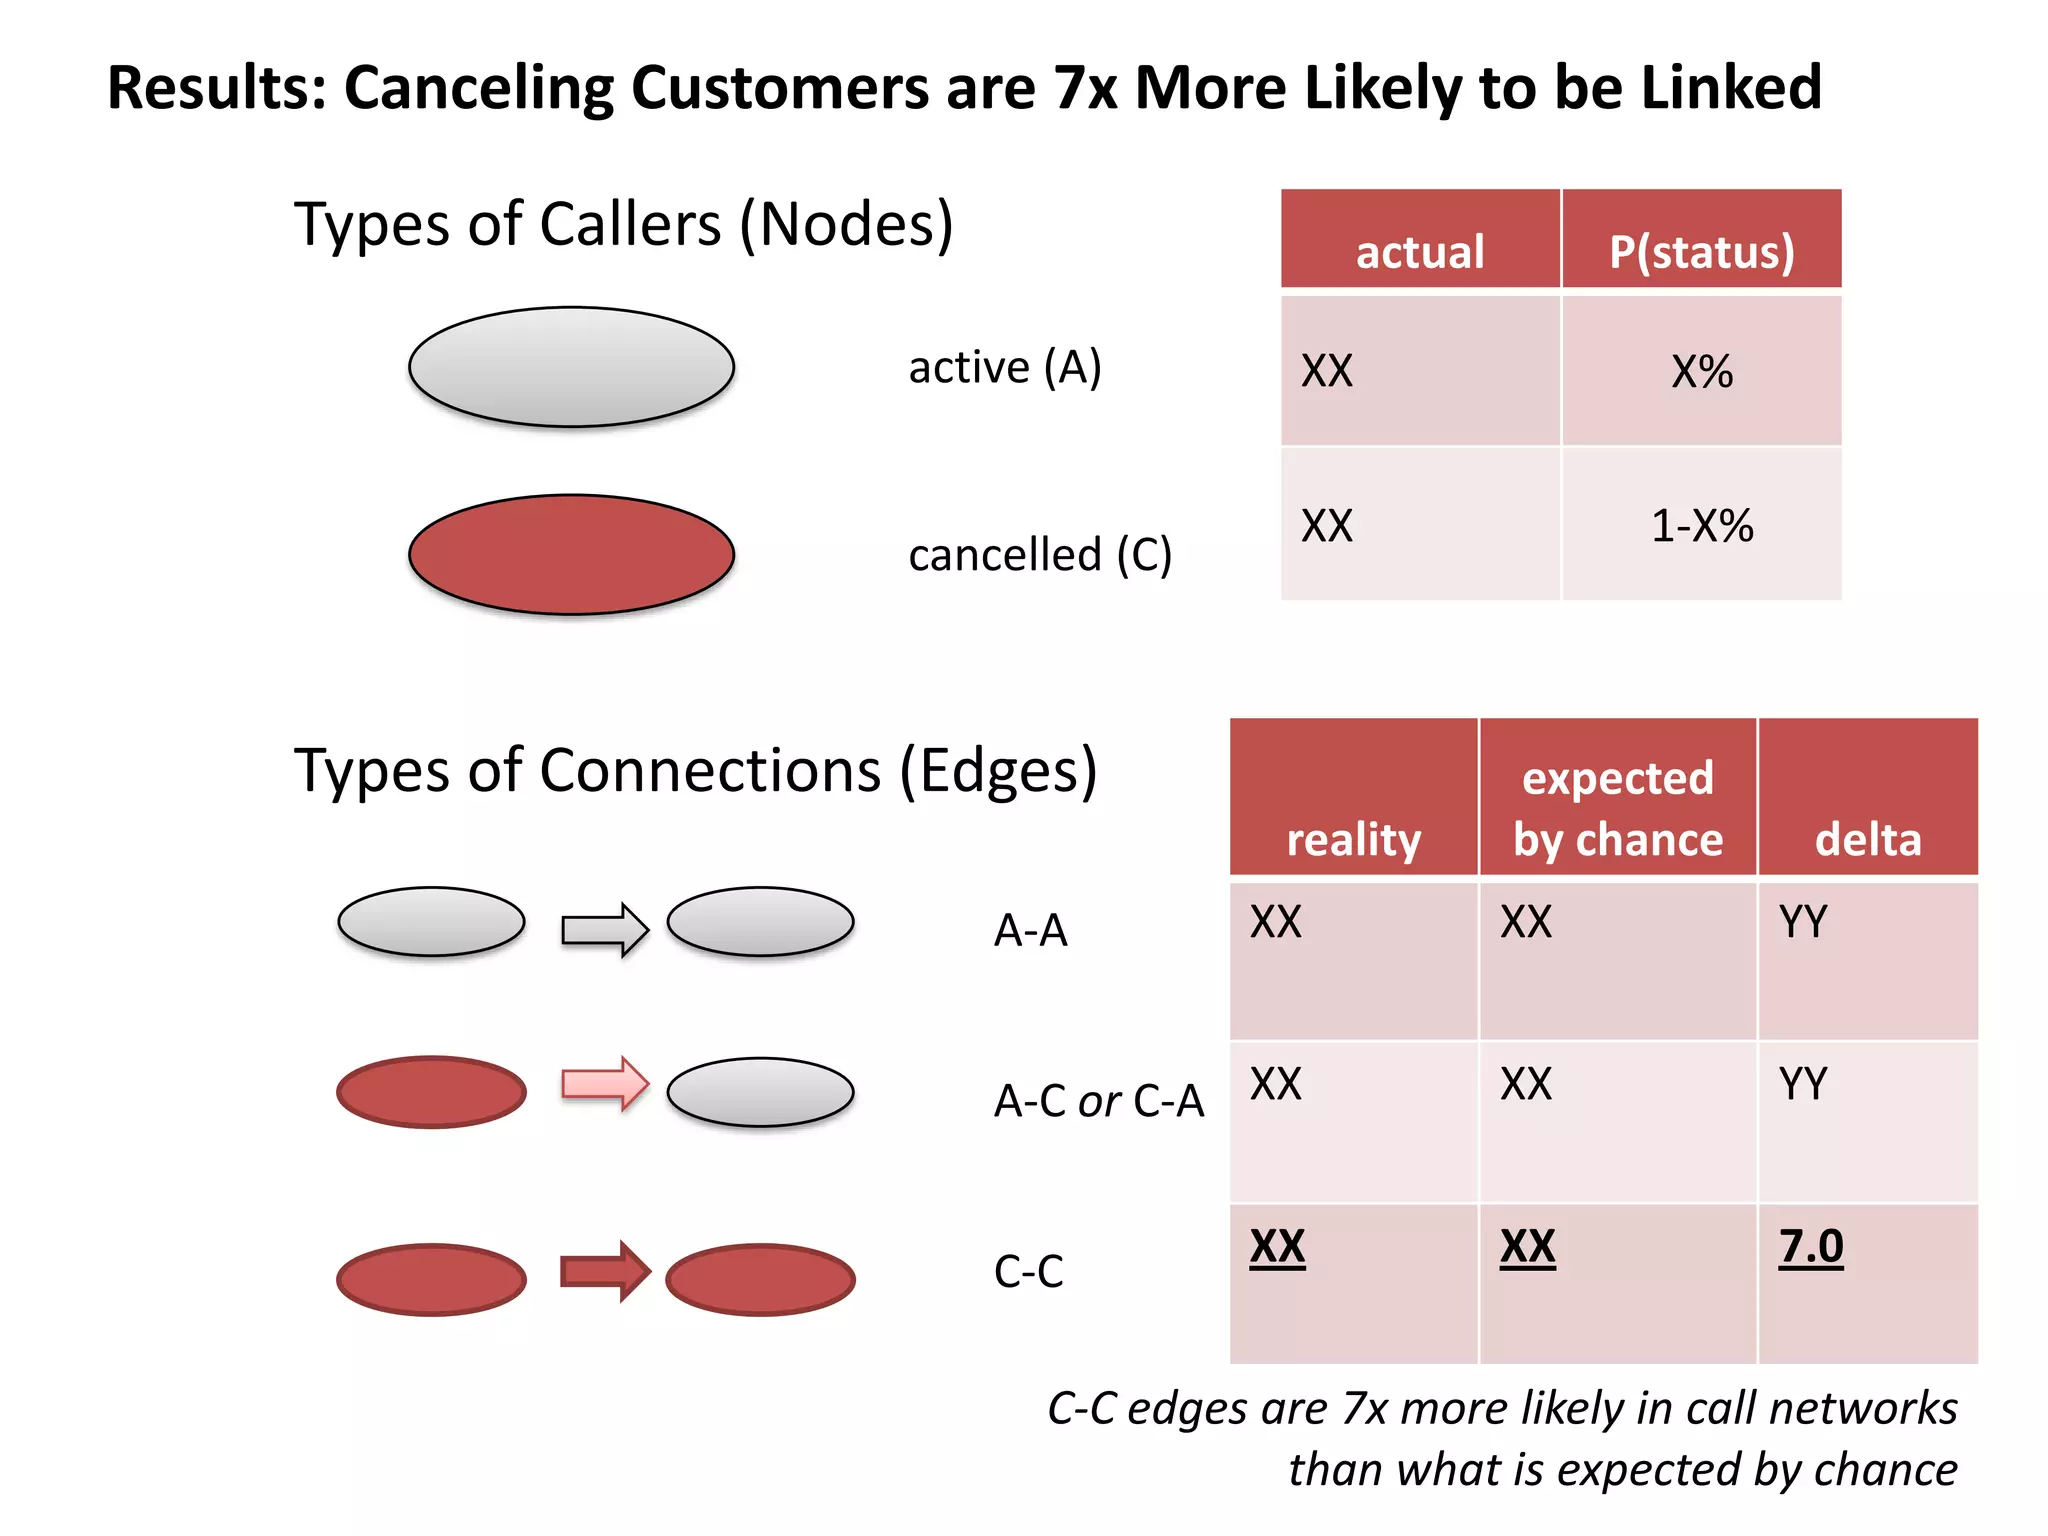
Results: Canceling Customersare 7x More Likely to be LinkedTypes of Callers (Nodes)active (A)cancelled (C)Types of Connections (Edges)A-AA-C or C-AC-CC-C edges are 7x more likely in call networks than what is expected by chance
14.
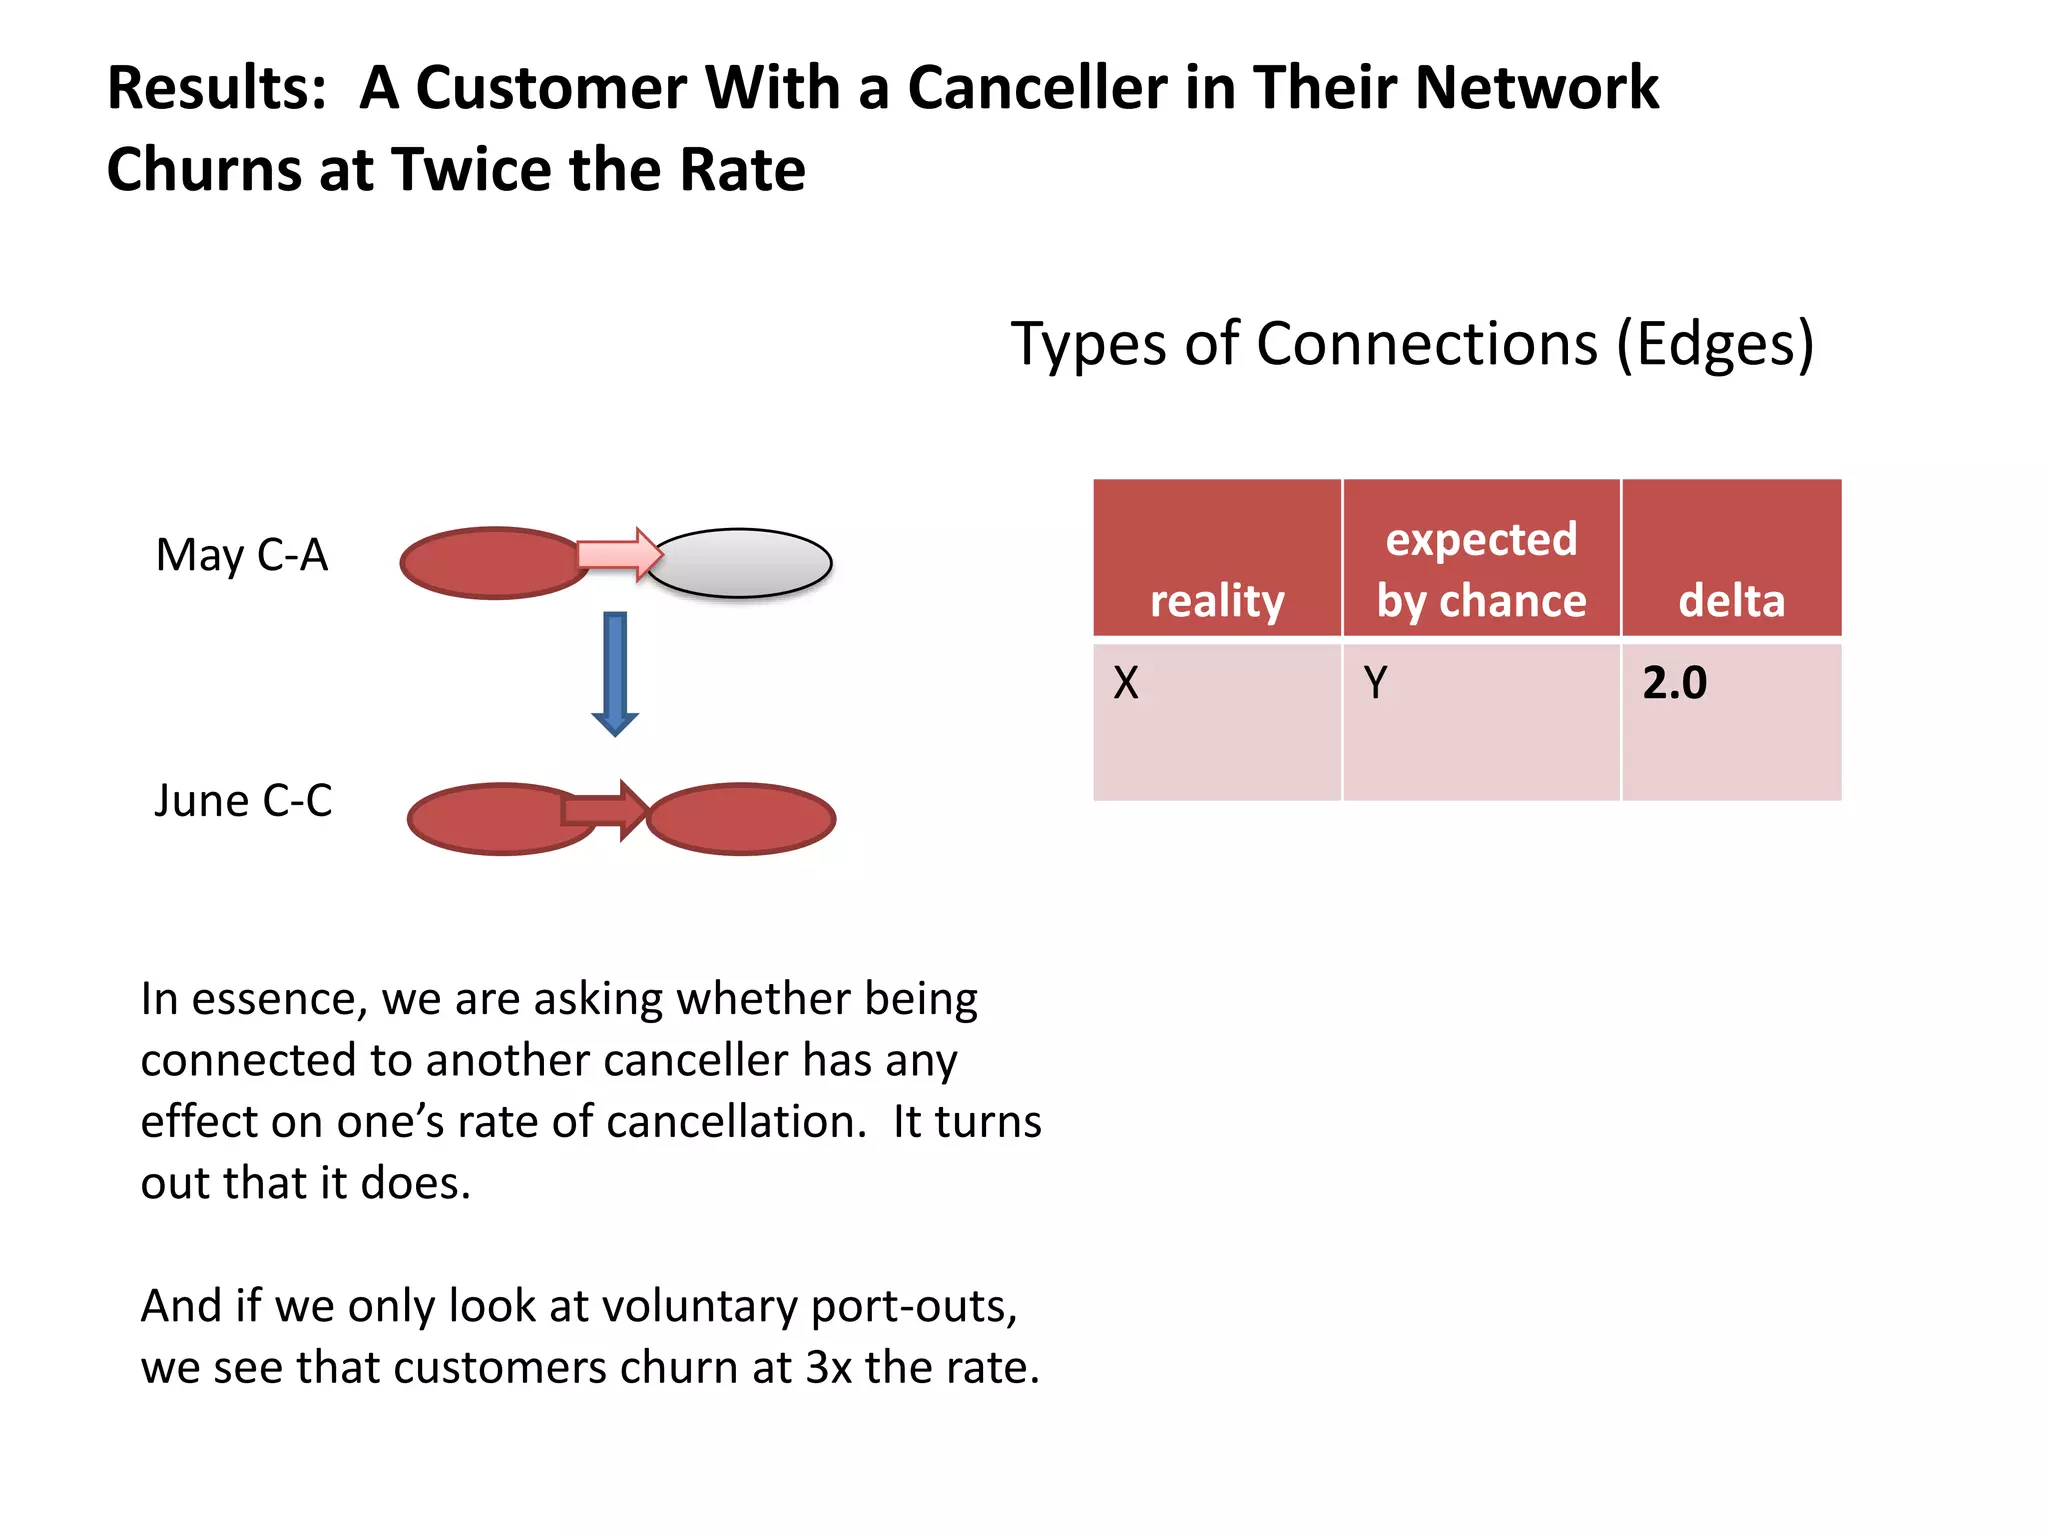
Results: ACustomer With a Canceller in Their Network Churns at Twice the RateTypes of Connections (Edges)May C-AJune C-CIn essence, we are asking whether being connected to another canceller has any effect on one’s rate of cancellation. It turns out that it does. And if we only look at voluntary port-outs, we see that customers churn at 3x the rate.
15.
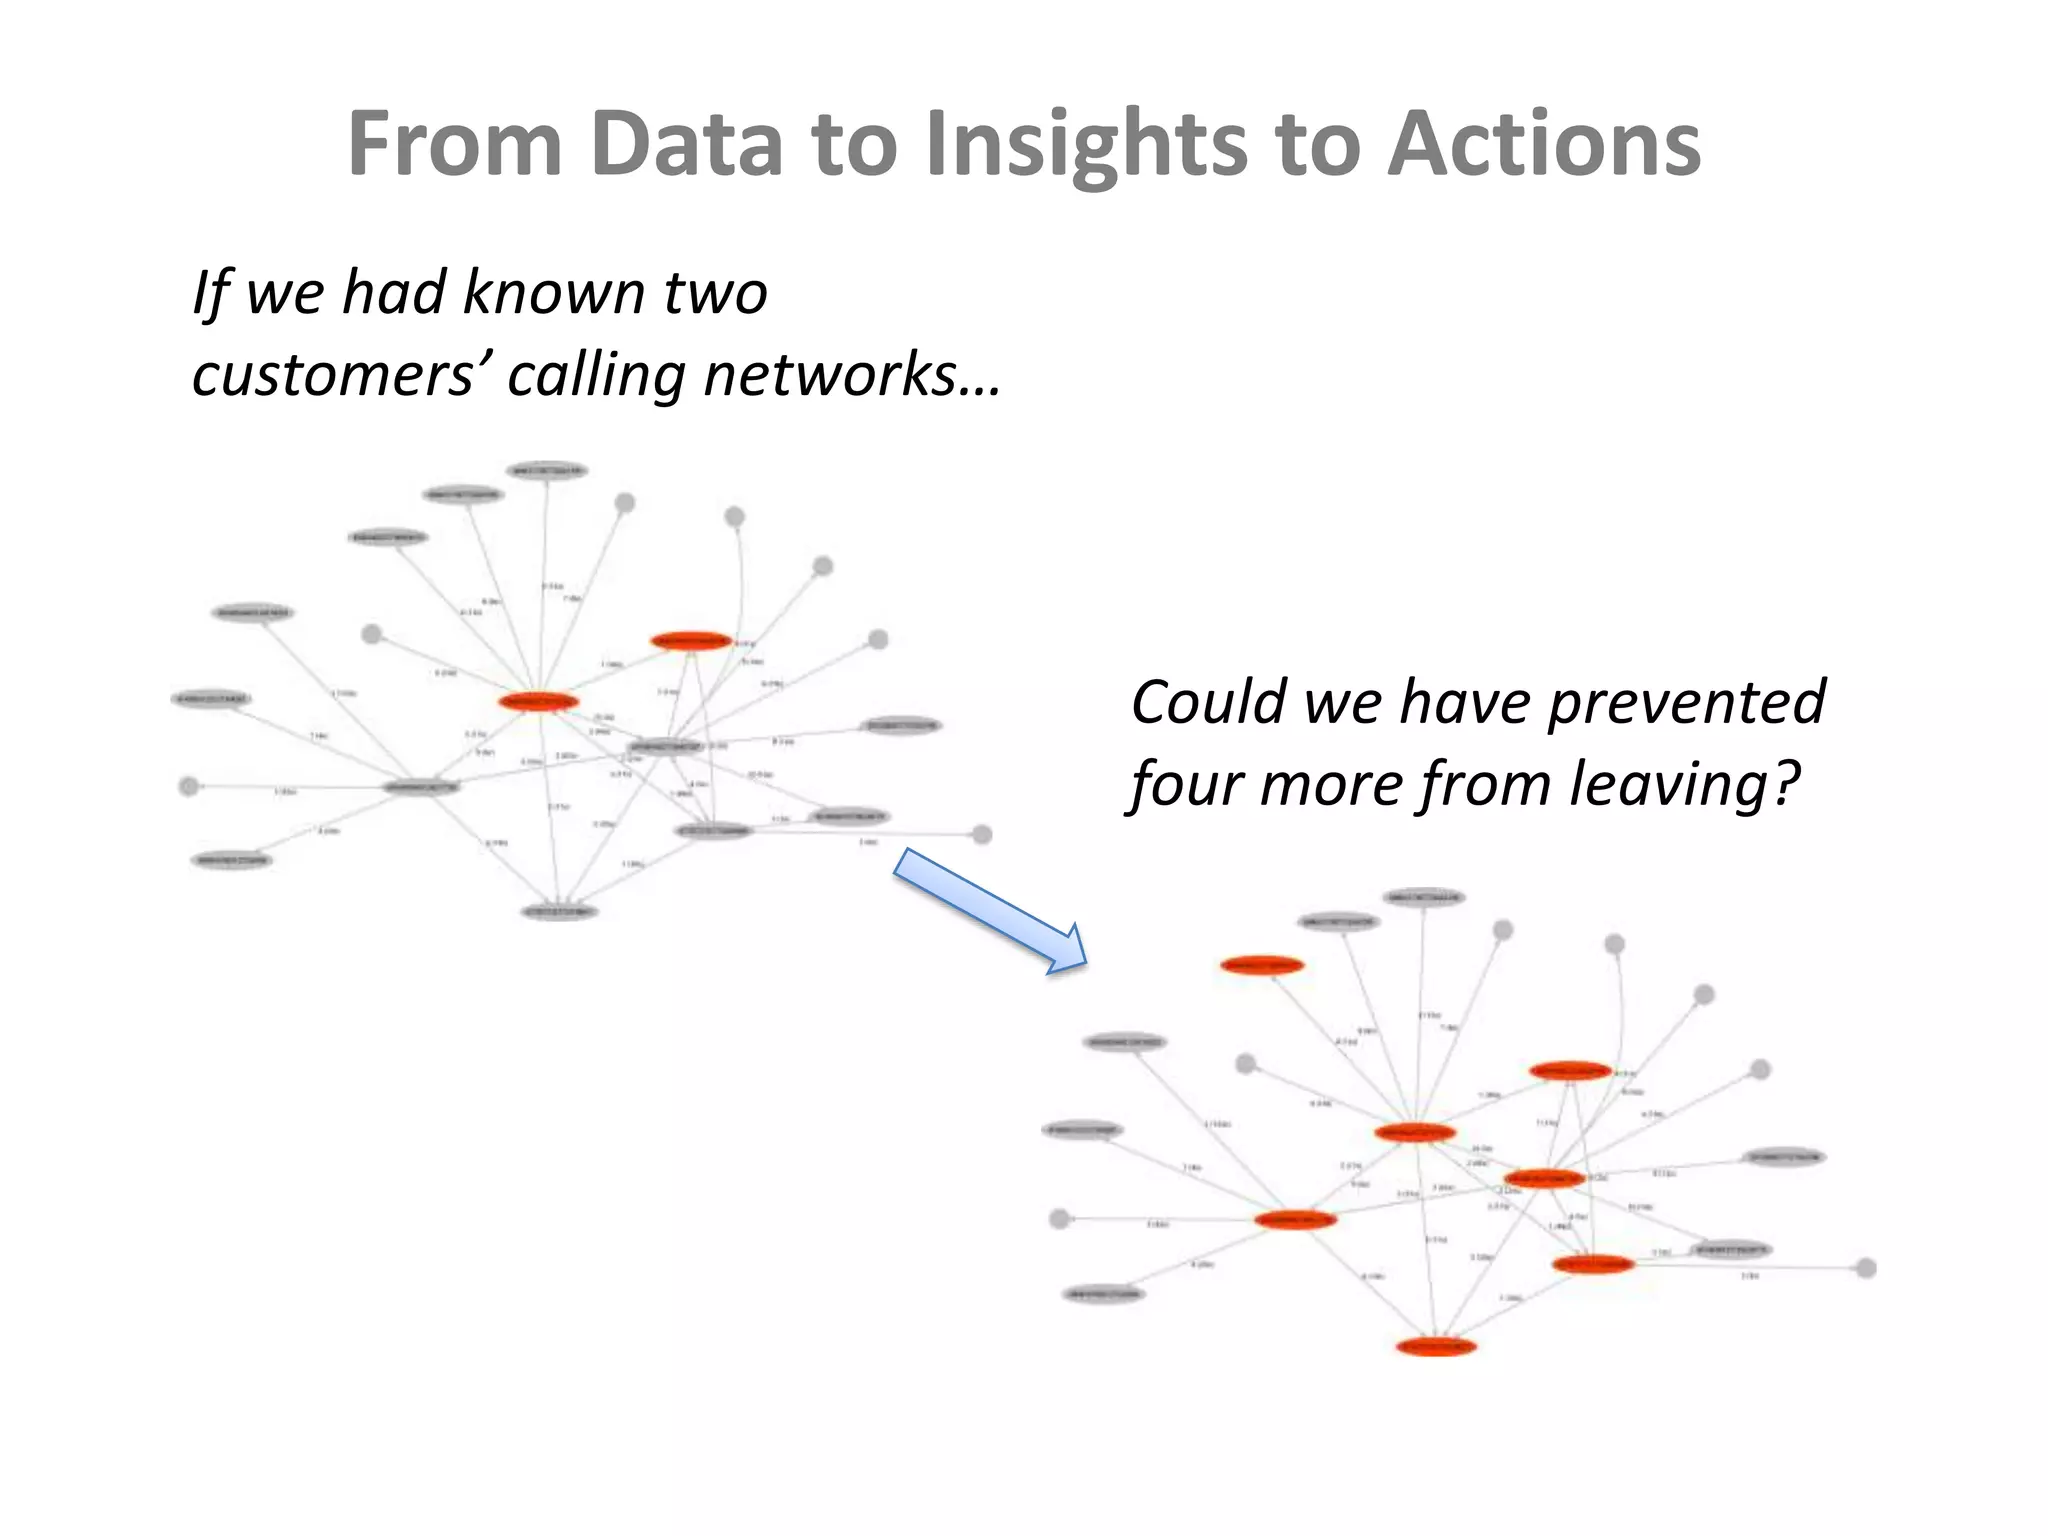
From Data toInsights to ActionsIf we had known two customers’ calling networks…Could we have prevented four more from leaving?
16.
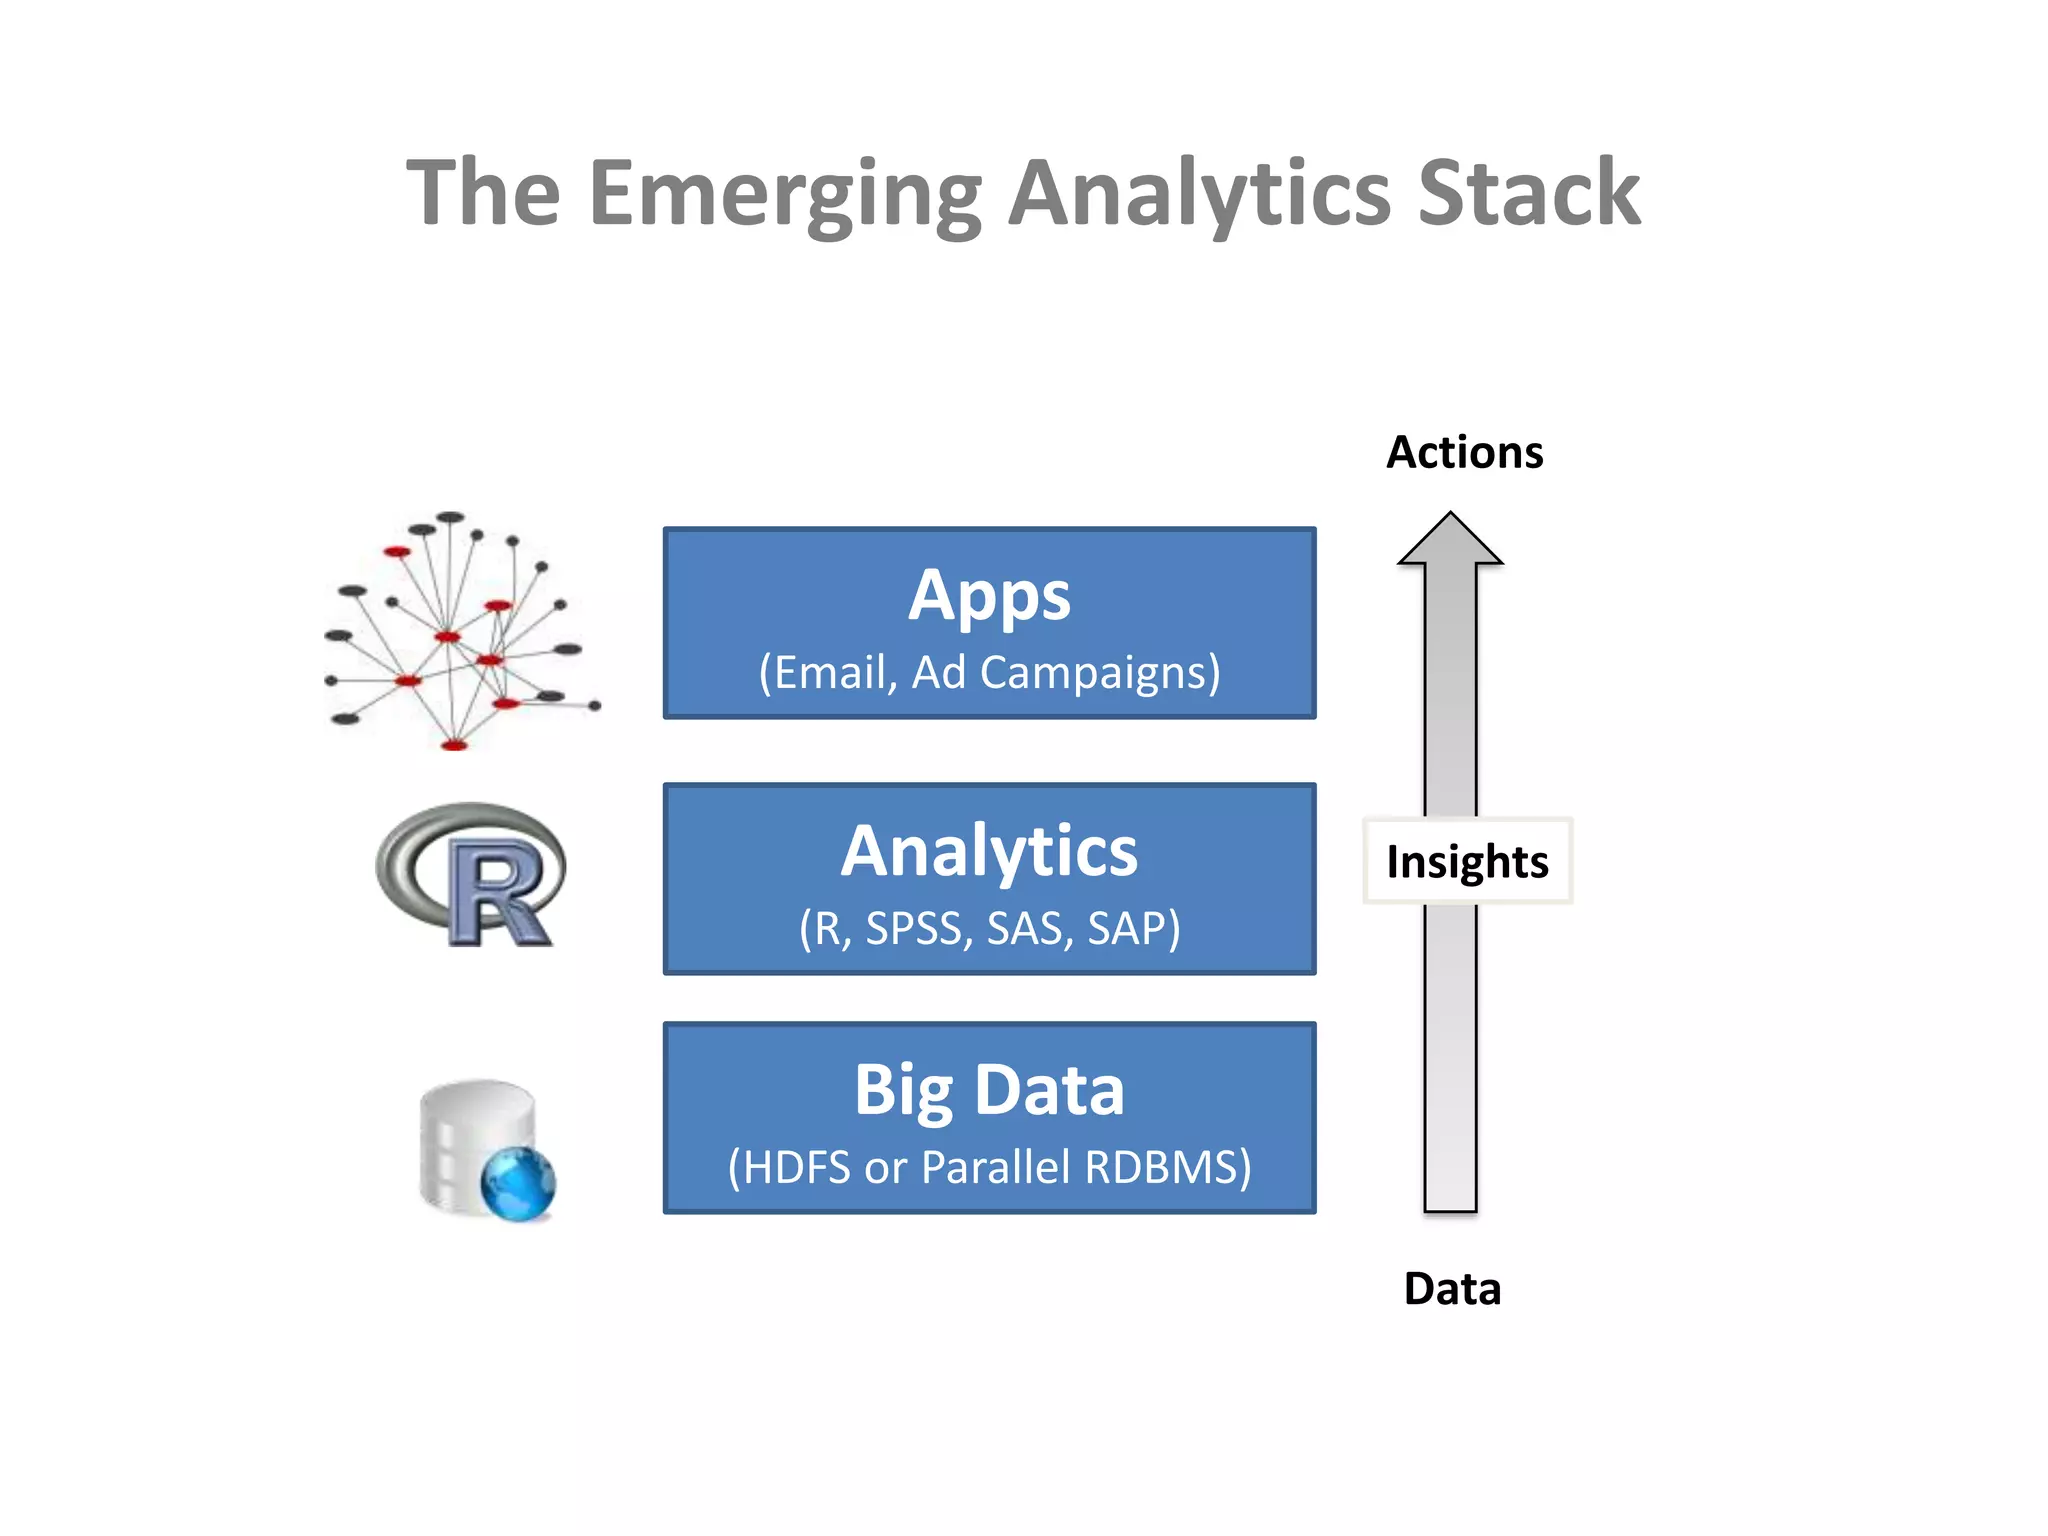
The Emerging AnalyticsStackActionsApps (Email, Ad Campaigns)Analytics(R, SPSS, SAS, SAP)InsightsBig Data(HDFS or Parallel RDBMS) Data
17.
ReferencesEnhancing Customer Knowledgeat Optus, Teradata Case-Study (September 2009).IBM’s Analytics Tapped to Predict, Prevent Churn. Telephony Online (April 2009). The Elements of Statistical Learning, Hastie, Tibshirani, Friedman. Springer. (February 2009).Study Shows Obesity Can Be Contagious, Gina Kolata, The New York Times (July 25, 2007) [great example of homophily]ContactMichael E. Driscoll, Ph.D.med@dataspora.comFollow @datasporaon Twitter
Editor's Notes
#4 Most telcos lose 1-2% of their customers every month.It’s 7x more expensive to acquire a customer, than to retain.
#14 Birds of a feather flock together; cancellers clump together, so do active users. Like vinegar and water, we see enrichment for “like-like” edges in our network, and dilution of “dissimilar” edges (the A-C or C-A). Upshot: people cancellationQuestion: is this all an artifact of family plans – where a bunch of subscribers quits together? In part yes, but the trends hold up even when we do a temporal analysis.
#15 Key take-home point here is that this analysis , looking at the May to June transition, removes
#17 The stack is loosely coupled: right tool for the right job. The need for a dedicated analytics RDBMS

![ReferencesEnhancing Customer Knowledge at Optus, Teradata Case-Study (September 2009).IBM’s Analytics Tapped to Predict, Prevent Churn. Telephony Online (April 2009). The Elements of Statistical Learning, Hastie, Tibshirani, Friedman. Springer. (February 2009).Study Shows Obesity Can Be Contagious, Gina Kolata, The New York Times (July 25, 2007) [great example of homophily]ContactMichael E. Driscoll, Ph.D.med@dataspora.comFollow @datasporaon Twitter](https://image.slidesharecdn.com/socialyticsfortelecomsdataspora16feb2010-100406123127-phpapp01/75/Social-Network-Analysis-for-Telecoms-17-2048.jpg)


![Deriving economic value for CSPs with Big Data [read-only]](https://cdn.slidesharecdn.com/ss_thumbnails/derivingeconomicvalueforcspswithbigdata-final11sep2013read-only-130911045922-phpapp02-thumbnail.jpg?width=640&height=640&fit=bounds)