General Principles of Intellectual Property: Concepts of Intellectual Proper...
Areejit Samal Regulation
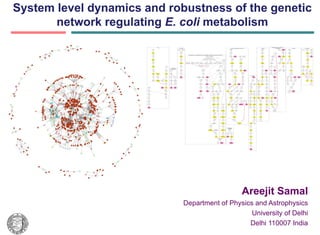
1. System level dynamics and robustness of the genetic
network regulating E. coli metabolism
Areejit Samal
Department of Physics and Astrophysics
University of Delhi
Delhi 110007 India
2. Outline
• Background
• System: E. coli transcriptional regulatory network
controlling metabolism (iMC1010v1)
• Simulation results
• Design features of the regulatory network
• Conclusions
June 15, 2009 Areejit Samal
3. Cell
Gene A
5’ 3’
Promoter Coding region
Gene B
5’ 3’
DNA Promoter Coding region
Gene C
mRNA 5’ 3’
Promoter Coding region
mRNA
Transcriptional
Regulatory mRNA
Network
Protein
Protein
Protein A Protein B Protein C
Interaction
Network
Metabolic
Network
Metabolite
A B C D
Metabolic Pathway
Cell can be viewed as a ‘network of networks’
4. Cell
Environment
Gene A
5’ 3’
Promoter Coding region
Gene B
5’ 3’
DNA Promoter Coding region
Gene C
mRNA 5’ 3’
Promoter Coding region
mRNA
Transcriptional
Regulatory mRNA
Network
Protein
Protein
Protein A Protein B Protein C
Interaction
Network
Metabolic
Network
Metabolite
A B C D
Metabolic Pathway
Cell can be viewed as a ‘network of networks’
5. Boolean network approach to model Gene
Regulatory Networks
• Boolean networks were introduced by Stuart Kauffman as a framework to
study dynamics of Genetic networks.
• In this approach, gene expression is quantized to two levels:
– on or active (represented by 1) and
– off or inactive (represented by 0).
• Each gene at any point of time is in one of the two states (i.e. active or
inactive).
• In this approach, time is taken as discrete.
• Also, the expression state of each gene at any time instant is determined by
the state of its input genes at the previous time instant via a logical rule or
update function.
6. Simplified Diagram of the Transcriptional Regulatory
Network controlling metabolism
• An input may activate or repress the expression of the
gene.
For example:
Gene B [t+1] = NOT Gene A [t]
• When there are more than one input to a gene, the
expression state of the gene will be determined by the
state of the inputs based on a logical rule.
• This logical rule may be expressed in terms of Boolean
operators (AND, OR, NOT).
• For example:
Gene C [t+1] = Gene A [t] AND NOT Gene B [t]
• The state of Gene C determines if the metabolic reaction can
occur inside the cell.
Metabolic reaction
June 15, 2009 Areejit Samal
7. Modelling Gene Regulatory Networks as Random
Boolean Networks
In the absence of data on real genetic networks, Boolean networks have been
used primarily to study the dynamics of the genetic networks that were
– either members of ensemble of random networks or
– networks generated using the knowledge of the connectivity of genes and
TF in an organism along with random Boolean rules at each node as input
function governing the output state of the gene
June 15, 2009 Areejit Samal
8. E. coli transcriptional regulatory network controlling
metabolism (iMC1010v1)
In this work, we have studied the database iMC1010v1 containing the
transcriptional regulatory network (TRN) controlling E. coli metabolism has
become available. The network contained in the database was reconstructed from
primary literature sources.
The database iMC1010v1 contains the following types of information:
– the connections between genes and transcription factors (TF)
– dependence of genes and TF activity based on presence or absence of
external metabolites or nutrients in the environment
– the Boolean rule describing the regulation of each gene as a function of the
state of the input nodes
Available at:
Bernhard Palsson’s Group Webpage
(http://gcrg.ucsd.edu/)
June 15, 2009 Areejit Samal
9. Schematic of Transcriptional Regulatory
Network controlling metabolism
5’ Gene A 3’
Promoter Coding region
5’ Gene B 3’
DNA Promoter Coding region
mRNA 5’ Gene C 3’
Promoter Coding region
mRNA
Transcriptional
Regulatory mRNA
Network
Protein
Protein A Protein B Protein C
Metabolic
Network
C D
June 15, 2009 Metabolic
Areejit Samal reaction
10. Description of the E. coli TRN controlling
metabolism (iMC1010v1)
• There are 583 genes in this network which can be further subdivided
into
– 479 genes that code for metabolic enzymes
– 104 genes that code for TF
• The state of these 583 genes is dependent upon
– the state of 103 TF and
– presence or absence of 96 external metabolites
• The database provides a Boolean rule for each of the 583 genes
contained in the network.
June 15, 2009 Areejit Samal
11. The pink nodes
represent genes
coding for TF, brown
nodes represent
genes that code for
metabolic enzymes
and the green nodes
represent external
metabolites.
The complete
network can be
subdivided into a
large connected
component and few
small disconnected
components.
June 15, 2009 Areejit Samal
12. Example of an input function in form of a Boolean
rule controlling the output state of a gene
A B C
Truth Table
b2731 o2(e)
b3202
A B C OUTPUT
0 0 0 0
0 0 1 0
0 1 0 0
0 1 1 0
1 0 0 0
b2720 1 0 1 0
1 1 0 1
OUTPUT 1 1 1 0
b2720[t+1] = IF ( b2731[t] AND b3202[t] AND NOT o2(e)[t])
June 15, 2009 Areejit Samal
13. The Dynamical System
We have used the information in the database to construct the following
discrete dynamical system:
gi (t 1) Gi ( g (t ), m)
i 1...583
gi (t 1) denotes the state of ith gene at time t+1 that is either 1 or 0.
g (t ) is vector that collectively denotes the state of all genes at time t
m is a vector of 96 elements (each 0 or 1) determining the state of the environment
Gi contains all the information regarding the internal wiring of the network as well
as the regulatory logic
Areejit Samal
June 15, 2009
14. State of the genetic network
The state of the 583 genes at any given time instant gives the state of the
network.
g(t)
g1 (t )
g (t ) where gi(t) = 0 or 1; i = 1 …. 583
2 Since each gene at any given time instant can be in one
g3 (t ) of the two states (0 or 1), the size of the state space is
. 2583.
.
.
g (t )
583
June 15, 2009 Areejit Samal
15. State of the environment
The presence or absence of the 96 external metabolites decide the state of the
environment.
m where mi = 0 or 1; i = 1 …. 96
m1 If an external metabolite or nutrient is present in the external
m environment, then we set the mi corresponding to it equal to 1
2 or else 0.
.
In general, the concentration of external metabolites change
. with time.
m96 In the present study, we have considered buffered minimal
media (i.e., vector m constant in time).
June 15, 2009 Areejit Samal
16. E. coli TRN controlling metabolism as a Boolean
dynamical system
Stuart Kauffman (1969,1993) studied dynamical systems of the form:
gi (t 1) Gi ( g (t ))
17. E. coli TRN controlling metabolism as a Boolean
dynamical system
Stuart Kauffman (1969,1993) studied dynamical systems of the form:
gi (t 1) Gi ( g (t ))
The present database allowed us to systematically account for the effect of presence or
absence of nutrients in the environment on the dynamics of the regulatory network.
g i (t 1) Gi ( g (t ), m )
18. Attractors of the E. coli TRN
• In the Boolean approach, the configuration space of the system is finite. The
discrete deterministic dynamics ensures that the system eventually returns to a
configuration which it had at a previous time instant. The sequence of states
that repeat themselves periodically is called an attractor of the system.
• Starting from any one of the 2583 vectors as the initial configuration of genes
and a fixed environment, the system can flow to different attractors for different
initial configuration of genes.
June 15, 2009 Areejit Samal
19. The Network exhibits stability against perturbations
of gene configurations for a fixed environment
gi (t 1) Gi ( g (t ), m)
Start with different g(t) as initial configuration of Fix m to some buffered
genes, and determine the attractor for the system minimal media e.g. Glucose
for each initial configuration of genes. aerobic condition
Question 1: How many attractors of the system do we obtain starting from different initial
configuration of genes and for a fixed environment?
Answer 1: We found that the attractors of the genetic network were typically fixed points or
two cycles. For a given environment, the number of different attractors were up to 8 fixed
points and 28 two cycles. However, the maximum hamming distance between any two
attractor states for a given environment was 21. Hence, the states of most genes (≥562)
was same in all attractor states for a given environment.
We found that the network exhibits homeostasis or stability against perturbations of initial
gene configurations for a fixed environment.
June 15, 2009 Areejit Samal
20. Cellular Homeostasis
600 The graph shows that starting
Random initial condition from even a initial
Hamming inverse of the attractor
configuration of genes that is
Hamming distance w.r.t. glucose
500
Attractor for glutamate aerobic medium
aerobic condition attractor
Attractor for acetate aerobic medium
inverse of the attractor for the
400
glucose aerobic minimal
media the system reaches the
300
attractor in four time steps.
200
Thus, any perturbation of
gene configurations will be
100 washed out in few time steps
and the system is robust to
0 such perturbations.
0 1 2 3 4
Time
June 15, 2009 Areejit Samal
21. E. coli TRN exhibits flexibility of response under
changing environmental conditions
gi (t 1) Gi ( g (t ), m)
Determine the attractors of the genetic system for Vary m across a set of 15427
different environments m buffered minimal media
Question 2: How different are the attractors from each other for various environmental
conditions?
Answer 2: We obtained the attractors of the system starting with 15,427 environmental
conditions. The largest hamming distance obtained between two attractors corresponding to
different environmental conditions was 145.
The system shows flexibility of response to changing environmental conditions.
We found that the system is insensitive to fluctuations in gene configurations for a given fixed
external environment while it can shift to a different attractor when it encounters a change in
the environment. These properties ensure a robust dynamics of the underlying network.
June 15, 2009 Areejit Samal
22. Flexibility of response
3x10⁶
3x10⁶
The graph shows that
2x10⁶
the largest hamming
distance between two
Frequency
2x10⁶
136 138 140 142 144 146
attractors from a set of
attractors for 15,427
1x10⁶
environmental
conditions was 145.
500x103
0
0 20 40 60 80 100 120 140
Hamming distance
June 15, 2009 Areejit Samal
23. Flexibility of response
250
200 Each gene takes a value 0 or 1 in
the 15427 attractors for the
Number of Genes
different environmental
150
conditions. The standard
deviation of a gene’s value
100 across 15427 attractors is a
measure of the gene’s variability
50 across environmental conditions.
0
0 0 - 0.1 0.1 - 0.2 0.2 - 0.3 0.3 - 0.4 0.4 - 0.5
Standard deviation
June 15, 2009 Areejit Samal
24. Functional significance of attractors of TRN controlling
metabolism
1 Gene 1 is active: The enzyme is present to carry out a reaction in the metabolic network
0
Metabolic enzymes
Gene 2 is inactive: The enzyme is absent and a reaction cannot happen in the network
1
0 The attractor of the genetic network for a given
. environment constrains the set of active enzymes that
catalyze various reactions in the metabolic network
.
.
TF
1
Attractor for a
given environment
June 15, 2009 Areejit Samal
25. Flux Balance Analysis (FBA)
INPUT OUTPUT
List of metabolic reactions with
stoichiometric coefficients
Growth rate for the
Flux Balance given medium
Biomass composition Analysis
(FBA) Fluxes of all
reactions
Medium of growth or
environment
Reference: Varma and Palsson, Biotechnology (1994)
June 15, 2009 Areejit Samal
26. Incorporating regulatory constraints within FBA
INPUT OUTPUT
Growth rate (pure)
List of metabolic reactions Flux Balance
Analysis
Biomass composition (FBA) Fluxes of all
reactions
Medium of growth or
environment
June 15, 2009 Areejit Samal
27. Incorporating regulatory constraints within FBA
INPUT OUTPUT
Growth rate (pure)
List of metabolic reactions Flux Balance
Analysis
Biomass composition (FBA) Fluxes of all
reactions
Medium of growth or
environment
m
State of the
environment
June 15, 2009 Areejit Samal
28. Incorporating regulatory constraints within FBA
INPUT OUTPUT
Growth rate (pure)
List of metabolic reactions Flux Balance
Analysis
Biomass composition (FBA) Fluxes of all
reactions
Medium of growth or
environment 1
0
1
m 0
.
State of the .
environment .
1
Attractor of the genetic network
June 15, 2009 Areejit Samal
29. Incorporating regulatory constraints within FBA
INPUT OUTPUT
Subset Growth rate (pure)
List of metabolic reactions Flux Balance
Analysis
Biomass composition (FBA) Fluxes of all
reactions
Medium of growth or
environment 1
0
1
m 0
.
State of the .
environment .
1
Attractor of the genetic network
June 15, 2009 Areejit Samal
30. Incorporating regulatory constraints within FBA
INPUT OUTPUT
Subset Growth rate (pure)
List of metabolic reactions Flux Balance Growth rate (constrained)
Analysis
Biomass composition (FBA) Fluxes of all
reactions
Medium of growth or
environment 1
0
1
The ratio of constrained FBA growth
m 0
. rate to pure FBA growth rate is ≤ 1.
State of the .
environment .
1
Attractor of the genetic network
June 15, 2009 Areejit Samal
31. Adaptability
Question 3(a): What is the ratio of the constrained FBA growth rate to pure
FBA growth rate for various environmental conditions? In other words, is
the regulatory network reaching an attractor that can make optimal use of
the underlying metabolic network?
7000
6000
Answer 3(a): Histogram of
the ratio of constrained FBA
growth rate in the attractor of
5000
Number of media
4000
each of 15427 minimal media
3000 to the pure FBA growth rate
2000
in that medium. This is
peaked at the bin with the
1000
largest ratio ≥ 0.9.
0
0 - 0.1 0.1 - 0.2 0.2 - 0.3 0.3 - 0.4 0.4 -0.5 0.5 - 0.6 0.6 - 0.7 0.7 - 0.8 0.8 - 0.9 0.9 -1.0
Ratio of constrained FBA growth rate to
pure FBA growth rate
June 15, 2009 Areejit Samal
33. Adaptability
1 1 . 1
1 0 . 1 Question 3 (b): How well is the attractor of any particular
medium “adapted” to that medium? Does the movement to the
0 1 . 0
attractor “improve” the cell’s “metabolic functioning” in the
1 0 . 0
. . . . medium?
. . . . 1.4
. . . . Glutamine aerobic medium Answer 3(b):
1.2 Lactate aerobic medium
Growth rate
0
1
.
1
Fucose aerobic medium
Acetate aerobic medium
1.0 increases by a factor
t=0 t=1 t=∞ Growth rate 0.8
of 3.5, averaged over
pairs of minimal
0.6
media
0.4 From one minimal
medium to another
0.2
the average time
m FBA 0.0 taken to reach the
Biomass 0 1 2 3 4 5 attractor is only 2.6
composition Time steps
Thus the regulatory dynamics enables the cell to adapt to
its environment to improve its metabolic efficiency very
GR(t=0) GR(t=1) GR(t=∞)
substantially, fairly quickly.
June 15, 2009 Areejit Samal
34. The graph shows
the genetic
network
controlling E. coli
metabolism.
June 15, 2009 Areejit Samal
35. Design Features of the network explain
Homeostasis and Flexibility
External Metabolites
Transcription factors
Metabolic Genes
June 15, 2009 Areejit Samal
36. Design Features of the network explain
Homeostasis and Flexibility
External Metabolites
This is an acyclic graph
with maximal depth 4.
Fixing the environment
leads to fixing of TF
states and also the leaf
nodes leading to
homeostasis. But when Transcription factors
we change the
environment, then the
attractor state changes
endowing system with
the property of flexible
Metabolic Genes
response.
June 15, 2009 Areejit Samal
37. Design Features of the network explain
Homeostasis and Flexibility
External Metabolites
The very few feedbacks
Internal Metabolites
from metabolism on to
transcription factors
are through the
concentration of
internal metabolites.
Transcription factors
Metabolic Genes
June 15, 2009 Areejit Samal
38. Modularity, Flexibility and Evolvability
This is a highly
disconnected
structure.
The disconnected
components are
dynamically independent
and hence can be
regarded as modules.
Such a structure can
facilitate during
evolution to new
environmental niches.
June 15, 2009 Areejit Samal
39. Almost all input functions in the E. coli TRN are
canalyzing functions
• When a gene has K inputs, then in general there can be 2 to the power
of 2K input Boolean functions that can exist.
– As K increases the number of possible Boolean functions also
increases.
• A Canalyzing Boolean function has at least one input such that for at
least one input value for that input the output value is fixed.
• Stuart Kauffman proposed that Canalyzing Boolean functions are likely
to be over-represented in the real networks.
• We found that all except four Boolean functions in the E. coli TRN were
canalyzing.
June 15, 2009 Areejit Samal
40. Design Features of the network
• The genetic network regulating E. coli metabolism is
– Largely acyclic
– Hierarchical
– Root control with environmental variables
– Disconnected and modular structure at the level of transcription factors
– Preponderance of canalyzing Boolean functions
• There are some small cycles that exist due of presence of control by
fluxes or internal metabolites but these cycles are very localized.
• Note that cycles are expected in developmental systems such as
cell cycle which is a temporal phenomena.
• In metabolism, lack of cycles at the genetic level can be an
advantage as this is a slow process.
• Most cycles in metabolism exist at the level of enzymes and internal
metabolites such a process is faster.
June 15, 2009 Areejit Samal
41. Dynamics of the E. coli TRN controlling metabolism is highly
ordered in contrast to that of Random Boolean Networks
Reference: S.A. Kauffman (1993)
Kauffman found that Random Boolean Networks (RBN)
with K=2 are at the edge of chaos using Derrida Plot.
Derrida plot is the discrete analog of the Lyapunov
coefficient. Derrida plot for RBNs with K>2 are found to
be above the diagonal and their dynamics is quite chaotic.
June 15, 2009 Areejit Samal
43. Dynamics of the E. coli TRN controlling metabolism is highly
ordered in contrast to that of Random Boolean Networks
500
K can be as large as 8
400
H(1)
300
200
100
0
0 100 200 300 400 500
H(0)
Reference: S.A. Kauffman (1993) Reference: A. Samal and S. Jain (2008)
Kauffman found that Random Boolean Networks (RBN) The E. coli TRN controlling metabolism has
with K=2 are at the edge of chaos using Derrida Plot. input functions with K=8 also. However,
Derrida plot is the discrete analog of the Lyapunov the dynamics of the E. coli TRN is highly
coefficient. Derrida plot for RBNs with K>2 are found to ordered .
be above the diagonal and their dynamics is quite chaotic.
June 15, 2009 Areejit Samal
44. System is far from edge of chaos
• The simple architecture of the genetic network controlling E. coli
metabolism endows the system with the property of
– Homeostasis
– Flexibility of response
• Note that the dynamics is highly ordered and the system is far from
the edge of chaos. It has been argued that the advantage of a
system staying close to the edge of chaos lies in its ability to
evolvable and be flexible.
• We have shown that the real system has an architecture with root
control by environmental variables which is highly flexible, evolvable
and far from the edge of chaos.
• Such an architecture of the regulatory network can also be useful for
organisms with different cell types.
June 15, 2009 Areejit Samal
45. Acknowledgement
Collaboration
Sanjay Jain
University of Delhi, India
Reference
June 15, 2009 Areejit Samal