
Recommended
More Related Content
Recently uploaded
Recently uploaded (20)
Featured
Featured (20)
Baseball Probability 56 V .400 Ba
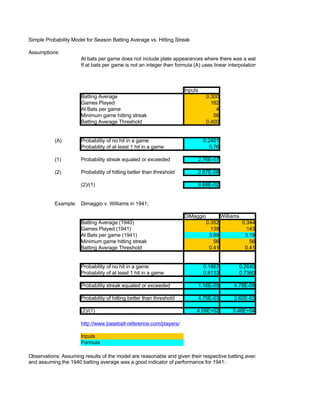
- 1. Simple Probability Model for Season Batting Average vs. Hitting Streak Assumptions: At bats per game does not include plate appearances where there was a walk or HBP If at bats per game is not an integer then formula (A) uses linear interpolation Inputs Batting Average 0.300 Games Played 162 At Bats per game 4 Minimum game hitting streak 56 Batting Average Threshold 0.400 (A) Probability of no hit in a game 0.2401 Probability of at least 1 hit in a game 0.76 (1) Probability streak equaled or exceeded 2.76E-07 (2) Probability of hitting better than threshold 2.67E-08 (2)/(1) 9.68E-02 Example: Dimaggio v. Williams in 1941; DiMaggio Williams Batting Average (1940) 0.352 0.344 Games Played (1941) 139 143 At Bats per game (1941) 3.89 3.19 Minimum game hitting streak 56 56 Batting Average Threshold 0.41 0.41 Probability of no hit in a game 0.1867 0.2640 Probability of at least 1 hit in a game 0.8133 0.7360 Probability streak equaled or exceeded 1.16E-05 4.78E-08 Probability of hitting better than threshold 4.75E-03 2.62E-03 (2)/(1) 4.09E+02 5.48E+04 http://www.baseball-reference.com/players/ Inputs Formula Observations: Assuming results of the model are reasonable and given their respective batting averages in 1940, their respective and assuming the 1940 batting average was a good indicator of performance for 1941:
- 2. I It was more than 400 times more likely that DiMaggio would hit .406 or better than that he would hit in 56 II It was almost 55,000 times more likely that Williams would hit .406 or better than that he would hit in 56 or III DiMaggio was about 243 times more likely than Williams to hit in 56 or more consecutive games in 1941 IV DiMaggio was about 1.8 times more likely than Williams to hit .406 or better in 1941 V Although Williams played in more games, he walked almost twice as many times as DiMaggio in 1941 The model is very sensitive to input assumptions as a .300 hitter getting 4 at bats (not plate appearances) in each of 162 games is about 11 times more likely to hit in 56 or more consecutive VI games than to hit over .400. Conclusions not necessarily valid since the model uses many simplifying assumptions that are violated in game are uniform and independent; prior batting average remains constant for every at bat; linear interpo VII estimates probabilities. Since 1900, a .400 average has been equaled or exceeded 13 times (but not since 1941) so one would e VIII 10 to 15 times more likely to hit .400 or more than to hit in 56 consecutive games There have been a little less than 17,000 major leaguers since 1900. Assuming half were pitchers and the then the probability of hitting .400 or better is empirically around order of magnitude 1/10,000 (1E-04) and IX games is empirically order of magnitude 1E-05).
- 3. e was a walk or HBP interpolation W/D 2.43E+02 W/D 1.81E+00 batting averages in 1940, their respective games played and at bats in 1941,
- 4. 06 or better than that he would hit in 56 or more consecutive games 6 or better than that he would hit in 56 or more consecutive games 56 or more consecutive games in 1941 6 or better in 1941 as many times as DiMaggio in 1941 getting 4 at bats (not plate to hit in 56 or more consecutive plifying assumptions that are violated in practice such as : # of at bats per s constant for every at bat; linear interpolation of binomials accurately es (but not since 1941) so one would expect on average it would be about secutive games 00. Assuming half were pitchers and the average career was about 10 years, rder of magnitude 1/10,000 (1E-04) and the probability of hitting in 56 or more