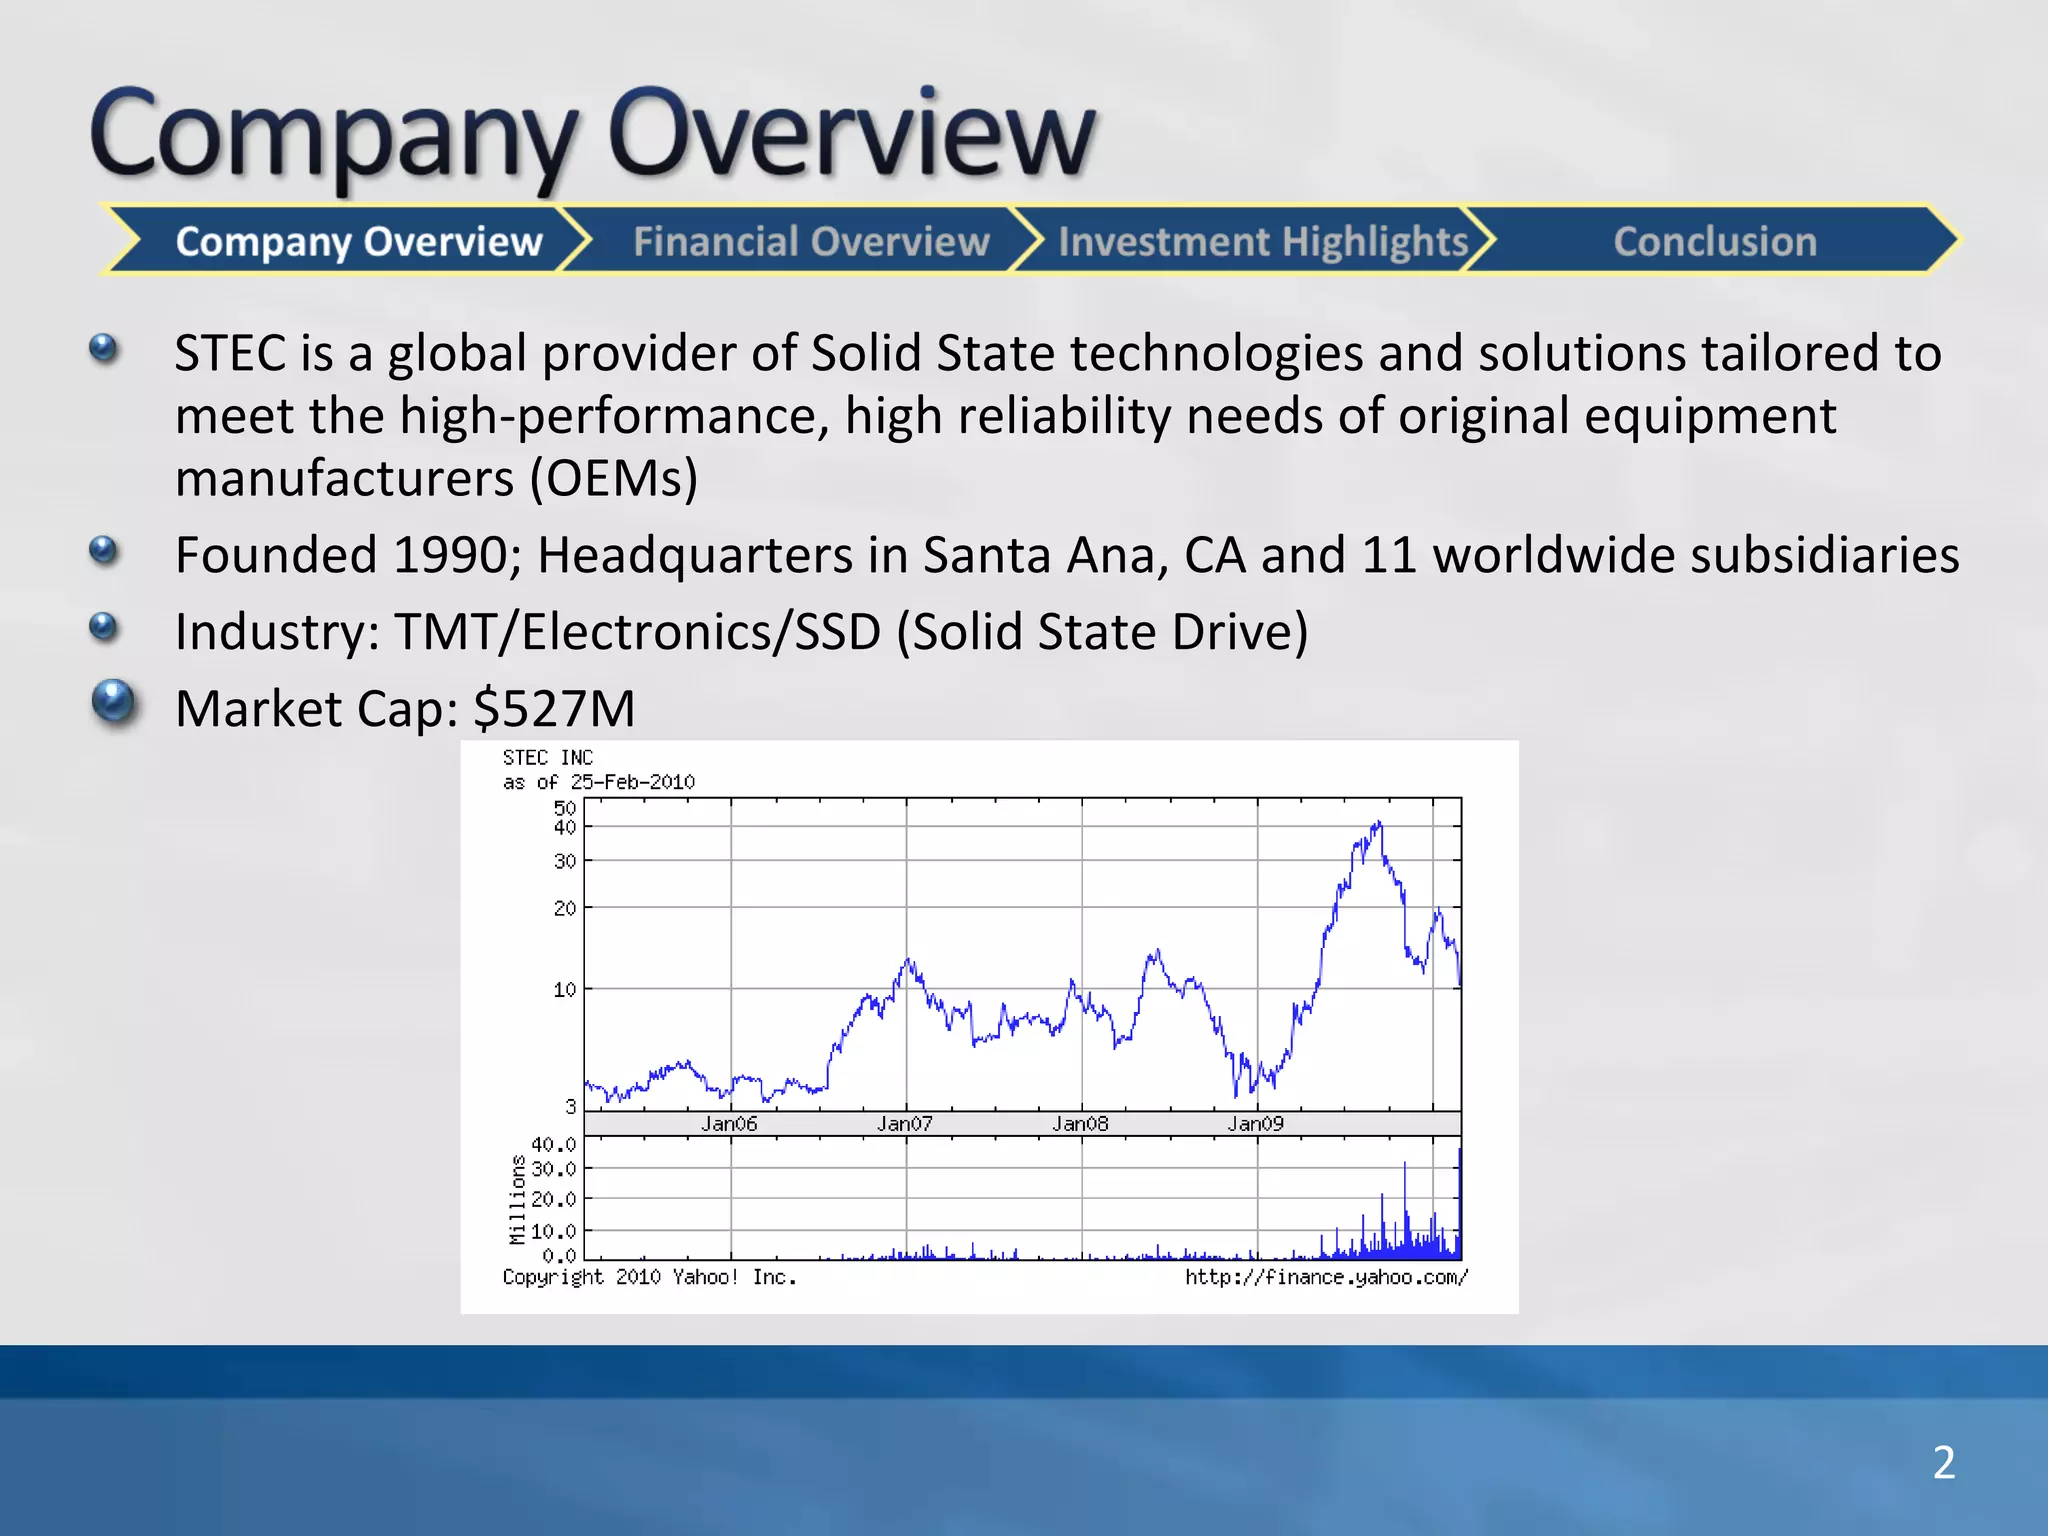
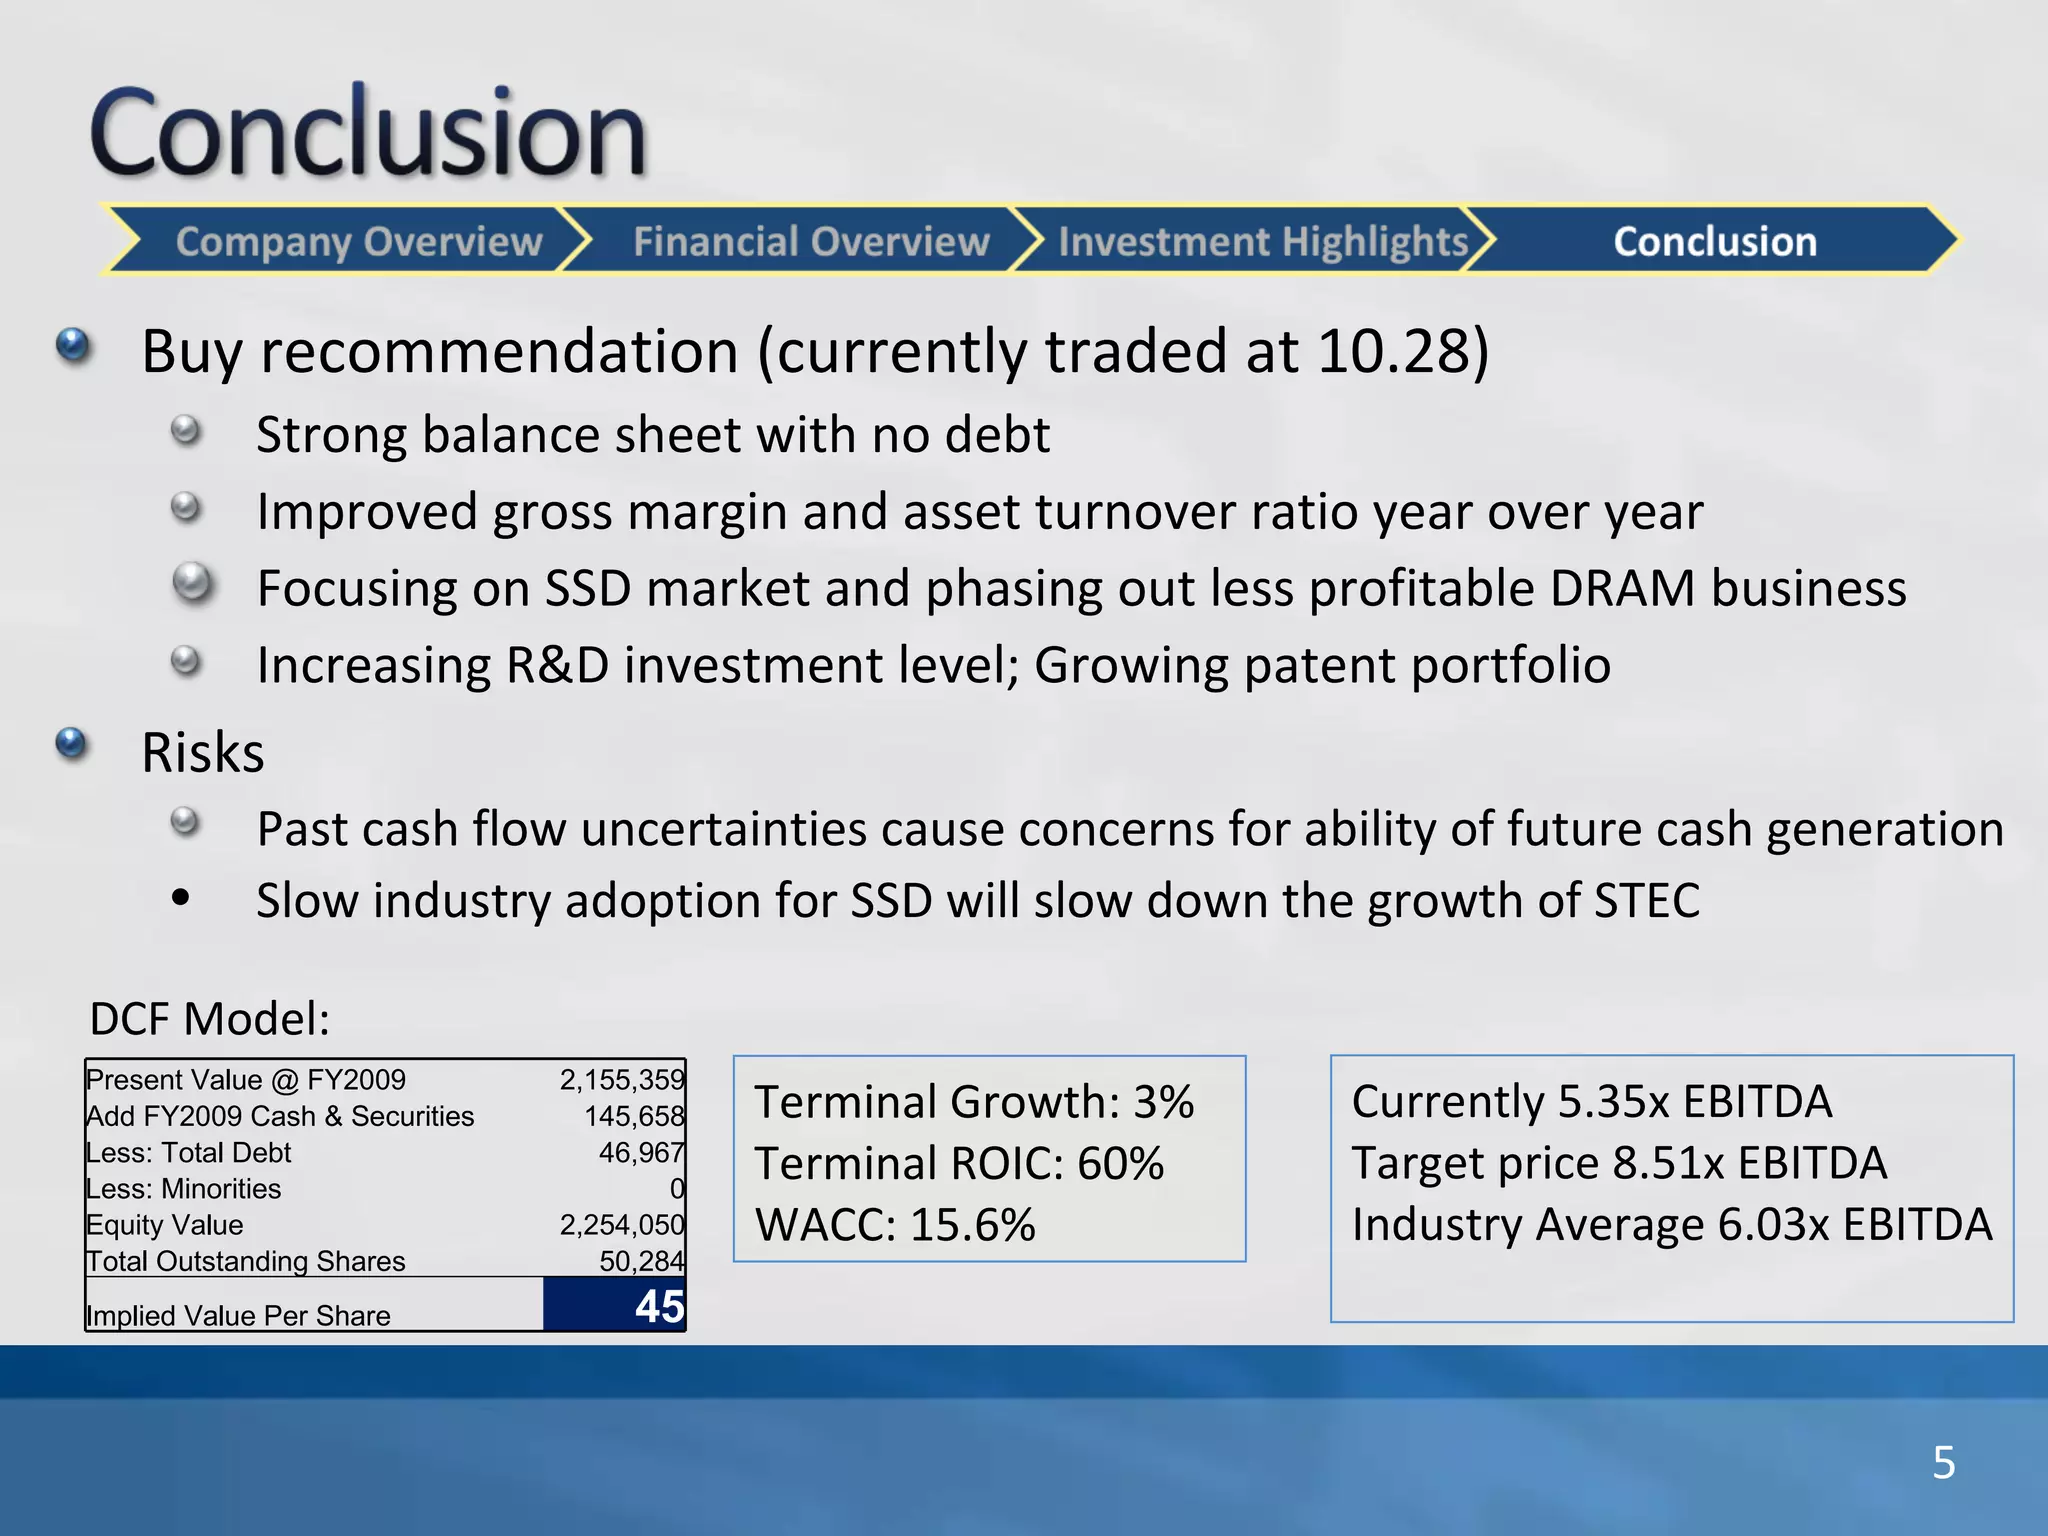
Alan Tang 3-01-2010
STEC is a global provider of Solid State technologies and solutions tailored to meet the high-performance, high reliability needs of original equipment manufacturers (OEMs) Founded 1990; Headquarters in Santa Ana, CA and 11 worldwide subsidiaries  Industry: TMT/Electronics/SSD (Solid State Drive) Market Cap: $527M
  RETURN ON COMMON SHAREHOLDERS' EQUITY   2007 2008 2009   3.3% 2.2% 32.4%           2007 2008 2009 PROFIT MARGIN FOR ROCE 3.1% 1.7% 21.1% ASSET TURNOVER 0.9  1.1  1.3  CAPITAL STRUCTURE LEVERAGE 1.2 1.1 1.2 FY2007A FY2008A FY2009A FY2010E FY2011E FY2012E FY2013E FY2014E Revenue 188,652 227,445 354,183 421,309 498,802 611,696 755,799 937,069 Less: Operating Expenses 6,747 5,485 89,163 109,184 129,267 158,524 195,869 242,846 EBITDA 181,905 221,960 265,020 312,125 369,535 453,172 559,930 694,223 Less: Depreciation & Amortization 4,699 9,233 12,193 15,826 22,093 29,160 37,892 48,719   EBIT 177,206 212,727 252,827 296,299 347,443 424,012 522,038 645,504 709,562 *(1-Tax Rate) 122,272 146,782 174,451 204,446 239,736 292,568 360,206 445,398 489,598 Add: Depreciation & Amortization 4,699 9,233 12,193 15,826 22,093 29,160 37,892 48,719 Less: CAPEX 27,483 18,864 6,792 29,492 34,916 42,819 52,906 65,595 Less: Change in NOWC -6,484 -14,531 99,011 44,616 68,672 73,537 98,736 125,666   Free Cashflow 105,972 151,682 80,841 146,165 158,240 205,373 246,457 302,856 342,779 Terminal Value                 2,730,875 Total 105,972 151,682 80,841 146,165 158,240 205,373 246,457 302,856 3,073,654
SSD shipment 14% increase in 2009 SSD shipments expected to achieve a compound annual growth rate of 54% over the 2008-2013 forecast period (Source: IDC) STEC has 26% average annual revenue growth past 5 years Cut down costs: new manufacturing facility in Malaysia started production in 2008 Experienced Management. 47% shares owned by insiders. Founders: age 51 and 48 are still leading the company. Source: Gartner 2008 SSD Market Share By revenue in Mil
Buy recommendation (currently traded at 10.28) Strong balance sheet with no debt Improved gross margin and asset turnover ratio year over year  Focusing on SSD market and phasing out less profitable DRAM business  Increasing R&D investment level; Growing patent portfolio Terminal Growth: 3% Terminal ROIC: 60%  WACC: 15.6% DCF Model: Risks Past cash flow uncertainties cause concerns for ability of future cash generation  Slow industry adoption for SSD will slow down the growth of STEC Currently 5.35x EBITDA  Target price 8.51x EBITDA Industry Average 6.03x EBITDA Present Value @ FY2009 2,155,359 Add FY2009 Cash & Securities 145,658 Less: Total Debt 46,967 Less: Minorities 0 Equity Value 2,254,050 Total Outstanding Shares 50,284 Implied Value Per Share 45

STEC analysis

  • 1.
  • 2.
    STEC is aglobal provider of Solid State technologies and solutions tailored to meet the high-performance, high reliability needs of original equipment manufacturers (OEMs) Founded 1990; Headquarters in Santa Ana, CA and 11 worldwide subsidiaries Industry: TMT/Electronics/SSD (Solid State Drive) Market Cap: $527M
  • 3.
      RETURN ONCOMMON SHAREHOLDERS' EQUITY   2007 2008 2009   3.3% 2.2% 32.4%           2007 2008 2009 PROFIT MARGIN FOR ROCE 3.1% 1.7% 21.1% ASSET TURNOVER 0.9 1.1 1.3 CAPITAL STRUCTURE LEVERAGE 1.2 1.1 1.2 FY2007A FY2008A FY2009A FY2010E FY2011E FY2012E FY2013E FY2014E Revenue 188,652 227,445 354,183 421,309 498,802 611,696 755,799 937,069 Less: Operating Expenses 6,747 5,485 89,163 109,184 129,267 158,524 195,869 242,846 EBITDA 181,905 221,960 265,020 312,125 369,535 453,172 559,930 694,223 Less: Depreciation & Amortization 4,699 9,233 12,193 15,826 22,093 29,160 37,892 48,719   EBIT 177,206 212,727 252,827 296,299 347,443 424,012 522,038 645,504 709,562 *(1-Tax Rate) 122,272 146,782 174,451 204,446 239,736 292,568 360,206 445,398 489,598 Add: Depreciation & Amortization 4,699 9,233 12,193 15,826 22,093 29,160 37,892 48,719 Less: CAPEX 27,483 18,864 6,792 29,492 34,916 42,819 52,906 65,595 Less: Change in NOWC -6,484 -14,531 99,011 44,616 68,672 73,537 98,736 125,666   Free Cashflow 105,972 151,682 80,841 146,165 158,240 205,373 246,457 302,856 342,779 Terminal Value                 2,730,875 Total 105,972 151,682 80,841 146,165 158,240 205,373 246,457 302,856 3,073,654
  • 4.
    SSD shipment 14%increase in 2009 SSD shipments expected to achieve a compound annual growth rate of 54% over the 2008-2013 forecast period (Source: IDC) STEC has 26% average annual revenue growth past 5 years Cut down costs: new manufacturing facility in Malaysia started production in 2008 Experienced Management. 47% shares owned by insiders. Founders: age 51 and 48 are still leading the company. Source: Gartner 2008 SSD Market Share By revenue in Mil
  • 5.
    Buy recommendation (currentlytraded at 10.28) Strong balance sheet with no debt Improved gross margin and asset turnover ratio year over year Focusing on SSD market and phasing out less profitable DRAM business Increasing R&D investment level; Growing patent portfolio Terminal Growth: 3% Terminal ROIC: 60% WACC: 15.6% DCF Model: Risks Past cash flow uncertainties cause concerns for ability of future cash generation Slow industry adoption for SSD will slow down the growth of STEC Currently 5.35x EBITDA Target price 8.51x EBITDA Industry Average 6.03x EBITDA Present Value @ FY2009 2,155,359 Add FY2009 Cash & Securities 145,658 Less: Total Debt 46,967 Less: Minorities 0 Equity Value 2,254,050 Total Outstanding Shares 50,284 Implied Value Per Share 45

Editor's Notes

  • #2 02/26/11 07:45 © 2007 Microsoft Corporation. All rights reserved. Microsoft, Windows, Windows Vista and other product names are or may be registered trademarks and/or trademarks in the U.S. and/or other countries. The information herein is for informational purposes only and represents the current view of Microsoft Corporation as of the date of this presentation. Because Microsoft must respond to changing market conditions, it should not be interpreted to be a commitment on the part of Microsoft, and Microsoft cannot guarantee the accuracy of any information provided after the date of this presentation. MICROSOFT MAKES NO WARRANTIES, EXPRESS, IMPLIED OR STATUTORY, AS TO THE INFORMATION IN THIS PRESENTATION.
  • #3 02/26/11 07:45 © 2007 Microsoft Corporation. All rights reserved. Microsoft, Windows, Windows Vista and other product names are or may be registered trademarks and/or trademarks in the U.S. and/or other countries. The information herein is for informational purposes only and represents the current view of Microsoft Corporation as of the date of this presentation. Because Microsoft must respond to changing market conditions, it should not be interpreted to be a commitment on the part of Microsoft, and Microsoft cannot guarantee the accuracy of any information provided after the date of this presentation. MICROSOFT MAKES NO WARRANTIES, EXPRESS, IMPLIED OR STATUTORY, AS TO THE INFORMATION IN THIS PRESENTATION.
  • #4 02/26/11 07:45 © 2007 Microsoft Corporation. All rights reserved. Microsoft, Windows, Windows Vista and other product names are or may be registered trademarks and/or trademarks in the U.S. and/or other countries. The information herein is for informational purposes only and represents the current view of Microsoft Corporation as of the date of this presentation. Because Microsoft must respond to changing market conditions, it should not be interpreted to be a commitment on the part of Microsoft, and Microsoft cannot guarantee the accuracy of any information provided after the date of this presentation. MICROSOFT MAKES NO WARRANTIES, EXPRESS, IMPLIED OR STATUTORY, AS TO THE INFORMATION IN THIS PRESENTATION.
  • #5 02/26/11 07:45 © 2007 Microsoft Corporation. All rights reserved. Microsoft, Windows, Windows Vista and other product names are or may be registered trademarks and/or trademarks in the U.S. and/or other countries. The information herein is for informational purposes only and represents the current view of Microsoft Corporation as of the date of this presentation. Because Microsoft must respond to changing market conditions, it should not be interpreted to be a commitment on the part of Microsoft, and Microsoft cannot guarantee the accuracy of any information provided after the date of this presentation. MICROSOFT MAKES NO WARRANTIES, EXPRESS, IMPLIED OR STATUTORY, AS TO THE INFORMATION IN THIS PRESENTATION.
  • #6 02/26/11 07:45 © 2007 Microsoft Corporation. All rights reserved. Microsoft, Windows, Windows Vista and other product names are or may be registered trademarks and/or trademarks in the U.S. and/or other countries. The information herein is for informational purposes only and represents the current view of Microsoft Corporation as of the date of this presentation. Because Microsoft must respond to changing market conditions, it should not be interpreted to be a commitment on the part of Microsoft, and Microsoft cannot guarantee the accuracy of any information provided after the date of this presentation. MICROSOFT MAKES NO WARRANTIES, EXPRESS, IMPLIED OR STATUTORY, AS TO THE INFORMATION IN THIS PRESENTATION.