1. AN OVERVIEW OF SARDINES AND ANCHOVIES FISHERY ALONG
THE INDIAN COASTS
P.K. Mohanty, S. S. Khora, U. S. Panda, G.N. Mohapatra and Pravakar Mishra*
Department of Marine Sciences, Berhampur University, Berhampur 760 007, Orissa, INDIA
E.mail : pratap_mohanty@yahoo.com
*
ICMAM Project Directorate, NIOT Campus, Chennai-601 302, Tamilnadu, INDIA
1. Introduction
The pelagic fisheries resources of India are largely of multispecies multisector
fisheries. There are about 240 species contributing to the fishery. However, contribution
of Sardine and Anchovies are significant. During 2003, Oil Sardine, other sardine and
Anchovies respectively contributed 26%, 8% and 6% to the total pelagic fish landings.
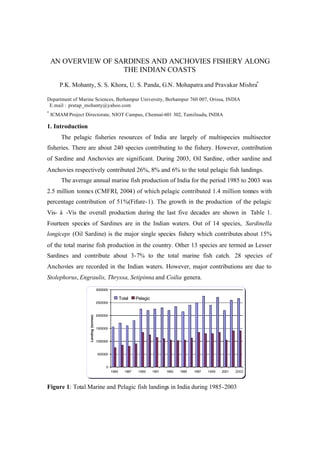
The average annual marine fish production of India for the period 1985 to 2003 was
2.5 million tonnes (CMFRI, 2004) of which pelagic contributed 1.4 million tonnes with
percentage contribution of 51%(Fifure-1). The growth in the production of the pelagic
Vis- à -Vis the overall production during the last five decades are shown in Table 1.
Fourteen species of Sardines are in the Indian waters. Out of 14 species, Sardinella
longiceps (Oil Sardine) is the major single species fishery which contributes about 15%
of the total marine fish production in the country. Other 13 species are termed as Lesser
Sardines and contribute about 3-7% to the total marine fish catch. 28 species of
Anchovies are recorded in the Indian waters. However, major contributions are due to
Stolephorus, Engraulis, Thryssa, Setipinna and Coilia genera.
3000000
Total Pelagic
2500000
2000000
Landing (tonnes)
1500000
1000000
500000
0
1985 1987 1989 1991 1993 1995 1997 1999 2001 2003
Figure 1: Total Marine and Pelagic fish landings in India during 1985-2003
2. Table 1: Decadal variation in the production and growth of pelagic and overall fish (1950
to 1999)
Period Production (ton) Relative growth (%)
Pelagics Overall Pelagics Overall
1950-59 362,548 618,501 - -
1960-69 527,211 814,721 +45 +31
1970-79 643,142 1,243,707 +22 +27
1980-89 819,093 1,579,836 +27 +27
1990-99 1,116,792 2258874 +36 +43
Figure 2: Indian map showing the east and west coast and the maritime states.
2. Production
Figure -2 depicts the coastal states along the Indian East and West coasts. Along
the east coast four states such as West Bengal, Orissa, Andhra Pradesh, Tamilnadu, and
2
3. one Union Territory, Pondicherry, contribute to the total marine fish production. While
on the west coast, the states contributing to the total marine fish production are Kerala,
Karnataka, Goa, Maharastra and Gujarat. Figure -3 presents the all India fish landings of
Oil Sardine, other Sardines and Anchovies during the period 1985-2003. It is clearly
evident that contribution of Oil Sardine, a single species, is maximum as compared to
other two groups. Productivity of Indian east coast differs from west coast and is evident
from Figure-4a and Figure 4b. Along the east coast, landings of the three groups are
maximum in Tamilnadu whereas it is maximum in Kerala along the west coast. This
suggests that south-eastern and south-western coasts of India are most productive zones.
Oil Sardine
450000 All India Landing(tonnes) Other Sardine
Anchovies
400000
350000
Landing(tonnes)
300000
250000
200000
150000
100000
50000
0
1985 1987 1989 1991 1993 1995 1997 1999 2001 2003
Figure 3: All India fish landings of Oil Sardine, other sardines and Anchovies during
1985-2003.
3
6. 3. Fishery-biology of Sardine s
Distribution
Oil Sardine (Sardinella longiceps ) (Figure 5a) is restricted to the narrow coastal belt of
about 15 km from the shore. Figure-5b gives the geographical distribution of Oil Sardine .
S. longiceps has limited geographical distribution and mostly inhabits coasts of India,
Andamans, Sri Lanka, North Borneo, Philippines and Seychelles. Oil sardine landing is
maximum during post monsoon season followed by monsoon and pre monsoon. Depth
wise exploitation of oil sardine further indicates that in the depth range between 11-20m
maximum percentages of oil sardine are caught (Table-2).
Table 2: Depth wise exploitation of oil sardine
Season ( % of oil sardine caught from different depth zone)
<10m 11-20m 21-30m
Pre monsoon 2.9 85.1 12
Monsoon 6.2 61.1 32.7
Post monsoon 15.7 78.1 6.2
Annual 12.1 76.9 11
Figure 5: (a) Sardinella longiceps Val. and its (b) Geographical distribution.
6
7. Age and Growth
Oil Sardine attains different lengths at the end of the 1st , 2nd, and 3rd year which
again varies with locations. Table-3 below gives the location-wise length-age relationship
for the west coast.
Table-3: Location-wise length-age relationship for the west coast (Antony Raja, 1972)
Location Length in (mm)
1st year 2nd year 3rd year
Kerala 125-130 165-175 180-190
West coast
Karnataka 133-140 160-165 185-190
Table-3 depicts the age- growth relationship. It is observed that Oil Sardine attains
maximum length within 1st year. Thereafter the growth is very slow and takes place at the
rate of 10-15 mm per year. Rarely, the fish lives up to three years. The normal life span is
2 ½ years. It has been observed that species grow to an average size of 128 mm, 166 mm
and 195 mm by the end of 1st , 2nd and 3rd year of life at monthly growth rate of 10.67
mm, 3.17 mm and 2.42 mm respectively.
Table-4: Growth rate of Sardine with age
Growth(mm) Age(Month)
60-65 1
95-110 2
110-125 3
125-140 6
150-160 12
170-180 24
Length-weight
Length-weight relationship is of primary importance on setting up yield equation,
in estimating the fish landings and in comparing population in space and time. Generally
weight of fish varies as the cube of length. In Sardines, body depth in relation to length
7
8. increases more rapidly in the 20-34 mm groups than in the larger size groups. Value of
regression coefficient obtained from the length-weight relationship for small fishes (20-
39 mm) are 3.6 and for larger fishes (77-124 mm) is 3.0 (Antony Raja, 1971).
Maximum recorded length for east coast is 204 mm (Luther, 1988). The length of
fishes again varies according to their catch in different years. Along the west coast the
maximum length reported is 210 mm (Nair, 1953).
Consumption
Oil Sardine feeds mostly on planktons. When surface conditions are unfavorable ,
sardines resort to bottom feeding. Phytoplankton forms the chief food of the juvenile and
adult forms. Diatom Fragilaria oceanica has been suggested as their fa vourable food.
The abundance of Oil Sardines during certain years may be related to the blooming of
this diatom. Preliminary observations on food and feeding habits of other sardine like S.
fimbriata (Bennet, 1967) suggest that larger size groups have empty stomach. Copepods
and other crustacean items are preferred food of the fish indicating plankton feeding
habit.
Spawning
Main spawning grounds are beyond the conventional fishing zone. Adults move
away from the near shore water for spawning. Spawning usua lly takes place at night.
Preferably spawning takes place a few nights before and after the new moon. Spawning
season begins by about June and continues till October. However, the peak of the
spawning period is August-September. During south-west monsoon, salinity and
temperature of the inshore water fall and these to a larger extent, act as favourable factors
for the entry of spawners in the coastal waters. As a result, spawning season shifts
slightly from year to year. Therefore, depending on the onset of the monsoon, spawning
takes place a little earlier along southern-west coast than in northern-west coast. There is
no shoaling or concentration of one sex in any month of the year, especially during
spawning season. It is very rare to obtain mature individuals during the spawning
seasons.
In case of other sardines, spawning grounds are not far off the coast. Each
individuals spawns only once during the season.
8
9. Table-5 Calculated values of weight (gm) and fecundity (thousands) of sardine for
different lengths (mm).
Fecundity(thousands) No. of ova
Length(mm) Weight(gm) per gram
Length basis Weight basis
body weight
150 31.3 27.1 28 894
160 37.8 31.9 32.4 857
170 45.3 37.1 37.6 830
180 53.6 42.8 43.3 808
190 63 49 49.7 789
200 73.3 57 56.8 775
Recruitment
The success of Oil Sardine fishery mainly depend s on recruitment strength of
early juveniles (50-100 mm) during post monsoon months. Along the south-western
coast, recruitment starts early from late August, whereas in the north-western coast the
recruitment starts late September. Multiple recruitments with the season are also
observed, particularly for lesser sardines. From October onwards recruitment of juveniles
intensifies and fishes of wide range of length are observed in the catches. Reproduction
and recruitment are found to be closely related to each other. Recruitment depends upon
the variability of mortality than on the fecundity.
Population Dynamics
(a) Fecundity
It is the egg lying capacity of the fish. Oil Sardine lays 70,000 to 75,000 eggs.
Fecundity is directly proportional to the weight of the ovary, which in turn is related to
the size of the fish. Therefore, older fish which attain larger size give higher values of
fecundity. The fecundity range for one year old is 21,000 – 48,000 and the average is
32300. For two years old it ranges from 26400-62300 with an average of 45000. For a
given length or weight the fecundity varies considerably even within the same season.
Antony Raja (1972b) studied the fecundity fluctuations in the Oil Sardine and
showed that its relationship with length is curvilinear and with weight it is rectilinear.
The regression coefficient of fecundity- length regression analysis ranges from 1.79 to
4.50 for a wide range of length of fishes. Covariance analysis between fecundity-weight
indicates that there is no significant difference among the slopes which ranges from 0.053
9
10. to 1.209. Thus it can be stated that the fecundity of Oil Sardine is slightly more closely
associated with width than with length. Table -5 explains the variation of fecundity with
respect to different length and weight. It is observed that for every additional 10 mm
increase in length the fecundity increases by 5-6 thousand. For other sardines like S.
fimbriata, the fecundity ranges from 5300 to 16300 for smaller fish (135-145 mm).
Larger fish (170-180 mm) however, give high values of fecundity (33700-41700).
(b) Maturity
Oil Sardine undergoes nine stages of maturity with distinct biological features in
each stage. The stages are Immature (I), Developing Virgin (IIa), Spent resting (IIb),
Maturing (III & IV), Mature (V), Running (VI), Partially spent (VIIa) and Spent (VIIb)
(Antony Raja, 1971). Size at first maturity is estimated as 158 mm.
Table 6: Stages of sexual maturity, corresponding periods and lengths at maturity
Stage Period Length (mm)
I Sept - March 127 - 149
II a April - May 131 - 161
II b Sept - April 152 - 188
III May - June 144 - 185
IV June - July 124 – 189
V July - Sept 142 – 202
VI July - Oct. 167 – 190
VII a July - Sept 147 – 183
VII b Aug - Nov 159 – 189
Maturity and age relationship for both east and west coast indicate that both Oil
Sardine and other sardine s mature at the age of 1 year. Indeterminate fish seems to feed
more actively than fish in other stages of maturity (Table -7).
Table 7: Feeding Intensity and Maturity.
Maturity Percentage of fish in different feeding intensity
Good Moderate Poor
Indeterminates 33 0 67
Immature 11 15 74
Maturing 12 17 71
Ripe 5 12 83
Spent fis h 6 8 86
10
11. (c) Mortality
The instantaneous natural mortality rate, fishing mortality, natural mortality and
catchability rates for Oil Sardine in the Indian waters are respectively 2.43, 0.98, 1.45 and
0.0023. Average mortality rate is 0.52. The average instantaneous rate of mortality for
west coast is 2.99. However it was low (1.3-1.66) when traditional gear was in operation.
The mortality rates however show wide fluctuation from year to year and it could be due
to short to annual changes in the available stocks.
3. Fishery -biology of Anchovies
Andhra Pradesh and Tamilnadu along east coast and Kerala along west coast are
the three coastal states of India which support 95% of the average annual catch of
anchovies in the country. The contribution of genus Stolephorus is maximum.
There are two fishing seasons; January to May and September to November. The
peak per iod of anchovy catch is however during September-November. Anchovy fishery
shifts from south to north with progress in time. The fishery for anchovies is based
mainly on ‘O’ year class fish.
The total length range varies form 25-100 mm. Juveniles are having length 30-34
mm and adults having 65-89 mm length along the west coast. Length range of 57-132
mm is observed in the Andaman Sea. Anchovies are fished upto a distance of 5 km from
the shore and to a maximum depth of 30 meters.
Anchovies mostly feed on zooplankton. Copepods constitute a fairly good portion
of the diet throughout the year and its percentage composition varies between 3.1-65.1%.
The mean percentage composition of some important food items reveals that Euphausids
(26.4-44%), Pontella spp. (10.4-17.3%), Megalopa spp. (9.1-13.4%), Pseudodiaptomus
spp. (6.1-11.4%) and Ladiocera spp. (2.1-6.4%) are most prevalent in the diet. Feeding
habits of juveniles are markedly different from adults. Juveniles mostly feed on copepods
whereas adults feed on bigger organisms. Seasonal variation in the intensity of feeding is
observed and is due to variation in availability of the organisms in a particular
environment. Variation in food and feeding habits among the different species of same
family is not uncommon.
11
12. Mature fish are seen throughout the year. A large number of mature females with
advanced stage of ovary are noticed during a restricted period of July-August and again
in December-January. Thus, spawning takes place during these two periods.
Recruitment of anchovies takes place during November-June/July at 32-47 length.
The range of fecundity in mature fishes with size ranges 110-112 mm is 1171-3356 with
a mean of 2068. With larger size range (130-205 mm) and with weight of 14-64g, the
fecundity ranges from 3580 to 24180 with a mean of 10360. Eggs in anchovies are shed
in batches. In many fishes the fecundity increases as thrice the length.
More males than females are observed among the smaller sizes measuring 99 mm.
For sizes >100 mm the percentage of females dominate males. Females are abundant
(82.5-100%) from the size group 115-119 mm onwards. This feature is due to migration
of fish towards inshore waters after attaining sexual maturity. 50.0% of the fish are found
mature at 140-150 mm length. Length recorded at 1st maturity is 117 mm. Growth rates
of anchovy in left lobes of the testes and ovaries are faster than in the right lobes of the
testes and ovaries. Different species however mature at different sizes.
Acknowledgement
One of the authors (PKM) wishes to thank the Asia Pacific Network for Global
Change Research (APN) for extending the kind support to attain the workshop in Tokyo,
Japan
References
1. Antony Raja, B.T 1971. Length-Weight relationship in the Oil Sardine, Sardinella
longiceps Val., Indian J. Fish., 14: 159-170.
2. Antony Raja, B.T 1972 b. Estimation of age and growth of the Indian Oil Sardine,
Sardinella longiceps Val., Indian J. Fish., 18: 84-98.
3. Antony Raja, B.T 1972 c. Fecundity fluctuations with the Indian Oil Sardine.,
Sardinella longiceps Valenciennes. Indian J. Fish., 18: 84-98.
4. Bennet, P. SAM 1967. Some observations on the fishery and biology of
Sardinella fimbriata (Val.), at Vizhingam. Indian J. Fjsh, 14(1&2): 145-158.
5. CMFRI, 2004. Estimated Marine fish landings in India. Mar. Fish. Infor. Serv.,
T&E Ser., No.179.
6. Luther, G. 1988. Oil Sardine, An eme rging new fishery resource along the east
coast, Mar. Fish. Info. Serv. T & E. Ser; 88: 13-19.
7. Nair, R.V. 1953. Studies on the revival of the Indian Oil Sardine fishery.
Prof.Indo-Pacif. Fish. Coun., 4th meeting: 115-129
12