SlideShare a Scribd company logo
1 of 5
Download to read offline
Energy & Commodities
Monthly newsletter from Swedbank’s Economic Research Department
by Jörgen Kennemar                                                                                                      No. 3 • 14 March 2011


         Commodity prices reach new heights with risk of price fall
       • The global economy is being put to the test as commodity prices rise broadly.
         In February Swedbank’s Total Commodity Price Index rose for the eighth
         consecutive month. Compared with February of 2010, the index has climbed
         by 35.8% in USD, with food commodities accounting for the biggest increase.
         Excluding energy, the index has risen to a higher level than in 2008, when
         commodity prices reached record levels.
       • Expectations of a continued strong economic recovery and shrinking
         inventories have driven metal prices broadly higher despite high oil prices.
         There is a risk they could fall, however, if oil remains at today's high level or
         rises further.
       • The impact of the disastrous earthquake in Japan is difficult to assess, but in
         the short term it could lead to lower copper and aluminium prices if the
         Japanese auto and electronics industries are forced to significantly reduce
         production. While Japan has succeeded over the years in reducing its oil
         dependency, it is still the third largest importer in the world. To meet its
         energy needs after shutting down several nuclear power plants, Japan may
         have to substantially increase its oil imports, which would raise prices. In the
         long term commodity prices could face further pressure once reconstruction
         begins.
                                   Swedbank’s Total Commodity Price Index in USD, 2005=100

                        250
                                                                          Total index                  Food
                        225
                                                                                Total excl energy commodities
                        200

                        175
                Index


                        150

                        125

                        100                                                                       Metals


                        75
                              05          06            07           08                 09                 10              11
                                                                                                                Source: Swedbank


                   Economic Research Department. Swedbank AB. SE-105 34 Stockholm. Phone +46-8-5859 1000.
                                        E-mail: ek.sekr@swedbank.se www.swedbank.se
                              Legally responsible publisher: Cecilia Hermansson. +46-8-5859 7720.
                             Magnus Alvesson. +46-8-5859 3341. Jörgen Kennemar. +46-8-5859 7730.
Energy & Commodities
Monthly newsletter from Swedbank’s Economic Research Department
by Jörgen Kennemar                                                                                No. 3 • 14 March 2011


Swedbank’s Total Commodity Price Index rose                       also risen substantially, but are still below the
by an average of 4.4% in USD in February                          previous peak two and a half years ago. Other
compared with the previous month. It was the                      agricultural products such as cotton have also
eighth consecutive monthly increase, with the                     reached record highs this year, which is raising
index reaching its highest level since                            commodity costs for the textile industry.
September 2008. In euro, the price increase
was slightly lower, at 2.2%. The krona’s                          The substantial price rise is being driven by
appreciation against the dollar means that                        lower supplies of foods and other agricultural
commodity prices gained a more modest 0.6%                        commodities due to poor harvests, though also
in SEK between January and February.                              because of growing demand around the world.
Excluding energy, the index is higher than two                    This has led to declining inventory levels.
and a half years ago. That supply restrictions                    Demand is also affected by efforts by several
are becoming more common is a sign of                             countries to build up their inventories to slow
insufficient production capacity as the                           domestic inflation pressures and reduce the
economy improves. The global financial crisis                     risk of social tensions. This is cutting into
may have delayed new investments in                               supplies on the global market, causing prices
commodity industries. Low interest rates and                      to rise. High oil prices also tend to raise food
unconventional measures taken by central                          prices, since oil is an important input good in
banks, like buying government debt to                             agricultural production. We think food prices
stimulate the economy, have created greater                       could rise even more in the months ahead due
liquidity in financial markets and may have                       to higher oil prices and shrinking inventories.
added fuel to the commodity price rise in the                     Not until the second half of 2011 is it likely that
last year. To ensure access to commodities                        prices could fall from today's high levels,
and reduce price volatility, investments will be                  provided that production rises sharply and
needed to expand future production capacity. It                   inventories recover. Experience from the food
is also important that commodities are                            crisis in 2008 shows that high prices often lead
consumed more efficiently, especially by                          to higher production. At the same time
emerging economies, which account for a                           available acreage for food production is
growing share of consumption. The current                         increasing. Further production disruptions such
National People's Congress in Beijing is                          as bad weather, high oil prices and export
planning several measures to reduce                               embargoes in several large net exporters
commodity consumption and raise efficiency.                       increase the risk that food prices could
While this may eventually reduce China's                          continue higher.
vulnerability, in the short term it will not
alleviate the problem that supply is rising more                  Oil price shock threatens the global
slowly than demand.                                               economy
                                                                  The global economic rebound and cold winter
Food prices noted the largest price increase in
                                                                  pushed oil prices above USD 100 a barrel
Swedbank’s Commodity Price Index in
                                                                  even before the political turbulence in North
February, and since the start of the year have
                                                                  Africa began in late January. Global
risen by nearly 11% on average in USD, more
                                                                  consumption rose by 3.3% in 2010 to 87.8
than crude and metals. After increasing by just
                                                                  billion barrels a day, or 1.7 billion barrels more
over 50% since last summer, Swedbank’s
                                                                  than the last peak in 2008. Most of the
Price Index for food commodities is higher than
                                                                  increase is coming from outside the OECD, led
during the food crisis in 2008. This applies to
                                                                  by Asia excluding Japan. This trend has
coffee, sugar, beverages and several grains
                                                                  strengthened in recent years as OECD
such as barley and corn. Wheat prices have
                                                                  countries have reduced their consumption. The


                 Economic Research Department. Swedbank AB. SE-105 34 Stockholm. Phone +46-8-5859 1000.
                                      E-mail: ek.sekr@swedbank.se www.swedbank.se
                            Legally responsible publisher: Cecilia Hermansson. +46-8-5859 7720.
                           Magnus Alvesson. +46-8-5859 3341. Jörgen Kennemar. +46-8-5859 7730.
Energy & Commodities
                                                                Monthly newsletter from Swedbank’s Economic Research Department, continued

                                                                                                    No. 3 • 14 March 2011


growing dependency on oil in emerging                                                                                            days. Uncertainty about future oil supplies is
economies will continue in the years ahead as                                                                                    growing at a time when the global economy is
buying power rises and a larger middle class                                                                                     getting stronger. The International Energy
takes shape.                                                                                                                     Agency (IEA) is predicting that global oil
                                                                                                                                 consumption will increase by 1.5 million barrels
Oil production climbed by 2.5% in 2010 to 83.7                                                                                   a day in 2011, which corresponds to Libya's
billion barrels a day, with OPEC generating                                                                                      previous oil production volume. Oil futures
nearly half the increase, while production                                                                                       suggest that high prices will persist in 2011,
volume in OECD countries as a whole was                                                                                          with a price of around USD 115 dollar a barrel
unchanged. Although demand grew faster than                                                                                      for delivery in December, before falling to USD
supply, supplies remain good, as indicated by                                                                                    110 for delivery in late 2012. The price picture
the OECD’s inventories, which are above their                                                                                    could change quickly if the political situation
historical average for the period 2005-2009. It                                                                                  stabilises, which could drop prices to USD 100,
is noteworthy, however, that price of Northern                                                                                   which we think is more reasonable considering
European oil (Brent crude) is significantly                                                                                      fundamentals in the oil market. Uncertainty is
higher (USD 15 more at the time of writing)                                                                                      great, however, so we cannot rule out
than North American (WTI crude), which is                                                                                        significantly higher oil prices if political
priced in the US market. In addition to quality                                                                                  concerns in the region continue.
differences – WTI contains less sulphur than
Northern European oil – the big price                                                                                            Although the global economy is less
difference is due to major regional imbalances,                                                                                  dependent on oil than during previous oil price
with a lower supply of Brent crude in Europe                                                                                     shocks, a substantial rise in prices will
and a growing surplus of WTI in the US.                                                                                          adversely affect growth. The rule of thumb is
                                                                                                                                 that if the price of oil rises by 10%, global
                                     Crude oil consumption, millions barrels/day                                                 growth will slow by 0.2% in the first year and
                        50.0
                                                                                                                                 0.4% in the second. Our assumption of a year-
                        47.5                                                                                                     on-year increase of 25% in oil prices in 2011
                        45.0
                                                                                                                                 means growth could slow even more, i.e.,
                        42.5
Barrel/Day (millions)


                        40.0                                                                                                     upwards of one percentage point over a two-
                        37.5                                                                                                     year period, which would also affect
                        35.0

                        32.5
                                                                                                                                 commodity demand. It is important, however,
                        30.0                                                                                                     to qualify how higher oil prices affect global
                        27.5                                                                                                     economy – whether through increased demand
                        25.0
                               95   96   97   98   99      00    01   02   03   04   05   06   07   08     09       10           or supply shortages, the latter of which would
                                OECD      Total Non-OECD
                                                                                                     Source: Reuters EcoWin
                                                                                                                                 probably have a greater negative impact.

When the political conflict in the Middle East                                                                                                                   Oil futures for Brent crude
spread to Libya in February, it caused growing                                                                                   120
concerns about future oil supplies from OPEC,
                                                                                                                                 110
which accounts for one third of global
production, and oil prices rose to slightly over                                                                                 100


USD 115 a barrel from USD 103 in early                                                                                            90

February. Despite the Libyan oil production                                                                                       80
represents only 2% of the global total, the
                                                                                                                                  70
problem is uncertainty whether political
developments in the region could jeopardize                                                                                       60
                                                                                                                                       jan   feb     mar   apr     maj     jun        jul   aug     sep     okt     nov    dec   jan     feb mar

supplies from major producers such as Saudi                                                                                             Spot price
                                                                                                                                                                                 10
                                                                                                                                                       Brent Crude Futures Dec 2011         Brent Crude Futures Dec 2012
                                                                                                                                                                                                                                        11
                                                                                                                                                                                                                                  Source: Reuters EcoWin

Arabia, Iran and Iraq, which supply 40% of
OPEC’s total production. Available production                                                                                    Tighter supply of metals
capacity in OPEC countries of 4-6 million
                                                                                                                                 The price trend for metals is continuing, and in
barrels a day can keep prices in check. Part of
                                                                                                                                 February prices rose by 4.2% in USD from the
this capacity is replacing Libya's production,
which has dropped substantially in recent                                                                                        previous month. Nickel accounted for the


                                                                                                                         3 (6)
Energy & Commodities
                                                          Monthly newsletter from Swedbank’s Economic Research Department, continued

                                                                                                   No. 3 • 14 March 2011


largest increase (10.3%), followed by zinc                                                                                                   medium-term goal of authorities there. In total,
(32%) and copper (3.2%). Lead fell the most in                                                                                               steel production is expected to rise by 5% this
price in the last month. Supply conditions for                                                                                               year.
many metals have tightened as demand
outpaces production. This is especially true of                                                                                              The powerful earthquake in Japan could have
copper, tin and iron ore, where prices are at                                                                                                an impact on global metal prices, even though
record highs and inventories are expected to                                                                                                 the affected region accounts for only about 2%
reach critically low levels in 2011, even if                                                                                                 of the country's GDP. The Japanese auto and
actual inventory data do not show it yet. The                                                                                                electronics industries will face serious
increase in copper inventories since December                                                                                                production and delivery disruptions, which
has not prevented prices from rising.                                                                                                        should reduce aluminium and copper
Expectations of further economic expansion in                                                                                                consumption. Another uncertainty affecting
Asia, capacities shortages and lower ore                                                                                                     Japanese industry is the risk of an energy
quality in existing mines are also contributing                                                                                              shortage after several nuclear power
to rising prices. International experts predict an                                                                                           generators have been shut down following the
increase in copper consumption of around                                                                                                     explosion in Fukushima and for safety reasons.
4.5% in 2011, while production is expected to                                                                                                Since the oil crisis in the 1970s, when oil
gain just over 1%. Aluminium, nickel and zinc                                                                                                supplied two thirds of the country's electricity
inventories are not as constrained, so price                                                                                                 production, a large share has been replaced by
increases for these metals are expected to be                                                                                                nuclear power. The earthquake and damage to
lower. The chances of further increases in                                                                                                   buildings and infrastructure could also limit the
metal prices will decline if oil prices remain                                                                                               supply of steel on the global market if a larger
high.                                                                                                                                        share of the 100 million tons Japan produces
                                                                                                                                             were used domestically instead of exported.
                                      Inventory levels for metals, millions of tons
                                                                                                                                                                           Jörgen Kennemar
                          1.0                                                                                     225000

                          0.9                                                                                     200000
                                                                                Nickel, right scal
                          0.8                                                                                     175000

                          0.7                                                                                     150000
Ton (metric) (millions)


                          0.6                                                 Copper                              125000
                                                                                                                              Ton (metric)


                          0.5                                     Zink                                            100000

                          0.4                                                                                      75000

                          0.3                                                                                      50000

                          0.2                                                                                      25000

                          0.1                                                                                             0
                                                                                            Lead
                          0.0                                                                                     -25000
                                00   01   02   03    04     05   06      07    08      09          10      11
                                                                                                   Source: LME, Reuters EcoWin


 Global steel production increased by as much
as 15% in 2010, with China accounting for
44%, followed by Japan at 8%. Production
volume of over 1.4 billion tons last year was a
record high, which is driving iron ore prices
higher. At the same time the supply of iron ore
in the global market has been hurt by lower
exports from India (the world's third largest
exporter after Australia and Brazil), due to
rising    domestic     demand       and    export
restrictions. Spot prices of iron ore, which now
serve as a guide for quarterly prices,
consistently point higher in the next quarter.
Estimates of a further increase in Chinese
steel production would indicate high iron ore
prices, despite that China’s expansion is
expected to slow slightly in 2011, which is the


                                                                                                                           4 (6)
Energy & Commodities
Monthly newsletter from Swedbank’s Economic Research Department
by Jörgen Kennemar                                                                                                                         No. 3 • 14 March 2011


Swedbank Commodity Index                                             - US$ -        Swedbank Commodity Index                                             - SKr -
Basis 2000 = 1oo                                                       14/03/11     Basis 2000 = 1oo                                                      14/03/11
                                             12.2010       1.2011       2.2011                                                   12.2010       1.2011       2.2011
Total index                                    314.2        327.1        341.3      Total index                                    233.6        237.1        238.6
                 Per cent change month ago       5.8          4.1          4.4                       Per cent change month ago       6.1          1.5          0.6
                 Per cent change year ago       25.0         25.5         35.8                       Per cent change year ago       19.7         17.2         20.3
Total index exclusive energy                   292.7        308.7        318.9      Total index exclusive energy                   217.6        223.8        222.9
                 Per cent change month ago       3.1          5.5          3.3                       Per cent change month ago       3.4          2.8         -0.4
                 Per cent change year ago       33.2         37.5         47.6                       Per cent change year ago       27.6         28.4         30.7
    Food, tropical beverages                   286.2        302.5        317.6          Food, tropical beverages                   212.8        219.3        222.0
                 Per cent change month ago       6.0          5.7          5.0                       Per cent change month ago       6.3          3.1          1.2
                 Per cent change year ago       26.1         32.2         45.6                       Per cent change year ago       20.8         23.5         29.0
        Cereals                                278.9        294.7        314.5              Cereals                                207.4        213.7        219.8
                 Per cent change month ago       8.5          5.7          6.7                       Per cent change month ago       8.8          3.0          2.9
                 Per cent change year ago       36.2         49.4         67.6                       Per cent change year ago       30.5         39.5         48.4
        Tropical beverages and tobacco         301.5        317.0        337.8              Tropical beverages and tobacco         224.2        229.8        236.1
                 Per cent change month ago       5.7          5.1          6.6                       Per cent change month ago       6.0          2.5          2.7
                 Per cent change year ago       22.5         24.0         38.8                       Per cent change year ago       17.4         15.8         23.0
            Coffee                             183.8        196.8        215.2                  Coffee                             136.7        142.7        150.4
                 Per cent change month ago       5.7          7.1          9.3                       Per cent change month ago       6.0          4.4          5.4
                 Per cent change year ago       47.0         55.1         74.4                       Per cent change year ago       40.9         44.9         54.5
        Oilseeds and oil                       258.0        276.4        276.1              Oilseeds and oil                       191.8        200.4        193.0
                 Per cent change month ago       4.8          7.1         -0.1                       Per cent change month ago       5.1          4.5         -3.7
                 Per cent change year ago       28.7         44.4         50.2                       Per cent change year ago       23.3         34.9         33.0
    Industrial raw materials                   294.6        310.5        319.3          Industrial raw materials                   219.0        225.1        223.2
                 Per cent change month ago       2.3          5.4          2.8                       Per cent change month ago       2.6          2.8         -0.9
                 Per cent change year ago       35.4         39.0         48.2                       Per cent change year ago       29.7         29.9         31.2
        Agricultural raw materials             193.2        200.8        207.0              Agricultural raw materials             143.6        145.6        144.7
                 Per cent change month ago       1.3          3.9          3.1                       Per cent change month ago       1.6          1.4         -0.6
                 Per cent change year ago       23.1         26.5         31.3                       Per cent change year ago       18.0         18.2         16.3
            Cotton                             140.8        151.6        185.8                  Cotton                             104.7        109.9        129.9
                 Per cent change month ago       6.7          7.7         22.6                       Per cent change month ago       7.0          5.0         18.1
                 Per cent change year ago       88.5        110.8        149.4                       Per cent change year ago       80.6         97.0        120.9
            Softwood                           144.6        144.2        144.6                  Softwood                           107.5        104.5        101.1
                 Per cent change month ago      -3.1         -0.3          0.3                       Per cent change month ago      -2.9         -2.8         -3.3
                 Per cent change year ago        3.4          4.0          6.0                       Per cent change year ago       -0.9         -2.8         -6.1
            Woodpulp                           949.8        949.0        949.1                  Woodpulp                           706.2        688.0        663.3
                 Per cent change month ago      -0.7         -0.1          0.0                       Per cent change month ago      -0.5         -2.6         -3.6
                 Per cent change year ago       19.3         16.5         13.0                       Per cent change year ago       14.3          8.9          0.0
        Non-ferrous metals                     275.6        288.3        300.3              Non-ferrous metals                     204.9        209.0        209.9
                 Per cent change month ago       4.4          4.6          4.2                       Per cent change month ago       4.7          2.0          0.4
                 Per cent change year ago       22.2         21.6         36.7                       Per cent change year ago       17.0         13.6         21.1
            Copper                            9130.1       9563.7       9867.2                  Copper                            6788.0       6933.7       6896.3
                 Per cent change month ago       7.8          4.7          3.2                       Per cent change month ago       8.1          2.1         -0.5
                 Per cent change year ago       31.1         29.5         44.4                       Per cent change year ago       25.6         21.0         27.9
            Aluminium                         2347.4       2440.2       2507.8                  Aluminium                         1745.2       1769.1       1752.7
                 Per cent change month ago       0.6          4.0          2.8                       Per cent change month ago       0.9          1.4         -0.9
                 Per cent change year ago        7.8          9.1         22.7                       Per cent change year ago        3.2          1.9          8.7
            Lead                              2404.9       2600.2       2586.2                  Lead                              1788.0       1885.1       1807.5
                 Per cent change month ago       1.2          8.1         -0.5                       Per cent change month ago       1.5          5.4         -4.1
                 Per cent change year ago        3.5          9.8         21.3                       Per cent change year ago       -0.9          2.6          7.5
            Zinc                              2272.7       2373.9       2464.7                  Zinc                              1689.7       1721.1       1722.6
                 Per cent change month ago      -0.8          4.5          3.8                       Per cent change month ago      -0.5          1.9          0.1
                 Per cent change year ago       -3.9         -2.5         14.4                       Per cent change year ago       -8.0         -8.9          1.3
            Nickel                           24055.5      25609.4      28250.1                  Nickel                           17884.7      18566.8      19744.4
                 Per cent change month ago       5.0          6.5         10.3                       Per cent change month ago       5.3          3.8          6.3
                 Per cent change year ago       41.6         38.9         49.7                       Per cent change year ago       35.6         29.8         32.6
        Iron ore, steel scrap                  607.0        653.3        660.0              Iron ore, steel scrap                  451.3        473.6        461.3
                 Per cent change month ago       0.7          7.6          1.0                       Per cent change month ago       1.0          5.0         -2.6
                 Per cent change year ago       73.4         86.6         87.8                       Per cent change year ago       66.1         74.3         66.3
    Energy raw materials                       323.8        335.2        351.3          Energy raw materials                       240.7        243.0        245.5
                 Per cent change month ago       6.8          3.5          4.8                       Per cent change month ago       7.2          1.0          1.0
                 Per cent change year ago       21.9         21.2         31.6                       Per cent change year ago       16.8         13.2         16.6
        Coking coal                            454.7        490.5        479.3              Coking coal                            338.1        355.6        335.0
                 Per cent change month ago      11.8          7.9         -2.3                       Per cent change month ago      12.1          5.2         -5.8
                 Per cent change year ago       48.5         34.2         37.8                       Per cent change year ago       42.3         25.4         22.0
        Crude oil                              317.8        328.1        345.4              Crude oil                              236.3        237.9        241.4
                 Per cent change month ago       6.5          3.2          5.3                       Per cent change month ago       6.8          0.7          1.5
                 Per cent change year ago       20.5         20.4         31.2                       Per cent change year ago       15.5         12.5         16.2

Source : SWEDBANK and HWWA-Institute for Economic Research Hamburg                  Source : SWEDBANK and HWWA-Institute for Economic Research Hamburg


Swedbank
Economic Research Department                              Swedbank’s monthly Energy & Commodities newsletter is published as a service to our
                                                          customers. We believe that we have used reliable sources and methods in the preparation
SE-105 34 Stockholm, Sweden                               of the analyses reported in this publication. However, we cannot guarantee the accuracy or
Phone +46-8-5859 7740                                     completeness of the report and cannot be held responsible for any error or omission in the
ek.sekr@swedbank.se                                       underlying material or its use. Readers are encouraged to base any (investment) decisions
www.swedbank.se                                           on other material as well. Neither Swedbank nor its employees may be held responsible for
Legally responsible publisher                             losses or damages, direct or indirect, owing to any errors or omissions in Swedbank’s
Cecilia Hermansson, +46-88-5859 7720                      monthly Energy & Commodities newsletter.
Magnus Alvesson, +46-8-5859 3341
Jörgen Kennemar, +46-8-5859 7730


                             Economic Research Department. Swedbank AB. SE-105 34 Stockholm. Phone +46-8-5859 1000.
                                                  E-mail: ek.sekr@swedbank.se www.swedbank.se
                                        Legally responsible publisher: Cecilia Hermansson. +46-8-5859 7720.
                                       Magnus Alvesson. +46-8-5859 3341. Jörgen Kennemar. +46-8-5859 7730.

More Related Content

What's hot

Flash Comment: Lithuania - March 8, 2012
Flash Comment: Lithuania - March 8, 2012Flash Comment: Lithuania - March 8, 2012
Flash Comment: Lithuania - March 8, 2012
Swedbank
 

What's hot (20)

Energy & Commodities, No.8 - October 25, 2011
Energy & Commodities, No.8 - October 25, 2011 Energy & Commodities, No.8 - October 25, 2011
Energy & Commodities, No.8 - October 25, 2011
 
Energy & Commodities, No. 4 - April 11, 2012
Energy & Commodities, No. 4 - April 11, 2012Energy & Commodities, No. 4 - April 11, 2012
Energy & Commodities, No. 4 - April 11, 2012
 
Energy & Commodities, No. 3 - March 19, 2012
Energy & Commodities, No. 3 - March 19, 2012Energy & Commodities, No. 3 - March 19, 2012
Energy & Commodities, No. 3 - March 19, 2012
 
Energy & Commodities, No. 6 - June 8, 2012
Energy & Commodities, No. 6 - June 8, 2012Energy & Commodities, No. 6 - June 8, 2012
Energy & Commodities, No. 6 - June 8, 2012
 
Energy & Commodities, No. 10 - December 14, 2011
Energy & Commodities, No. 10 - December 14, 2011 Energy & Commodities, No. 10 - December 14, 2011
Energy & Commodities, No. 10 - December 14, 2011
 
Flash Comment: Lithuania - March 8, 2012
Flash Comment: Lithuania - March 8, 2012Flash Comment: Lithuania - March 8, 2012
Flash Comment: Lithuania - March 8, 2012
 
Energy & Commodities, No.7 - August 19, 2011
Energy & Commodities, No.7 - August 19, 2011 Energy & Commodities, No.7 - August 19, 2011
Energy & Commodities, No.7 - August 19, 2011
 
Flash Comment - July 11, 2011
Flash Comment - July 11, 2011Flash Comment - July 11, 2011
Flash Comment - July 11, 2011
 
Flash Comment: Latvia - February 8, 2012
Flash Comment: Latvia - February 8, 2012Flash Comment: Latvia - February 8, 2012
Flash Comment: Latvia - February 8, 2012
 
Macroeconomic risks and their mitigation : Preserving the Bangladesh growth s...
Macroeconomic risks and their mitigation : Preserving the Bangladesh growth s...Macroeconomic risks and their mitigation : Preserving the Bangladesh growth s...
Macroeconomic risks and their mitigation : Preserving the Bangladesh growth s...
 
Market Month: July 2018
Market Month: July 2018Market Month: July 2018
Market Month: July 2018
 
Energy & Commodities - 2010, July/August
Energy & Commodities - 2010, July/AugustEnergy & Commodities - 2010, July/August
Energy & Commodities - 2010, July/August
 
Flash Comment: Lithuania - October 10, 2011
Flash Comment: Lithuania - October 10, 2011Flash Comment: Lithuania - October 10, 2011
Flash Comment: Lithuania - October 10, 2011
 
Flash comment: Lithuania - May 9, 2012
Flash comment: Lithuania - May 9, 2012Flash comment: Lithuania - May 9, 2012
Flash comment: Lithuania - May 9, 2012
 
Flash comment: Estonia - April 9, 2012
Flash comment: Estonia - April 9, 2012Flash comment: Estonia - April 9, 2012
Flash comment: Estonia - April 9, 2012
 
Energy & Commodities - 2010 - October
Energy & Commodities - 2010 - October Energy & Commodities - 2010 - October
Energy & Commodities - 2010 - October
 
Flash Comment: Lithuania - February 14, 2012
Flash Comment: Lithuania - February 14, 2012Flash Comment: Lithuania - February 14, 2012
Flash Comment: Lithuania - February 14, 2012
 
Energy & Commodities - 2010 - August/September
Energy & Commodities - 2010 - August/SeptemberEnergy & Commodities - 2010 - August/September
Energy & Commodities - 2010 - August/September
 
Flash Comment: Latvia - November 8, 2011
Flash Comment: Latvia - November 8, 2011Flash Comment: Latvia - November 8, 2011
Flash Comment: Latvia - November 8, 2011
 
Flash comment: Latvia - August 8, 2012
Flash comment: Latvia  - August 8, 2012Flash comment: Latvia  - August 8, 2012
Flash comment: Latvia - August 8, 2012
 

Viewers also liked

Correlation of U.S. Gas Prices and National Oil Consumption
Correlation of U.S. Gas Prices and National Oil ConsumptionCorrelation of U.S. Gas Prices and National Oil Consumption
Correlation of U.S. Gas Prices and National Oil Consumption
bfalk1990
 

Viewers also liked (7)

Biologia membrana plasmatica
Biologia membrana plasmaticaBiologia membrana plasmatica
Biologia membrana plasmatica
 
Correlation of U.S. Gas Prices and National Oil Consumption
Correlation of U.S. Gas Prices and National Oil ConsumptionCorrelation of U.S. Gas Prices and National Oil Consumption
Correlation of U.S. Gas Prices and National Oil Consumption
 
Cross countries analysis
Cross countries analysisCross countries analysis
Cross countries analysis
 
Effects of Spikes in the Price of Gasoline on Behavioral Intentions: A Mental...
Effects of Spikes in the Price of Gasoline on Behavioral Intentions: A Mental...Effects of Spikes in the Price of Gasoline on Behavioral Intentions: A Mental...
Effects of Spikes in the Price of Gasoline on Behavioral Intentions: A Mental...
 
Symposium of Dietary Intakes - Malaysia - April 2016
Symposium of Dietary Intakes - Malaysia - April 2016Symposium of Dietary Intakes - Malaysia - April 2016
Symposium of Dietary Intakes - Malaysia - April 2016
 
Cislink tender eng
Cislink tender engCislink tender eng
Cislink tender eng
 
INDONESIA Nutrition & Labelling Claims_2015
INDONESIA Nutrition & Labelling Claims_2015INDONESIA Nutrition & Labelling Claims_2015
INDONESIA Nutrition & Labelling Claims_2015
 

Similar to Energy & Commodities, No.3, 14 March 2011

Nevada's Economy - March 2012
Nevada's Economy - March 2012Nevada's Economy - March 2012
Nevada's Economy - March 2012
Katie Madanat
 

Similar to Energy & Commodities, No.3, 14 March 2011 (19)

Flash Comment: Latvia - September 8, 2011
Flash Comment: Latvia - September 8, 2011Flash Comment: Latvia - September 8, 2011
Flash Comment: Latvia - September 8, 2011
 
Flash comment: Estonia - September 7, 2011
Flash comment: Estonia - September 7, 2011Flash comment: Estonia - September 7, 2011
Flash comment: Estonia - September 7, 2011
 
General presentation.pptx
General presentation.pptxGeneral presentation.pptx
General presentation.pptx
 
Energy & Commodities, 2010, regarding April
Energy & Commodities, 2010, regarding AprilEnergy & Commodities, 2010, regarding April
Energy & Commodities, 2010, regarding April
 
Preparing for the AS Economics Macro Paper 2012
Preparing for the AS Economics Macro Paper 2012Preparing for the AS Economics Macro Paper 2012
Preparing for the AS Economics Macro Paper 2012
 
Economic and Structural Report August 2008, extract from
Economic and Structural Report August 2008, extract fromEconomic and Structural Report August 2008, extract from
Economic and Structural Report August 2008, extract from
 
Nevada's Economy - March 2012
Nevada's Economy - March 2012Nevada's Economy - March 2012
Nevada's Economy - March 2012
 
Energy & Commodities, 2010, regarding May
Energy & Commodities, 2010, regarding MayEnergy & Commodities, 2010, regarding May
Energy & Commodities, 2010, regarding May
 
Flash Comment - July 8, 2011
Flash Comment - July 8, 2011Flash Comment - July 8, 2011
Flash Comment - July 8, 2011
 
The Lithuanian Economy - No 5, August 5, 2011
The Lithuanian Economy - No 5, August 5,  2011The Lithuanian Economy - No 5, August 5,  2011
The Lithuanian Economy - No 5, August 5, 2011
 
PMCWeeklyReview_082115
PMCWeeklyReview_082115PMCWeeklyReview_082115
PMCWeeklyReview_082115
 
Soaring Food Prices: A Threat or Opportunity in
Soaring Food Prices: A Threat or Opportunity inSoaring Food Prices: A Threat or Opportunity in
Soaring Food Prices: A Threat or Opportunity in
 
Swedbank Economic Outlook January 2010
Swedbank Economic Outlook January 2010Swedbank Economic Outlook January 2010
Swedbank Economic Outlook January 2010
 
Global inflation
Global inflationGlobal inflation
Global inflation
 
KBank Economics update Mar 2012
KBank Economics update   Mar 2012KBank Economics update   Mar 2012
KBank Economics update Mar 2012
 
Lithuanian Economy, No. 2 - March 9, 2012
Lithuanian Economy, No. 2 - March 9,  2012Lithuanian Economy, No. 2 - March 9,  2012
Lithuanian Economy, No. 2 - March 9, 2012
 
July 2013 Energy Index - Bord Gáis Energy
July 2013 Energy Index - Bord Gáis EnergyJuly 2013 Energy Index - Bord Gáis Energy
July 2013 Energy Index - Bord Gáis Energy
 
SEB-report: Consumption, exports boost eastern European economies
SEB-report: Consumption, exports boost eastern European economiesSEB-report: Consumption, exports boost eastern European economies
SEB-report: Consumption, exports boost eastern European economies
 
Flash Comment Estonia - June 7, 2011
Flash Comment Estonia - June 7, 2011Flash Comment Estonia - June 7, 2011
Flash Comment Estonia - June 7, 2011
 

More from Swedbank

More from Swedbank (20)

Swedbank corporate presentation April 25 2017
Swedbank corporate presentation April 25 2017Swedbank corporate presentation April 25 2017
Swedbank corporate presentation April 25 2017
 
Swedbank foretagspresentation 25 april 2017
Swedbank foretagspresentation 25 april 2017Swedbank foretagspresentation 25 april 2017
Swedbank foretagspresentation 25 april 2017
 
Delårsrapport kv1 2017
Delårsrapport kv1 2017Delårsrapport kv1 2017
Delårsrapport kv1 2017
 
Interim report q1 2017
Interim report q1 2017Interim report q1 2017
Interim report q1 2017
 
Year end report 2016
Year end report 2016Year end report 2016
Year end report 2016
 
Bokslutskommuniké 2016
Bokslutskommuniké 2016Bokslutskommuniké 2016
Bokslutskommuniké 2016
 
Swedbank företagspresentation, 2 februari 2017
Swedbank företagspresentation, 2 februari 2017Swedbank företagspresentation, 2 februari 2017
Swedbank företagspresentation, 2 februari 2017
 
Swedbank corporate presentation, February 2 2017
Swedbank corporate presentation, February 2 2017Swedbank corporate presentation, February 2 2017
Swedbank corporate presentation, February 2 2017
 
Swedbank Corporate Presentation, October 25 2016
Swedbank Corporate Presentation, October 25 2016Swedbank Corporate Presentation, October 25 2016
Swedbank Corporate Presentation, October 25 2016
 
Swedbank företagspresentation, 25 oktober 2016
Swedbank företagspresentation, 25 oktober 2016Swedbank företagspresentation, 25 oktober 2016
Swedbank företagspresentation, 25 oktober 2016
 
Swedbank Corporate Presentation, June 30 2016
Swedbank Corporate Presentation, June 30 2016Swedbank Corporate Presentation, June 30 2016
Swedbank Corporate Presentation, June 30 2016
 
Swedbank företagspresentation, 30 juni 2016
Swedbank företagspresentation, 30 juni 2016Swedbank företagspresentation, 30 juni 2016
Swedbank företagspresentation, 30 juni 2016
 
Swedbank corporate presentation Q1, 2016
Swedbank corporate presentation Q1, 2016Swedbank corporate presentation Q1, 2016
Swedbank corporate presentation Q1, 2016
 
Swedbank företagspresentation kvartal 1, 2016.
Swedbank företagspresentation kvartal 1, 2016.Swedbank företagspresentation kvartal 1, 2016.
Swedbank företagspresentation kvartal 1, 2016.
 
Swedbank corporate presentation Q4, 2015
Swedbank corporate presentation Q4, 2015Swedbank corporate presentation Q4, 2015
Swedbank corporate presentation Q4, 2015
 
Swedbank företagspresentation kvartal 4,2015
Swedbank företagspresentation kvartal 4,2015Swedbank företagspresentation kvartal 4,2015
Swedbank företagspresentation kvartal 4,2015
 
Year end report 2015
Year end report 2015Year end report 2015
Year end report 2015
 
Bokslutskommuniké 2015
Bokslutskommuniké 2015Bokslutskommuniké 2015
Bokslutskommuniké 2015
 
Swedbank Företagspresentation, September 2015
Swedbank Företagspresentation, September 2015Swedbank Företagspresentation, September 2015
Swedbank Företagspresentation, September 2015
 
Swedbank Corporate Presentation, September 2015
Swedbank Corporate Presentation, September 2015Swedbank Corporate Presentation, September 2015
Swedbank Corporate Presentation, September 2015
 

Recently uploaded

VIP Independent Call Girls in Mumbai 🌹 9920725232 ( Call Me ) Mumbai Escorts ...
VIP Independent Call Girls in Mumbai 🌹 9920725232 ( Call Me ) Mumbai Escorts ...VIP Independent Call Girls in Mumbai 🌹 9920725232 ( Call Me ) Mumbai Escorts ...
VIP Independent Call Girls in Mumbai 🌹 9920725232 ( Call Me ) Mumbai Escorts ...
dipikadinghjn ( Why You Choose Us? ) Escorts
 
( Jasmin ) Top VIP Escorts Service Dindigul 💧 7737669865 💧 by Dindigul Call G...
( Jasmin ) Top VIP Escorts Service Dindigul 💧 7737669865 💧 by Dindigul Call G...( Jasmin ) Top VIP Escorts Service Dindigul 💧 7737669865 💧 by Dindigul Call G...
( Jasmin ) Top VIP Escorts Service Dindigul 💧 7737669865 💧 by Dindigul Call G...
dipikadinghjn ( Why You Choose Us? ) Escorts
 
VIP Independent Call Girls in Mira Bhayandar 🌹 9920725232 ( Call Me ) Mumbai ...
VIP Independent Call Girls in Mira Bhayandar 🌹 9920725232 ( Call Me ) Mumbai ...VIP Independent Call Girls in Mira Bhayandar 🌹 9920725232 ( Call Me ) Mumbai ...
VIP Independent Call Girls in Mira Bhayandar 🌹 9920725232 ( Call Me ) Mumbai ...
dipikadinghjn ( Why You Choose Us? ) Escorts
 
VIP Independent Call Girls in Andheri 🌹 9920725232 ( Call Me ) Mumbai Escorts...
VIP Independent Call Girls in Andheri 🌹 9920725232 ( Call Me ) Mumbai Escorts...VIP Independent Call Girls in Andheri 🌹 9920725232 ( Call Me ) Mumbai Escorts...
VIP Independent Call Girls in Andheri 🌹 9920725232 ( Call Me ) Mumbai Escorts...
dipikadinghjn ( Why You Choose Us? ) Escorts
 
20240429 Calibre April 2024 Investor Presentation.pdf
20240429 Calibre April 2024 Investor Presentation.pdf20240429 Calibre April 2024 Investor Presentation.pdf
20240429 Calibre April 2024 Investor Presentation.pdf
Adnet Communications
 
VIP Call Girl Service Andheri West ⚡ 9920725232 What It Takes To Be The Best ...
VIP Call Girl Service Andheri West ⚡ 9920725232 What It Takes To Be The Best ...VIP Call Girl Service Andheri West ⚡ 9920725232 What It Takes To Be The Best ...
VIP Call Girl Service Andheri West ⚡ 9920725232 What It Takes To Be The Best ...
dipikadinghjn ( Why You Choose Us? ) Escorts
 

Recently uploaded (20)

The Economic History of the U.S. Lecture 23.pdf
The Economic History of the U.S. Lecture 23.pdfThe Economic History of the U.S. Lecture 23.pdf
The Economic History of the U.S. Lecture 23.pdf
 
WhatsApp 📞 Call : 9892124323 ✅Call Girls In Chembur ( Mumbai ) secure service
WhatsApp 📞 Call : 9892124323  ✅Call Girls In Chembur ( Mumbai ) secure serviceWhatsApp 📞 Call : 9892124323  ✅Call Girls In Chembur ( Mumbai ) secure service
WhatsApp 📞 Call : 9892124323 ✅Call Girls In Chembur ( Mumbai ) secure service
 
Top Rated Pune Call Girls Dighi ⟟ 6297143586 ⟟ Call Me For Genuine Sex Servi...
Top Rated  Pune Call Girls Dighi ⟟ 6297143586 ⟟ Call Me For Genuine Sex Servi...Top Rated  Pune Call Girls Dighi ⟟ 6297143586 ⟟ Call Me For Genuine Sex Servi...
Top Rated Pune Call Girls Dighi ⟟ 6297143586 ⟟ Call Me For Genuine Sex Servi...
 
VIP Independent Call Girls in Mumbai 🌹 9920725232 ( Call Me ) Mumbai Escorts ...
VIP Independent Call Girls in Mumbai 🌹 9920725232 ( Call Me ) Mumbai Escorts ...VIP Independent Call Girls in Mumbai 🌹 9920725232 ( Call Me ) Mumbai Escorts ...
VIP Independent Call Girls in Mumbai 🌹 9920725232 ( Call Me ) Mumbai Escorts ...
 
Mira Road Awesome 100% Independent Call Girls NUmber-9833754194-Dahisar Inter...
Mira Road Awesome 100% Independent Call Girls NUmber-9833754194-Dahisar Inter...Mira Road Awesome 100% Independent Call Girls NUmber-9833754194-Dahisar Inter...
Mira Road Awesome 100% Independent Call Girls NUmber-9833754194-Dahisar Inter...
 
05_Annelore Lenoir_Docbyte_MeetupDora&Cybersecurity.pptx
05_Annelore Lenoir_Docbyte_MeetupDora&Cybersecurity.pptx05_Annelore Lenoir_Docbyte_MeetupDora&Cybersecurity.pptx
05_Annelore Lenoir_Docbyte_MeetupDora&Cybersecurity.pptx
 
( Jasmin ) Top VIP Escorts Service Dindigul 💧 7737669865 💧 by Dindigul Call G...
( Jasmin ) Top VIP Escorts Service Dindigul 💧 7737669865 💧 by Dindigul Call G...( Jasmin ) Top VIP Escorts Service Dindigul 💧 7737669865 💧 by Dindigul Call G...
( Jasmin ) Top VIP Escorts Service Dindigul 💧 7737669865 💧 by Dindigul Call G...
 
VIP Independent Call Girls in Mira Bhayandar 🌹 9920725232 ( Call Me ) Mumbai ...
VIP Independent Call Girls in Mira Bhayandar 🌹 9920725232 ( Call Me ) Mumbai ...VIP Independent Call Girls in Mira Bhayandar 🌹 9920725232 ( Call Me ) Mumbai ...
VIP Independent Call Girls in Mira Bhayandar 🌹 9920725232 ( Call Me ) Mumbai ...
 
VIP Independent Call Girls in Andheri 🌹 9920725232 ( Call Me ) Mumbai Escorts...
VIP Independent Call Girls in Andheri 🌹 9920725232 ( Call Me ) Mumbai Escorts...VIP Independent Call Girls in Andheri 🌹 9920725232 ( Call Me ) Mumbai Escorts...
VIP Independent Call Girls in Andheri 🌹 9920725232 ( Call Me ) Mumbai Escorts...
 
Vasai-Virar Fantastic Call Girls-9833754194-Call Girls MUmbai
Vasai-Virar Fantastic Call Girls-9833754194-Call Girls MUmbaiVasai-Virar Fantastic Call Girls-9833754194-Call Girls MUmbai
Vasai-Virar Fantastic Call Girls-9833754194-Call Girls MUmbai
 
Indore Real Estate Market Trends Report.pdf
Indore Real Estate Market Trends Report.pdfIndore Real Estate Market Trends Report.pdf
Indore Real Estate Market Trends Report.pdf
 
20240429 Calibre April 2024 Investor Presentation.pdf
20240429 Calibre April 2024 Investor Presentation.pdf20240429 Calibre April 2024 Investor Presentation.pdf
20240429 Calibre April 2024 Investor Presentation.pdf
 
Solution Manual for Principles of Corporate Finance 14th Edition by Richard B...
Solution Manual for Principles of Corporate Finance 14th Edition by Richard B...Solution Manual for Principles of Corporate Finance 14th Edition by Richard B...
Solution Manual for Principles of Corporate Finance 14th Edition by Richard B...
 
TEST BANK For Corporate Finance, 13th Edition By Stephen Ross, Randolph Weste...
TEST BANK For Corporate Finance, 13th Edition By Stephen Ross, Randolph Weste...TEST BANK For Corporate Finance, 13th Edition By Stephen Ross, Randolph Weste...
TEST BANK For Corporate Finance, 13th Edition By Stephen Ross, Randolph Weste...
 
Solution Manual for Financial Accounting, 11th Edition by Robert Libby, Patri...
Solution Manual for Financial Accounting, 11th Edition by Robert Libby, Patri...Solution Manual for Financial Accounting, 11th Edition by Robert Libby, Patri...
Solution Manual for Financial Accounting, 11th Edition by Robert Libby, Patri...
 
(INDIRA) Call Girl Mumbai Call Now 8250077686 Mumbai Escorts 24x7
(INDIRA) Call Girl Mumbai Call Now 8250077686 Mumbai Escorts 24x7(INDIRA) Call Girl Mumbai Call Now 8250077686 Mumbai Escorts 24x7
(INDIRA) Call Girl Mumbai Call Now 8250077686 Mumbai Escorts 24x7
 
VIP Call Girl Service Andheri West ⚡ 9920725232 What It Takes To Be The Best ...
VIP Call Girl Service Andheri West ⚡ 9920725232 What It Takes To Be The Best ...VIP Call Girl Service Andheri West ⚡ 9920725232 What It Takes To Be The Best ...
VIP Call Girl Service Andheri West ⚡ 9920725232 What It Takes To Be The Best ...
 
The Economic History of the U.S. Lecture 20.pdf
The Economic History of the U.S. Lecture 20.pdfThe Economic History of the U.S. Lecture 20.pdf
The Economic History of the U.S. Lecture 20.pdf
 
Shrambal_Distributors_Newsletter_Apr-2024 (1).pdf
Shrambal_Distributors_Newsletter_Apr-2024 (1).pdfShrambal_Distributors_Newsletter_Apr-2024 (1).pdf
Shrambal_Distributors_Newsletter_Apr-2024 (1).pdf
 
The Economic History of the U.S. Lecture 21.pdf
The Economic History of the U.S. Lecture 21.pdfThe Economic History of the U.S. Lecture 21.pdf
The Economic History of the U.S. Lecture 21.pdf
 

Energy & Commodities, No.3, 14 March 2011

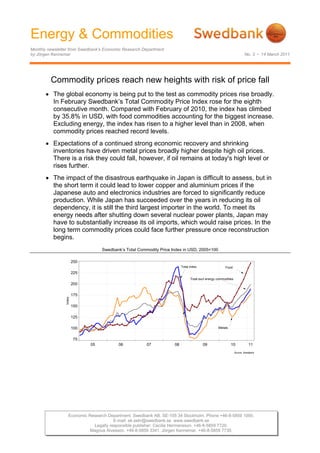
  • 1. Energy & Commodities Monthly newsletter from Swedbank’s Economic Research Department by Jörgen Kennemar No. 3 • 14 March 2011 Commodity prices reach new heights with risk of price fall • The global economy is being put to the test as commodity prices rise broadly. In February Swedbank’s Total Commodity Price Index rose for the eighth consecutive month. Compared with February of 2010, the index has climbed by 35.8% in USD, with food commodities accounting for the biggest increase. Excluding energy, the index has risen to a higher level than in 2008, when commodity prices reached record levels. • Expectations of a continued strong economic recovery and shrinking inventories have driven metal prices broadly higher despite high oil prices. There is a risk they could fall, however, if oil remains at today's high level or rises further. • The impact of the disastrous earthquake in Japan is difficult to assess, but in the short term it could lead to lower copper and aluminium prices if the Japanese auto and electronics industries are forced to significantly reduce production. While Japan has succeeded over the years in reducing its oil dependency, it is still the third largest importer in the world. To meet its energy needs after shutting down several nuclear power plants, Japan may have to substantially increase its oil imports, which would raise prices. In the long term commodity prices could face further pressure once reconstruction begins. Swedbank’s Total Commodity Price Index in USD, 2005=100 250 Total index Food 225 Total excl energy commodities 200 175 Index 150 125 100 Metals 75 05 06 07 08 09 10 11 Source: Swedbank Economic Research Department. Swedbank AB. SE-105 34 Stockholm. Phone +46-8-5859 1000. E-mail: ek.sekr@swedbank.se www.swedbank.se Legally responsible publisher: Cecilia Hermansson. +46-8-5859 7720. Magnus Alvesson. +46-8-5859 3341. Jörgen Kennemar. +46-8-5859 7730.
  • 2. Energy & Commodities Monthly newsletter from Swedbank’s Economic Research Department by Jörgen Kennemar No. 3 • 14 March 2011 Swedbank’s Total Commodity Price Index rose also risen substantially, but are still below the by an average of 4.4% in USD in February previous peak two and a half years ago. Other compared with the previous month. It was the agricultural products such as cotton have also eighth consecutive monthly increase, with the reached record highs this year, which is raising index reaching its highest level since commodity costs for the textile industry. September 2008. In euro, the price increase was slightly lower, at 2.2%. The krona’s The substantial price rise is being driven by appreciation against the dollar means that lower supplies of foods and other agricultural commodity prices gained a more modest 0.6% commodities due to poor harvests, though also in SEK between January and February. because of growing demand around the world. Excluding energy, the index is higher than two This has led to declining inventory levels. and a half years ago. That supply restrictions Demand is also affected by efforts by several are becoming more common is a sign of countries to build up their inventories to slow insufficient production capacity as the domestic inflation pressures and reduce the economy improves. The global financial crisis risk of social tensions. This is cutting into may have delayed new investments in supplies on the global market, causing prices commodity industries. Low interest rates and to rise. High oil prices also tend to raise food unconventional measures taken by central prices, since oil is an important input good in banks, like buying government debt to agricultural production. We think food prices stimulate the economy, have created greater could rise even more in the months ahead due liquidity in financial markets and may have to higher oil prices and shrinking inventories. added fuel to the commodity price rise in the Not until the second half of 2011 is it likely that last year. To ensure access to commodities prices could fall from today's high levels, and reduce price volatility, investments will be provided that production rises sharply and needed to expand future production capacity. It inventories recover. Experience from the food is also important that commodities are crisis in 2008 shows that high prices often lead consumed more efficiently, especially by to higher production. At the same time emerging economies, which account for a available acreage for food production is growing share of consumption. The current increasing. Further production disruptions such National People's Congress in Beijing is as bad weather, high oil prices and export planning several measures to reduce embargoes in several large net exporters commodity consumption and raise efficiency. increase the risk that food prices could While this may eventually reduce China's continue higher. vulnerability, in the short term it will not alleviate the problem that supply is rising more Oil price shock threatens the global slowly than demand. economy The global economic rebound and cold winter Food prices noted the largest price increase in pushed oil prices above USD 100 a barrel Swedbank’s Commodity Price Index in even before the political turbulence in North February, and since the start of the year have Africa began in late January. Global risen by nearly 11% on average in USD, more consumption rose by 3.3% in 2010 to 87.8 than crude and metals. After increasing by just billion barrels a day, or 1.7 billion barrels more over 50% since last summer, Swedbank’s than the last peak in 2008. Most of the Price Index for food commodities is higher than increase is coming from outside the OECD, led during the food crisis in 2008. This applies to by Asia excluding Japan. This trend has coffee, sugar, beverages and several grains strengthened in recent years as OECD such as barley and corn. Wheat prices have countries have reduced their consumption. The Economic Research Department. Swedbank AB. SE-105 34 Stockholm. Phone +46-8-5859 1000. E-mail: ek.sekr@swedbank.se www.swedbank.se Legally responsible publisher: Cecilia Hermansson. +46-8-5859 7720. Magnus Alvesson. +46-8-5859 3341. Jörgen Kennemar. +46-8-5859 7730.
  • 3. Energy & Commodities Monthly newsletter from Swedbank’s Economic Research Department, continued No. 3 • 14 March 2011 growing dependency on oil in emerging days. Uncertainty about future oil supplies is economies will continue in the years ahead as growing at a time when the global economy is buying power rises and a larger middle class getting stronger. The International Energy takes shape. Agency (IEA) is predicting that global oil consumption will increase by 1.5 million barrels Oil production climbed by 2.5% in 2010 to 83.7 a day in 2011, which corresponds to Libya's billion barrels a day, with OPEC generating previous oil production volume. Oil futures nearly half the increase, while production suggest that high prices will persist in 2011, volume in OECD countries as a whole was with a price of around USD 115 dollar a barrel unchanged. Although demand grew faster than for delivery in December, before falling to USD supply, supplies remain good, as indicated by 110 for delivery in late 2012. The price picture the OECD’s inventories, which are above their could change quickly if the political situation historical average for the period 2005-2009. It stabilises, which could drop prices to USD 100, is noteworthy, however, that price of Northern which we think is more reasonable considering European oil (Brent crude) is significantly fundamentals in the oil market. Uncertainty is higher (USD 15 more at the time of writing) great, however, so we cannot rule out than North American (WTI crude), which is significantly higher oil prices if political priced in the US market. In addition to quality concerns in the region continue. differences – WTI contains less sulphur than Northern European oil – the big price Although the global economy is less difference is due to major regional imbalances, dependent on oil than during previous oil price with a lower supply of Brent crude in Europe shocks, a substantial rise in prices will and a growing surplus of WTI in the US. adversely affect growth. The rule of thumb is that if the price of oil rises by 10%, global Crude oil consumption, millions barrels/day growth will slow by 0.2% in the first year and 50.0 0.4% in the second. Our assumption of a year- 47.5 on-year increase of 25% in oil prices in 2011 45.0 means growth could slow even more, i.e., 42.5 Barrel/Day (millions) 40.0 upwards of one percentage point over a two- 37.5 year period, which would also affect 35.0 32.5 commodity demand. It is important, however, 30.0 to qualify how higher oil prices affect global 27.5 economy – whether through increased demand 25.0 95 96 97 98 99 00 01 02 03 04 05 06 07 08 09 10 or supply shortages, the latter of which would OECD Total Non-OECD Source: Reuters EcoWin probably have a greater negative impact. When the political conflict in the Middle East Oil futures for Brent crude spread to Libya in February, it caused growing 120 concerns about future oil supplies from OPEC, 110 which accounts for one third of global production, and oil prices rose to slightly over 100 USD 115 a barrel from USD 103 in early 90 February. Despite the Libyan oil production 80 represents only 2% of the global total, the 70 problem is uncertainty whether political developments in the region could jeopardize 60 jan feb mar apr maj jun jul aug sep okt nov dec jan feb mar supplies from major producers such as Saudi Spot price 10 Brent Crude Futures Dec 2011 Brent Crude Futures Dec 2012 11 Source: Reuters EcoWin Arabia, Iran and Iraq, which supply 40% of OPEC’s total production. Available production Tighter supply of metals capacity in OPEC countries of 4-6 million The price trend for metals is continuing, and in barrels a day can keep prices in check. Part of February prices rose by 4.2% in USD from the this capacity is replacing Libya's production, which has dropped substantially in recent previous month. Nickel accounted for the 3 (6)
  • 4. Energy & Commodities Monthly newsletter from Swedbank’s Economic Research Department, continued No. 3 • 14 March 2011 largest increase (10.3%), followed by zinc medium-term goal of authorities there. In total, (32%) and copper (3.2%). Lead fell the most in steel production is expected to rise by 5% this price in the last month. Supply conditions for year. many metals have tightened as demand outpaces production. This is especially true of The powerful earthquake in Japan could have copper, tin and iron ore, where prices are at an impact on global metal prices, even though record highs and inventories are expected to the affected region accounts for only about 2% reach critically low levels in 2011, even if of the country's GDP. The Japanese auto and actual inventory data do not show it yet. The electronics industries will face serious increase in copper inventories since December production and delivery disruptions, which has not prevented prices from rising. should reduce aluminium and copper Expectations of further economic expansion in consumption. Another uncertainty affecting Asia, capacities shortages and lower ore Japanese industry is the risk of an energy quality in existing mines are also contributing shortage after several nuclear power to rising prices. International experts predict an generators have been shut down following the increase in copper consumption of around explosion in Fukushima and for safety reasons. 4.5% in 2011, while production is expected to Since the oil crisis in the 1970s, when oil gain just over 1%. Aluminium, nickel and zinc supplied two thirds of the country's electricity inventories are not as constrained, so price production, a large share has been replaced by increases for these metals are expected to be nuclear power. The earthquake and damage to lower. The chances of further increases in buildings and infrastructure could also limit the metal prices will decline if oil prices remain supply of steel on the global market if a larger high. share of the 100 million tons Japan produces were used domestically instead of exported. Inventory levels for metals, millions of tons Jörgen Kennemar 1.0 225000 0.9 200000 Nickel, right scal 0.8 175000 0.7 150000 Ton (metric) (millions) 0.6 Copper 125000 Ton (metric) 0.5 Zink 100000 0.4 75000 0.3 50000 0.2 25000 0.1 0 Lead 0.0 -25000 00 01 02 03 04 05 06 07 08 09 10 11 Source: LME, Reuters EcoWin Global steel production increased by as much as 15% in 2010, with China accounting for 44%, followed by Japan at 8%. Production volume of over 1.4 billion tons last year was a record high, which is driving iron ore prices higher. At the same time the supply of iron ore in the global market has been hurt by lower exports from India (the world's third largest exporter after Australia and Brazil), due to rising domestic demand and export restrictions. Spot prices of iron ore, which now serve as a guide for quarterly prices, consistently point higher in the next quarter. Estimates of a further increase in Chinese steel production would indicate high iron ore prices, despite that China’s expansion is expected to slow slightly in 2011, which is the 4 (6)
  • 5. Energy & Commodities Monthly newsletter from Swedbank’s Economic Research Department by Jörgen Kennemar No. 3 • 14 March 2011 Swedbank Commodity Index - US$ - Swedbank Commodity Index - SKr - Basis 2000 = 1oo 14/03/11 Basis 2000 = 1oo 14/03/11 12.2010 1.2011 2.2011 12.2010 1.2011 2.2011 Total index 314.2 327.1 341.3 Total index 233.6 237.1 238.6 Per cent change month ago 5.8 4.1 4.4 Per cent change month ago 6.1 1.5 0.6 Per cent change year ago 25.0 25.5 35.8 Per cent change year ago 19.7 17.2 20.3 Total index exclusive energy 292.7 308.7 318.9 Total index exclusive energy 217.6 223.8 222.9 Per cent change month ago 3.1 5.5 3.3 Per cent change month ago 3.4 2.8 -0.4 Per cent change year ago 33.2 37.5 47.6 Per cent change year ago 27.6 28.4 30.7 Food, tropical beverages 286.2 302.5 317.6 Food, tropical beverages 212.8 219.3 222.0 Per cent change month ago 6.0 5.7 5.0 Per cent change month ago 6.3 3.1 1.2 Per cent change year ago 26.1 32.2 45.6 Per cent change year ago 20.8 23.5 29.0 Cereals 278.9 294.7 314.5 Cereals 207.4 213.7 219.8 Per cent change month ago 8.5 5.7 6.7 Per cent change month ago 8.8 3.0 2.9 Per cent change year ago 36.2 49.4 67.6 Per cent change year ago 30.5 39.5 48.4 Tropical beverages and tobacco 301.5 317.0 337.8 Tropical beverages and tobacco 224.2 229.8 236.1 Per cent change month ago 5.7 5.1 6.6 Per cent change month ago 6.0 2.5 2.7 Per cent change year ago 22.5 24.0 38.8 Per cent change year ago 17.4 15.8 23.0 Coffee 183.8 196.8 215.2 Coffee 136.7 142.7 150.4 Per cent change month ago 5.7 7.1 9.3 Per cent change month ago 6.0 4.4 5.4 Per cent change year ago 47.0 55.1 74.4 Per cent change year ago 40.9 44.9 54.5 Oilseeds and oil 258.0 276.4 276.1 Oilseeds and oil 191.8 200.4 193.0 Per cent change month ago 4.8 7.1 -0.1 Per cent change month ago 5.1 4.5 -3.7 Per cent change year ago 28.7 44.4 50.2 Per cent change year ago 23.3 34.9 33.0 Industrial raw materials 294.6 310.5 319.3 Industrial raw materials 219.0 225.1 223.2 Per cent change month ago 2.3 5.4 2.8 Per cent change month ago 2.6 2.8 -0.9 Per cent change year ago 35.4 39.0 48.2 Per cent change year ago 29.7 29.9 31.2 Agricultural raw materials 193.2 200.8 207.0 Agricultural raw materials 143.6 145.6 144.7 Per cent change month ago 1.3 3.9 3.1 Per cent change month ago 1.6 1.4 -0.6 Per cent change year ago 23.1 26.5 31.3 Per cent change year ago 18.0 18.2 16.3 Cotton 140.8 151.6 185.8 Cotton 104.7 109.9 129.9 Per cent change month ago 6.7 7.7 22.6 Per cent change month ago 7.0 5.0 18.1 Per cent change year ago 88.5 110.8 149.4 Per cent change year ago 80.6 97.0 120.9 Softwood 144.6 144.2 144.6 Softwood 107.5 104.5 101.1 Per cent change month ago -3.1 -0.3 0.3 Per cent change month ago -2.9 -2.8 -3.3 Per cent change year ago 3.4 4.0 6.0 Per cent change year ago -0.9 -2.8 -6.1 Woodpulp 949.8 949.0 949.1 Woodpulp 706.2 688.0 663.3 Per cent change month ago -0.7 -0.1 0.0 Per cent change month ago -0.5 -2.6 -3.6 Per cent change year ago 19.3 16.5 13.0 Per cent change year ago 14.3 8.9 0.0 Non-ferrous metals 275.6 288.3 300.3 Non-ferrous metals 204.9 209.0 209.9 Per cent change month ago 4.4 4.6 4.2 Per cent change month ago 4.7 2.0 0.4 Per cent change year ago 22.2 21.6 36.7 Per cent change year ago 17.0 13.6 21.1 Copper 9130.1 9563.7 9867.2 Copper 6788.0 6933.7 6896.3 Per cent change month ago 7.8 4.7 3.2 Per cent change month ago 8.1 2.1 -0.5 Per cent change year ago 31.1 29.5 44.4 Per cent change year ago 25.6 21.0 27.9 Aluminium 2347.4 2440.2 2507.8 Aluminium 1745.2 1769.1 1752.7 Per cent change month ago 0.6 4.0 2.8 Per cent change month ago 0.9 1.4 -0.9 Per cent change year ago 7.8 9.1 22.7 Per cent change year ago 3.2 1.9 8.7 Lead 2404.9 2600.2 2586.2 Lead 1788.0 1885.1 1807.5 Per cent change month ago 1.2 8.1 -0.5 Per cent change month ago 1.5 5.4 -4.1 Per cent change year ago 3.5 9.8 21.3 Per cent change year ago -0.9 2.6 7.5 Zinc 2272.7 2373.9 2464.7 Zinc 1689.7 1721.1 1722.6 Per cent change month ago -0.8 4.5 3.8 Per cent change month ago -0.5 1.9 0.1 Per cent change year ago -3.9 -2.5 14.4 Per cent change year ago -8.0 -8.9 1.3 Nickel 24055.5 25609.4 28250.1 Nickel 17884.7 18566.8 19744.4 Per cent change month ago 5.0 6.5 10.3 Per cent change month ago 5.3 3.8 6.3 Per cent change year ago 41.6 38.9 49.7 Per cent change year ago 35.6 29.8 32.6 Iron ore, steel scrap 607.0 653.3 660.0 Iron ore, steel scrap 451.3 473.6 461.3 Per cent change month ago 0.7 7.6 1.0 Per cent change month ago 1.0 5.0 -2.6 Per cent change year ago 73.4 86.6 87.8 Per cent change year ago 66.1 74.3 66.3 Energy raw materials 323.8 335.2 351.3 Energy raw materials 240.7 243.0 245.5 Per cent change month ago 6.8 3.5 4.8 Per cent change month ago 7.2 1.0 1.0 Per cent change year ago 21.9 21.2 31.6 Per cent change year ago 16.8 13.2 16.6 Coking coal 454.7 490.5 479.3 Coking coal 338.1 355.6 335.0 Per cent change month ago 11.8 7.9 -2.3 Per cent change month ago 12.1 5.2 -5.8 Per cent change year ago 48.5 34.2 37.8 Per cent change year ago 42.3 25.4 22.0 Crude oil 317.8 328.1 345.4 Crude oil 236.3 237.9 241.4 Per cent change month ago 6.5 3.2 5.3 Per cent change month ago 6.8 0.7 1.5 Per cent change year ago 20.5 20.4 31.2 Per cent change year ago 15.5 12.5 16.2 Source : SWEDBANK and HWWA-Institute for Economic Research Hamburg Source : SWEDBANK and HWWA-Institute for Economic Research Hamburg Swedbank Economic Research Department Swedbank’s monthly Energy & Commodities newsletter is published as a service to our customers. We believe that we have used reliable sources and methods in the preparation SE-105 34 Stockholm, Sweden of the analyses reported in this publication. However, we cannot guarantee the accuracy or Phone +46-8-5859 7740 completeness of the report and cannot be held responsible for any error or omission in the ek.sekr@swedbank.se underlying material or its use. Readers are encouraged to base any (investment) decisions www.swedbank.se on other material as well. Neither Swedbank nor its employees may be held responsible for Legally responsible publisher losses or damages, direct or indirect, owing to any errors or omissions in Swedbank’s Cecilia Hermansson, +46-88-5859 7720 monthly Energy & Commodities newsletter. Magnus Alvesson, +46-8-5859 3341 Jörgen Kennemar, +46-8-5859 7730 Economic Research Department. Swedbank AB. SE-105 34 Stockholm. Phone +46-8-5859 1000. E-mail: ek.sekr@swedbank.se www.swedbank.se Legally responsible publisher: Cecilia Hermansson. +46-8-5859 7720. Magnus Alvesson. +46-8-5859 3341. Jörgen Kennemar. +46-8-5859 7730.