Energy & Commodities, No. 1 - January 19, 2012
•
0 likes•283 views

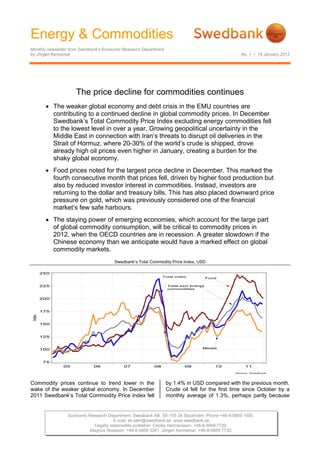
Commodity prices continued to trend lower in December 2011. Swedbank's Total Commodity Price Index fell by 1.4% for the month, driven by a 1.3% drop in crude oil prices. Food prices saw the largest monthly decline, falling for the fourth consecutive month as higher production has increased inventories. However, commodity prices remain volatile and uncertain global economic conditions could lead to further declines in 2012 depending on developments in the Eurozone crisis and growth in emerging economies such as China.

Recommended
Recommended
More Related Content
What's hot
What's hot (20)
Viewers also liked
Viewers also liked (8)
Similar to Energy & Commodities, No. 1 - January 19, 2012
Similar to Energy & Commodities, No. 1 - January 19, 2012 (18)
More from Swedbank
More from Swedbank (20)
Recently uploaded
Recently uploaded (20)
Energy & Commodities, No. 1 - January 19, 2012
- 1. Energy & Commodities Monthly newsletter from Swedbank’s Economic Research Department by Jörgen Kennemar No. 1 • 19 January 2012 The price decline for commodities continues The weaker global economy and debt crisis in the EMU countries are contributing to a continued decline in global commodity prices. In December Swedbank’s Total Commodity Price Index excluding energy commodities fell to the lowest level in over a year. Growing geopolitical uncertainty in the Middle East in connection with Iran’s threats to disrupt oil deliveries in the Strait of Hormuz, where 20-30% of the world’s crude is shipped, drove already high oil prices even higher in January, creating a burden for the shaky global economy. Food prices noted for the largest price decline in December. This marked the fourth consecutive month that prices fell, driven by higher food production but also by reduced investor interest in commodities. Instead, investors are returning to the dollar and treasury bills. This has also placed downward price pressure on gold, which was previously considered one of the financial market’s few safe harbours. The staying power of emerging economies, which account for the large part of global commodity consumption, will be critical to commodity prices in 2012, when the OECD countries are in recession. A greater slowdown if the Chinese economy than we anticipate would have a marked effect on global commodity markets. Swedbank’s Total Commodity Price Index, USD Commodity prices continue to trend lower in the by 1.4% in USD compared with the previous month. wake of the weaker global economy. In December Crude oil fell for the first time since October by a 2011 Swedbank’s Total Commodity Price Index fell monthly average of 1.3%, perhaps partly because Economic Research Department. Swedbank AB. SE-105 34 Stockholm. Phone +46-8-5859 1000. E-mail: ek.sekr@swedbank.se www.swedbank.se Legally responsible publisher: Cecilia Hermansson. +46-8-5859 7720. Magnus Alvesson. +46-8-5859 3341. Jörgen Kennemar. +46-8-5859 7730.
- 2. Energy & Commodities Monthly newsletter from Swedbank’s Economic Research Department, continued No. 1 • 19 January 2012 of OPEC’s decision at its December summit to raise Industrial metal inventories, millions of tons the official production quota for the first time since 2008, to 30 million barrels per day from 26 million. Actual production has been significantly higher than previous targets, however, due to which the revised target in December is more in line with actual production. Our forecast is that the average oil price will fall to USD 102 per barrel in 2012 from USD 112 last year as the global economy weakens, Ton (metric) Ton (metric) mainly in OECD countries, where oil consumption is expected to decrease. In emerging economies, on the other hand, consumption will rise, though at a slightly slower pace. China is currently the world’s second largest oil consumer after the US. An anticipated appreciation of the dollar would also slow the price of oil. The forecast risks are high on both the up- and downside, however. The Iranian threat to stop oil shipments in the Strait of Hormuz due to the EU Inventories for a number of industrial metals embargo on Iranian oil has led to a higher risk trended in the opposite direction at the end of the premium in January 2012. Rapidly growing public year, which may indicate that underlying demand spending in several oil-producing countries to tame has been underestimated at the same time that the risk of social tension in the wake of the Arab lower price levels could create a greater incentive to Spring will require higher crude prices if public build up inventory. Copper inventories have fallen finances are going to reach a balance. Saudi Arabia since last September to the lowest levels in over a plans to raise its public spending by 19% in 2012. A year, a decline of 118 000 tons. This was at the more severe recession in EMU countries, with a same time that Chinese copper imports rose greater negative effect on emerging economies and substantially in December. Shrinking inventories are global financial markets, could, however, lead to a also being driven by lower metal goods significantly larger decline for crude than we are manufacturing as demand weakens, but also by forecasting. During the financial crisis in 2008/2009 unfavourable weather conditions. Copper crude fell to below USD 40 at the same time that oil production rose a modest 0.3% in the first nine consumption dropped to just over 5 million barrels. months of 2011, while consumption climbed 1%. In addition to fundamental factors, the price decline Our projection is that metal prices will continue to was reinforced by a flight by investors from oil to decline in 2012 as global growth slows. The decline less risky alternatives. Similar financial flows could will be mitigated by limited supply, however, at the occur if the EMU’s fiscal crisis has a greater impact same time that the expansion is expected to on the global financial markets than we now continue in the commodity-intensive economies, foresee. though at a slower rate. Expectations that Chinese austerity will ease going forward have increased The downward price trend for commodities is more recently due to its lower inflation rate (4.1% in evident when energy is excluded, as reflected in December) at the same time that GDP is growing at Swedbank’s Commodity Price Index, which has a slower pace (8.9% at an annual rate in the fourth fallen for five consecutive months. In December it quarter of 2011). Looser economic policy in China dropped by 2% in USD, reaching the lowest level could push metal prices higher. since August 2010. Even in euro terms, the index has fallen broadly, by 16% since peaking in early The price decline for iron ore and scrap in USD was 2011. Economically sensitive metal prices fell in limited to 0.3% in December compared with the December by an additional 1.2%. This means that previous month. This is clearly a slowdown after the the index for non-ferrous metals has dropped nearly major decline in October and November, which 25% since April 2011, when prices began turning totalled nearly 20%. Global steel production rose by downward in connection with weaker global 3.1% on an annual basis in the third quarter of last industrial activity. Nickel is the metal with the largest year. This means that global production has price decline last year, followed by copper, lead and reached a new record level, although the rate of zinc. increase has slowed from 2010. Steel prices continue to decline, however, and in December were 15% lower than in May 2011. 2
- 3. Energy & Commodities Monthly newsletter from Swedbank’s Economic Research Department, continued No. 1 • 19 January 2012 Price development for iron ore and steel in USD Price index for various food commodities in USD Index Higher production is lowering food prices Price volatility has remained high in recent years, underscoring the impact of production disruptions, Food fundamentals have changed significantly in as was certainly the case in 2010. At the same time the last half-year. In December 2011 prices fell by global food demand is rising due to a growing 3.7% in USD compared with November, which population and increased purchasing power. This means that the index is at the lowest level since places higher demands on food production and October 2010. It also places downward pressure on improved trade in agricultural and food products. inflation, primarily in countries where food Changes in energy prices are another factor represents a large share of total household affecting food prices, where energy accounts for a spending. Increased access to food, not least significant share of total production costs. Rising oil through higher global food production, has meant prices also tend to increase competition between that inventories, which were previously at critically food and ethanol production, driving up food prices. low levels, have grown. Grain production is In 2011 global ethanol production grew significantly estimated to have risen by 6.5% in 2011, which has slower than the previous year. Higher than led to higher inventory levels. Production forecasts expected oil prices increase the economic incentive for 2012 point to a further increase, although the to expand ethanol production, however. Among rate is expected to slow partly because it will be agricultural commodities, cotton reported the less economically profitable to raise production biggest monthly price increase in USD in December volumes when food prices are lower. (7.4%), followed by pulp (4.7%) and oilseeds (4.3%). Uncertain global economic conditions, with the risk of increased credit austerity if the sovereign debt crisis in the EMU countries worsens, could lead to a larger, longer-lasting decline in commodity prices than we now expect. Jörgen Kennemar 3
- 4. Energy & Commodities Monthly newsletter from Swedbank’s Economic Research Department, continued No. 1 • 19 January 2012 Swedbank Commodity Index - US$ - Swedbank Commodity Index - SKr - Basis 2000 = 1oo 25-01-12 Basis 2000 = 1oo 25-01-12 10.2011 11.2011 12.2011 10.2011 11.2011 12.2011 T otal index 356.1 365.0 359.7 T otal index 257.4 267.4 267.8 Per cent change month ago -3.2 2.5 -1.4 Per cent change month ago -3.1 3.9 0.2 Per cent change year ago 23.5 22.8 14.5 Per cent change year ago 23.2 21.4 14.6 T otal index exclusive energy 282.5 269.5 264.1 T otal index exclusive energy 204.2 197.4 196.6 Per cent change month ago -8.4 -4.6 -2.0 Per cent change month ago -8.3 -3.3 -0.4 Per cent change year ago 1.1 -5.0 -9.8 Per cent change year ago 0.8 -6.2 -9.6 Food, tropical beverages 275.0 268.6 258.7 Food, tropical beverages 198.8 196.8 192.6 Per cent change month ago -7.8 -2.3 -3.7 Per cent change month ago -7.7 -1.0 -2.1 Per cent change year ago 7.1 -0.6 -9.6 Per cent change year ago 6.8 -1.7 -9.5 Cereals 281.8 277.2 269.0 Cereals 203.7 203.1 200.3 Per cent change month ago -7.9 -1.6 -3.0 Per cent change month ago -7.8 -0.3 -1.4 Per cent change year ago 11.6 7.8 -3.5 Per cent change year ago 11.3 6.6 -3.4 T ropical beverages and tobacco 293.8 286.5 274.0 T ropical beverages and tobacco 212.4 209.9 204.0 Per cent change month ago -7.4 -2.5 -4.4 Per cent change month ago -7.3 -1.2 -2.8 Per cent change year ago 8.5 0.5 -9.1 Per cent change year ago 8.1 -0.7 -9.0 Coffee 194.1 193.7 189.1 Coffee 140.3 141.9 140.8 Per cent change month ago -8.9 -0.2 -2.4 Per cent change month ago -8.7 1.1 -0.8 Per cent change year ago 20.1 11.4 2.9 Per cent change year ago 19.8 10.1 3.0 Oilseeds and oil 229.8 224.2 218.8 Oilseeds and oil 166.1 164.3 162.9 Per cent change month ago -8.8 -2.4 -2.4 Per cent change month ago -8.6 -1.1 -0.8 Per cent change year ago 0.5 -8.9 -15.2 Per cent change year ago 0.2 -10.0 -15.1 Industrial raw materials 284.6 269.8 265.7 Industrial raw materials 205.7 197.6 197.8 Per cent change month ago -8.6 -5.2 -1.5 Per cent change month ago -8.4 -3.9 0.1 Per cent change year ago -0.5 -6.3 -9.8 Per cent change year ago -0.8 -7.4 -9.7 Agricultural raw materials 186.9 173.7 167.1 Agricultural raw materials 135.1 127.3 124.4 Per cent change month ago -4.4 -7.1 -3.8 Per cent change month ago -4.3 -5.8 -2.2 Per cent change year ago 0.6 -8.9 -13.5 Per cent change year ago 0.3 -10.0 -13.4 Cotton 101.2 96.2 89.1 Cotton 73.2 70.5 66.3 Per cent change month ago -3.9 -4.9 -7.4 Per cent change month ago -3.7 -3.7 -5.9 Per cent change year ago -10.0 -27.1 -36.7 Per cent change year ago -10.3 -28.0 -36.6 Softwood 144.7 138.3 132.3 Softwood 104.6 101.3 98.5 Per cent change month ago -2.5 -3.1 -2.8 Per cent change month ago -2.6 -4.4 -4.3 Per cent change year ago -6.0 -8.5 -8.4 Per cent change year ago -5.7 -7.4 -8.5 W oodpulp 672.4 650.0 629.9 W oodpulp 930.3 887.3 846.0 Per cent change month ago -3.7 -3.3 -3.1 Per cent change month ago -3.8 -4.6 -4.7 Per cent change year ago -4.0 -8.4 -10.8 Per cent change year ago -3.7 -7.3 -10.9 Non-ferrous metals 171.1 170.2 171.0 Non-ferrous metals 236.7 232.3 229.6 Per cent change month ago -7.8 -0.5 0.5 Per cent change month ago -8.0 -1.9 -1.2 Per cent change year ago -10.5 -13.0 -16.6 Per cent change year ago -10.2 -12.0 -16.7 Copper 5327.9 5532.2 5635.0 Copper 7370.9 7551.4 7568.2 Per cent change month ago -11.2 3.8 1.9 Per cent change month ago -11.3 2.4 0.2 Per cent change year ago -11.4 -11.9 -17.0 Per cent change year ago -11.1 -10.8 -17.1 Aluminium 1571.8 1518.8 1504.0 Aluminium 2174.5 2073.2 2020.0 Per cent change month ago -5.2 -3.4 -1.0 Per cent change month ago -5.3 -4.7 -2.6 Per cent change year ago -7.6 -12.2 -13.8 Per cent change year ago -7.3 -11.1 -13.9 Lead 1406.9 1451.7 1501.8 Lead 1946.4 1981.6 2017.0 Per cent change month ago -15.2 3.2 3.4 Per cent change month ago -15.3 1.8 1.8 Per cent change year ago -18.4 -17.6 -16.0 Per cent change year ago -18.2 -16.6 -16.1 Z inc 1344.2 1403.5 1424.0 Z inc 1859.6 1915.7 1912.5 Per cent change month ago -10.3 4.4 1.5 Per cent change month ago -10.4 3.0 -0.2 Per cent change year ago -21.8 -17.4 -15.7 Per cent change year ago -21.6 -16.4 -15.8 Nickel 13675.8 13098.6 13530.0 Nickel 18919.9 17879.4 18171.7 Per cent change month ago -7.1 -4.2 3.3 Per cent change month ago -7.2 -5.5 1.6 Per cent change year ago -20.7 -22.9 -24.3 Per cent change year ago -20.5 -21.9 -24.5 Iron ore, steel scrap 483.9 454.9 461.0 Iron ore, steel scrap 669.4 620.9 619.2 Per cent change month ago -11.8 -6.0 1.4 Per cent change month ago -11.9 -7.2 -0.3 Per cent change year ago 10.3 1.8 2.2 Per cent change year ago 10.6 3.0 2.0 Energy raw materials 281.0 298.4 299.4 Energy raw materials 388.7 407.4 402.1 Per cent change month ago -1.3 6.2 0.3 Per cent change month ago -1.4 4.8 -1.3 Per cent change year ago 32.7 32.8 24.4 Per cent change year ago 33.1 34.4 24.2 Coking coal 324.5 313.8 314.8 Coking coal 448.9 428.4 422.8 Per cent change month ago -3.5 -3.3 0.3 Per cent change month ago -3.6 -4.6 -1.3 Per cent change year ago 21.2 4.1 -6.9 Per cent change year ago 21.6 5.3 -7.0 Crude oil 279.0 297.7 298.7 Crude oil 386.0 406.4 401.2 Per cent change month ago -1.2 6.7 0.3 Per cent change month ago -1.3 5.3 -1.3 Per cent change year ago 33.3 34.6 26.4 Per cent change year ago 33.7 36.2 26.2 Source : SW EDBANK and HW W A-Institute for Economic Research Hamburg Source : SW EDBANK and HW W A-Institute for Economic Research Hamburg Swedbank Economic Research Department Swedbank’s monthly Energy & Commodities newsletter is published as a service to our customers. We believe that we have used reliable sources and methods in the preparation SE-105 34 Stockholm, Sweden of the analyses reported in this publication. However, we cannot guarantee the accuracy or Phone +46-8-5859 7740 completeness of the report and cannot be held responsible for any error or omission in the ek.sekr@swedbank.se underlying material or its use. Readers are encouraged to base any (investment) decisions www.swedbank.se on other material as well. Neither Swedbank nor its employees may be held responsible for Legally responsible publisher losses or damages, direct or indirect, owing to any errors or omissions in Swedbank’s Cecilia Hermansson, +46-88-5859 7720 monthly Energy & Commodities newsletter. Magnus Alvesson, +46-8-5859 3341 Jörgen Kennemar, +46-8-5859 7730 4