Stornoway AGM Presentation MAy 16 2016
•Download as PPTX, PDF•
1 like•536 views

Presentation by Stornoway at its AGM on May 16, 2016

Recommended
Recommended
More Related Content
What's hot
What's hot (20)
Similar to Stornoway AGM Presentation MAy 16 2016
Similar to Stornoway AGM Presentation MAy 16 2016 (20)
Recently uploaded
Recently uploaded (20)
Stornoway AGM Presentation MAy 16 2016
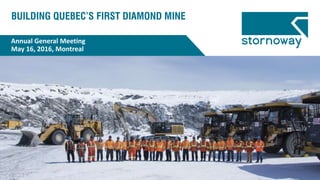
- 1. Annual General Meeting May 16, 2016, Montreal
- 2. Forward Looking Information 2 This presentation contains "forward-looking information" within the meaning of Canadian securities legislation. This information and these statements, referred to herein as “forward-looking statements”, are made as of the date of this presentation and the Corporation does not intend, and does not assume any obligation, to update these forward-looking statements, except as required by law. These forward-looking statements include, among others, statements with respect to our beliefs, plans, objectives, expectations, anticipations, estimates and intentions. Although management considers these assumptions to be reasonable based on information currently available to it, they may prove to be incorrect. Forward-looking statements relate to future events or future performance and reflect current expectations or beliefs regarding future events and include, but are not limited to, statements with respect to: (i) the amount of Mineral Reserves, Mineral Resources and exploration targets; (ii) the amount of future production over any period; (iii) assumptions relating to recovered grade, average ore recovery, internal dilution, mining dilution and other mining parameters set out in the March 2016 Updated Renard Mine Plan and Mineral Reserve Estimate; (iv) assumptions relating to gross revenues, operating cash flow and other revenue metrics set out in the 2016 Updated Renard Mine Plan and Mineral Reserve Estimate; (v) mine expansion potential and expected mine life; (vi) the expected time frames for the completion of construction, start of mining and commercial production at the Renard Diamond Project and the financial obligations or costs incurred by Stornoway in connection with such mine development; (vii) the expected time frames for the completion of the open pit and underground mine at the Renard Diamond Project; (viii) future market prices for rough diamonds; and (ix) future market prices for liquefied natural gas and diesel. All statements, other than statements of historical fact regarding Stornoway or the Renard Diamond Project, are forward-looking statements. Any statements that express or involve discussions with respect to predictions, expectations, beliefs, plans, projections, objectives, assumptions or future events or performance (often, but not always, using words or phrases such as “expects”, “anticipates”, “plans”, “projects”, “estimates”, “assumes”, “intends”, “strategy”, “goals”, “objectives”, “schedule” or variations thereof or stating that certain actions, events or results “may”, “could”, “would”, “might” or “will” be taken, occur or be achieved, or the negative of any of these terms and similar expressions) are not statements of historical fact and may be forward-looking statements. Forward-looking statements are made based upon certain assumptions by Stornoway or its consultants and other important factors that, if untrue, could cause the actual results, performances or achievements of Stornoway to be materially different from future results, performances or achievements expressed or implied by such statements. Such statements and information are based on numerous assumptions regarding present and future business prospects and strategies and the environment in which Stornoway will operate in the future, including the price of diamonds, anticipated costs and Stornoway’s ability to achieve its goals, regulatory developments, development plans, exploration, development and mining activities and commitments. Although management considers its assumptions on such matters to be reasonable based on information currently available to it, they may prove to be incorrect. Certain important assumptions by Stornoway or its consultants in making forward-looking statements include, but are not limited to: (i) required capital investment; (ii) the amount of future production over any period; (iii) assumptions relating to recovered grade, average ore recovery, internal dilution, mining dilution and other mining parameters set out in the March 2016 Updated Renard Mine Plan and Mineral Reserve Estimate ; (iv) assumptions relating to gross revenues, operating cash flow and other revenue metrics set out in the 2016 Updated Renard Mine Plan and Mineral Reserve Estimate ; (v) estimates of net present value; (vi) anticipated timelines for completion of construction, commencement of mine production and development of an open pit and underground mine at the Renard Diamond Project, (vii) anticipated geological formations; (viii) Stornoway’s interpretation of the geological drill data collected and its potential impact on stated Mineral Resources, Mineral Reserves, and mine life; and (ix) Stornoway’s ability to draw on the financing elements of the Renard Diamond Project Financing Transactions closed on July 8th, 2014. By their very nature, forward-looking statements involve inherent risks and uncertainties, both general and specific, and risks exist that estimates, forecasts, projections and other forward-looking statements will not be achieved or that assumptions do not reflect future experience. We caution readers not to place undue reliance on these forward- looking statements as a number of important risk factors could cause the actual outcomes to differ materially from the beliefs, plans, objectives, expectations, anticipations, estimates, assumptions and intentions expressed in such forward-looking statements. These risk factors may be generally stated as the risk that the assumptions and estimates expressed above do not occur, including the assumption in many forward-looking statements that other forward-looking statements will be correct, but specifically include, without limitation: (i) risks relating to variations in the grade, kimberlite lithologies and country rock content within the material identified as Mineral Resources from that predicted; (ii) variations in rates of recovery and breakage; (iii) changes in development or mining plans due to changes in other factors or exploration results; (iv) slower increases in diamond valuations than assumed; (v) risks relating to fluctuations in the Canadian dollar and other currencies relative to the US dollar; (vi) increases in the costs of proposed capital and operating expenditures; (vii) increases in financing costs or adverse changes to the terms of available financing, if any; (viii) tax rates or royalties being greater than assumed; (ix) risks relating to the receipt of regulatory approvals; and (x) the additional risks described in Stornoway's most recently filed Annual Information Form, annual and interim MD&A and Stornoway's anticipation of and success in managing the foregoing risks. Stornoway cautions that the foregoing list of factors that may affect future results is not exhaustive, and new, unforeseeable risks may arise from time to time. Readers are referred to the technical report dated as of March 30, 2016 entitled “Updated Renard Diamond Project Mine Plan and Mineral Reserve Estimate, Québec, Canada” in respect of the March 2016 Updated Mine Plan and Mineral Reserve Estimate, and the technical report dated January 11, 2016 and press release dated September 24, 2015 in respect of the September 2015 Mineral Resource estimate for further details and assumptions relating to the project. The Qualified Persons that prepared the technical reports and press releases that form the basis for the presentation are listed in the Company’s AIF dated March 30, 2016. Disclosure of a scientific or technical nature in this presentation was prepared under the supervision of Patrick Godin, P.Eng. (Québec), Chief Operating Officer and Robin Hopkins, P.Geol. (NT/NU), Vice President, Exploration, both “qualified persons” under NI 43-101. Darrell Farrow, PrSciNat, P.Geo.(BC), Ordre des geologues du Quebec (Special Authorisation # 332) of GeoStrat Consulting Services Inc. is the independent Qualified Person responsible for preparation of the mineral resource estimate for the Renard Diamond Project. GeoStrat Consulting Services Inc, a mineral resources consultancy, focuses on client interaction and involvement in developing resource models, and has experience in exploration, geological modeling, resource evaluation, production, resource reconciliation and accounting of diamond deposits around the globe. GeoStrat has verified the results disclosed herein with respect to the mineral resources, and has conducted appropriate verification on the underlying data, including visitations to the Renard site and the primary process laboratories.
- 3. From the 2015 AGM 3 43 Renard: Québec’s Next Major Mine Fourteen years in the making Diamonds Demand underpinned by gifting traditions that are universal, aspirational and cross-cultural… …but mined: supply is limited and finite Stornoway Focus on budget, schedule, operating excellence, cash flow Stornoway Diamond Corporation (TSX: SWY) Our Priorities www.stornowaydiamonds.com
- 4. Year in Review Matt Manson, President & CEO, Director 4
- 5. A Year of Solid Project Execution 5 Renard Project construction beating schedule & budget 92% complete at end of April, compared to the (initial) plan of 77%. 5 month improvement on forecast date of commercial production, to Dec 31, 2016. C$775m forecast cost to completion, compared to a plan of C$811m. Forecasting excess financing capacity to complete the project of approximately C$116m as of March, 31 2016. Forecasting first diamond production end September.
- 6. KPIs As of Quarter ended March 31, 2016 6 Environment, Health and Safety LTIFR of 0.2 for SWY Employees and 1.5 for Contractors based on 192,321 man hours. 1 environmental non- compliance for SWY, 1 for contractors, project to date. Mining 7,504,923 tonnes mined from R2, R3 and R65 open pits compared to a plan of 7,376,351 tonnes (102%). 194,416 tonnes of ore on stockpile compared to a plan of 207,799 tonnes (94%). 1,218m of ramp development compared to a plan of 1,643m (74%). First Production Guidance March 30, 2016 Updated Mine Plan Diamond Production 0.22 Mcarats in FY2016 and 1.71 Mcarats in FY2017 Diamond Sales 1.36 Mcarats in FY2017
- 7. Capital Structure & Balance Sheet 7 Balance Sheet(2) Cash and Equivalents $219 million Total Debt $255 million Undrawn Financing Commitments(3) $109 million Major Shareholders Investissement Québec, Orion Mine Finance, CDPQ, Blackstone, Franklin Templeton, Boston Partners, Letko Brosseau, FTQ, Platinum Partners, ASA 1. As of May 10, 2016. 2. As of March 31, 2016. Unaudited 3. Assuming a C$:US$ conversion rate of C$1.10. Does not include $48 million Cost Overrun Facility. 4. Fully Diluted Capital Structure Recent Share Price (TSX)(1) $1.00 52 week range $0.65 – $1.08 Market Capitalization(1) $765 million Shares Outstanding 736.5 million Warrants 119.1 million Employee Options 31.7 million 50.2% 38.5% 11.3% Project Finance Sponsors Institutional Retail and Insiders Share Ownership(4)
- 8. Stock Performance 12 Month Performance of Peer Diamond Equities 8 50 100 150 200 250 300 350 Indexto2009=100 US$ May 2011 Renard Sample Valuation Assessments March 2013 March 2014 C$ March 2016 Diamond Price Performance WWW Rough Diamond Price Index, 2004-2016 (RoughPrices.com) -80% -60% -40% -20% 0% 20% 40% 60% 80% 100% SWY LUC MPV DDC FDI GEMD PDL SWY
- 9. Publicly Listed Diamond Producers, Developers and Explorers Consensus Analyst Views on Value Ticker Price (10/5/16) Shares O/S (mm) Market Cap($mm) NAV/sh(1) Current P/NAV(1) Target (1) % Return to Target Annual Dividend Diamond Producers ALROSA ALRS:M ₽72.50 7,365.0 ₽533,960 (n/a) (n/a) ₽83.32 17% ₽1.47/sh Dominion Diamonds DDC:T $14.01 85.1 $1,192.7 $25.24 0.6x $23.24 70% US$0.40/sh Gem GEMD:LN £1.40 138.3 £193.2 £1.97 0.7x £1.67 22% US$0.05/sh Lucara LUC:T $3.97 380.8 $1,511.9 $3.17 1.3x $3.62 -7% $0.06/sh Petra PDL:LN £1.11 512.1 £568.4 £1.71 0.6x £1.47 34% £0.02/sh Diamond Developers Firestone FDI:LN £0.30 309.0 £92.7 £0.48 0.6x £0.41 35% (n/a) Mountain Province MPV:T $5.10 159.7 $814.3 $6.77 0.8x $6.42 26% (n/a) Stornoway SWY:T $1.00 736.6 $736.6 $1.41 0.7x $1.35 35% (n/a) Diamond Explorers Kennady Diamonds KDI:V $3.69 46.3 $170.7 (n/a) (n/a) (n/a) (n/a) (n/a) North Arrow Minerals NAR:V $0.145 54.0 $7.8 (n/a) (n/a) (n/a) (n/a) (n/a) Peregrine Diamonds PGD:T $0.18 339.1 $61.0 (n/a) (n/a) (n/a) (n/a) (n/a) Shore Gold SGF:T $0.195 248.7 $48.5 (n/a) (n/a) (n/a) (n/a) (n/a) 1. Bloomberg and Thomson One Analyst Consensus. All Currencies in C$ unless specified
- 10. Updated Mine Plan Mineral Reserve Case Only, March 30, 2016 10 Notes 1. Estimated average price per carat of the Mineral Reserve in Renards 2, 3, 4 & 65 expressed in March 2016 terms. 2. Expressed in nominal terms, and excluding Renard Mine Road capital of $69.4 million. Initial Capital Cost in the January 2013 Optimization Study was estimated at $793 million based on $752 million of cost and contingency plus $41 million escalation allowance. In April 2014, prior to the commencement of construction, Initial Capital was estimated at $811 million based on $754 million of cost and contingency plus $57 million of escalation. The estimate of $775 million of Initial Capital in the March 2016 Updated Mine Plan includes all costs, contingencies and escalation allowances and represents a reduction of $36 million on the April 2014 estimate. 3. Expressed in real terms. 4. Expressed in real terms. Assumes a 2.5% escalation in diamond prices between 2016 and 2017 and a US$ exchange rate of C$1.35 5. Net of all royalties, costs incurred under the Mecheshoo Agreement (IBA) and the effective revenue impairment associated with the Renard diamond streaming agreement. For further information see the Stornoway AIF dated March 30, 2016. 6. After tax. Reserve and Resource categories are compliant with the "CIM Definition Standards on Mineral Resources and Reserves". Mineral resources that are not mineral reserves do not have demonstrated economic viability. The potential quantity and grade of any Exploration Target (previously referred to as a “Potential Mineral Deposit”) is conceptual in nature, and it is uncertain if further exploration will result in the target being delineated as a mineral resource. 30 Mcarat Indicated Mineral Resource 13 Mcarat Inferred Mineral Resource 33-71 Mcarat TFFE Mineral Resource Estimate Effective September 24, 2015 (NI 43-101) Renard 65 Renard 9 Renard 4 Renard 3Renard 2Reserve Carats (M) 22.3 Processing Rate (Mtonnes/annum) 2.2 to 2.5 Mine Life (years) 14 Average Diamond Production Years 1-10 (Mcarats) 1.8 Average Diamond Price (US$/carat)1 $155 Initial Cap-ex (C$M)2 $775 LOM Cap-ex (C$M)2 $1,045 LOM Op-ex (C$/tonne)3 $56.20 LOM Op-ex (C$/carat)3 $84.37 Gross Revenue (C$M)4 $5,565 Net Revenue (C$M)5 $4,555 Cash Operating Margin (C$M)5,6 $2,677 or 59% NPV7% (C$M, unlevered, effective Jan.1, 2016)5,6 $974 Plant Commissioning Commences Oct. 1 2016 Commercial Production Declared Dec. 31 2016
- 11. Updated Mine Plan Compared to the January 2013 Optimization Study Increased Reserves; Longer Mine Life 24% increase in Probable Mineral Reserves to 22.3 Mcarats (33.4 Mt at 67 cpht); Increase in Mineral Reserve based mine life to 14 years Increased Average Diamond Production; Increased Early Diamond Production Average diamond production in Years 1 to 10 1.8 Mcarats/a compared to 1.6 Mcarats/a previously Guidance of 1.9 Mcarats produced and 1.4 Mcarats sold by end 2017, increases of 24% and 57% resp. Processing Expansion Scheduled increase in processing rate from 2.2 Mt/a (6,000 tpd) to 2.5 Mt/a (7,000 tpd) starting in 2018. Updated Op-ex Estimate based on First Year’s Operating Data LOM average operating costs of $56.20/tonne, or $84.37/carat. Updated Project Valuation, After-Stream, Spot Diamond Price, Spot F/X Real terms cash operating margin of 59% ($120 per carat), after royalties, taxes and stream. Unlevered, stream affected, after tax NPV (7%) of $974 million (real terms, as of January 1st 2016) 11
- 12. Production Profile Mineral Reserve Case Only, March 30, 2016 12 0 1,000,000 2,000,000 3,000,000 4,000,000 2016 2017 2018 2019 2020 2021 2022 2023 2024 2025 2026 2027 2028 2029 2030 Tonnes UG R3 UG R4 UG R2 OP R65 OP R2/R3 0 500,000 1,000,000 1,500,000 2,000,000 2,500,000 2016 2017 2018 2019 2020 2021 2022 2023 2024 2025 2026 2027 2028 2029 2030 Carats R65 R4 R3 CRB CRB2A R2 $0 $200 $400 $600 2016 2017 2018 2019 2020 2021 2022 2023 2024 2025 2026 2027 2028 2029 2030 2031 Gross Revenue (C$ millions) Renard 65 Renard 4 Renard 3 Renard 2
- 13. Life of Mine Revenue From Jan 2013 Optimization Study to March 2016 Updated Mine Plan $5.000 $4.500 $4.000 $3.500 $3.000 $2.500 $2.000 $1.500 $1.000 $500 $0 $800 $773 $260 $574 $1,255 $4,555 Net Revenue (C$ millions) Updated Mine Plan Mar 2016 OS Jan 2013 Stream Impact Spot Diamond Pricing Addition of R65 Addition of R2 to 710m Depth Exchange Rate $4,069 Note: Revenue is net of royalties, marketing costs, and (for the March 2016 Updated Mine Plan) the July 2014 Renard Streaming Agreement
- 14. Capital Cost Estimate Waterfall From November 2011 Feasibility Study to March 2016 Updated Mine Plan 14 $1,045.0 $2.9 $994.4 $18.5 $35.0 $500 $600 $700 $800 $900 $1,000 $1,100 FS Nov 2011 OS Jan 2013 LNG FS Oct 2013 Updated Mine Plan Mar 2016 Current Mar 2016 Renard LOM Capex (C$ millions) Including Contingencies and Escalation $775.4 $61.9 $35.6 $859.1 $1.9 $11.9 $500 $550 $600 $650 $700 $750 $800 $850 $900 FS Nov 2011 OS Jan 2013 LNG FS Oct 2013 Execution Plan Apr 2014 Updated Mine Plan Mar 2016 Current Mar 2016 Renard Initial Capex (C $millions) Including Contingencies and Escalation 11 Year Mine Life 14 Year Mine Life Note: Expressed in December 2015 nominal terms and excluding Renard Mine Road capital of $69.4 million. Totals may not add up due to rounding.
- 15. Note: Expressed in real terms. Payables and cash as of December 31, 2015 are included in 2016 Net FCF Financial Analysis Net Free Cash Flow, After-Tax, After-Steam (C$ million) 15
- 16. Construction Report Patrick Godin, COO, Director 16
- 17. Renard Project Site April 2016 17 R2 & R3 PitCrusher UG Mine Portal R65 Pit Power Plant Process Plant Maintenance Shop Admin/Dry Accommodation
- 18. Health, Safety, Environment, and Stornoway’s Team SWY employees: 0.24 (1 incident in 817,550 hours worked) Contractors: 1.54 (15 incidents in 1,946,300 hours worked) Engineering: 0.00 (0 incidents in 278,495 hours worked) Renard Total: 1.05 (16 incidents in 3,042,345 hours worked) Québec Construction Industry: 0.9 Québec Mining Industry: 1.0 18 “The Courage to Care” On Personal Safety; On the Safety of our Colleagues; On the Environment; With our Inter-Cultural Workforce Lost Time Injury Rate (to the end of April) Route 167: 2 incidents of non-compliance project-to-date (wetland, remediated) Renard Project Site: 0 incidents of non-compliance project-to-date Environment
- 19. Construction Sequence 19 R2-R3 R65 Camp Process Plant Portal 2H 2H 2H 2H1H 1H 1H1H 2013 2014 2015 2016 All in parallel with open pit and underground mining activities 1. Construct Access: Road and Airport 3. Enclose Major Facilities (“Outside-In”) 2. Build Camp and Mine Office/Dry 4. Equip Major Facilities. POV 5. Commence Operations
- 20. Construction Progress to April 30, 2016 20
- 21. Major Facilities Accommodation, Mine Dry/Admin, Maintenance Facility Completed Ahead of Schedule by September 2015 21
- 22. Power Plant The First LNG fueled Power Plant in the Canadian Mining Industry 22
- 23. Processed Kimberlite Containment Dry Stacking Processed Kimberlite 23 Processed Kimberlite Containment (PKC) Ditch Starter Berm Foundation Drains Centrifuges in process plant de-water processed kimberlite (PK)… Primary Crusher, process Plant and PK Loadout connected by covered conveyors producing a cake for re-handling. PK cake is loaded out… as a truckable product… and sent to PKC facility with progressive reclamation.
- 24. Water Management Collecting and Treating 100% of Site Surface Precipitation 24 PKC Waste Rock Overburden UG Mine Portal Process Plant Mine Waste Water Treatment Plant Collection Trench Pumping Station Camp Waste Water Treatment Plant
- 25. Process Plant World’s First Diamond Plant with LDR in Primary Flow Sheet 25 Nameplate capacity of 6,000 tpd (2.16 Mt/a) based on 78% plant utilization. Expansion to 7000 tpd (2.52 MT/a) is scheduled for 2018 based on 83.5% utilization and +2% throughput. Flow sheet: Primary jaw crushing to < 230mm Twin DMS circuits at +1mm -19mm LDR circuit at +19mm -45mm, scalable to -60mm Oversize +45mm to secondary cone crusher LDR and DMS tails +6mm -19mm to tertiary High Pressure Grinding Rolls Centrifugal de-watering of fines and tails for truckable dry- stack disposal. Large Diamond Recovery (“LDR”) through TOMRA XRT.
- 26. Ramp-Up Schedule 26 35,154 82,005 108,000 126,000 135,000 145,801 162,000 171,000 180,000 180,000 180,000 - 20,000 40,000 60,000 80,000 100,000 120,000 140,000 160,000 180,000 200,000 M10-2016 M11-2016 M12-2016 M1-2017 M2-2017 M3-2017 M4-2017 M5-2017 M6-2017 M7-2017 M8-2017 MILLFEED(T) 100% Nameplate Capacity Commercial Production 60% Nameplate Capacity for 30 days
- 27. RENARD 65 RENARD 4 RENARD 9 RENARD 2 RENARD 3 RETURN AIR RAISE FRESH AIR RAISE PORTAL BACKFILL RAISES IN CROWN PILLAR 410L 270L 710L 590L 470L 290L 400L 250L 860L VENTILATION RAISE MAIN RAMP Underground Mining Sequence Mineral Reserve Case Only, March 30, 2016 Combined open pit and underground mining 2015-2018 Open pit R2, R3 2014-2029 Open pit R65 2018-2027 Underground R2, blasthole shrink stoppage with panel retreat 2026-2029 Underground R3, R4, longhole stoping and blasthole stoppage respectively 27 1 4 2 3 6 5 R3 OPEN PIT R2 OPEN PITR65 OPEN PIT Reserve and Resource categories are compliant with the "CIM Definition Standards on Mineral Resources and Reserves". Mineral resources that are not mineral reserves do not have demonstrated economic viability. The potential quantity and grade of any Exploration Target (previously referred to as a “Potential Mineral Deposit”) is conceptual in nature, and it is uncertain if further exploration will result in the target being delineated as a mineral resource.
- 28. Underground Mining Sequence Business Case, Including Inferred Mineral Resources, March 30, 2016 Extension of UG at Renard 2 to 860L (stope 5) Deferral of UG at Renard 3 (stope 6) and its extension to 400L (stope 7) Deferral of UG at Renard 4 (stope 8) and its extension to 410L (stope 9) New UG at Renard 9 to 410L (stopes 10 and 11) Does not include non-resource exploration upside. All pipes open at depth. Does not include mining of Inferred Mineral Resources at Renard 65 below open pit pending confirmation of Renard 65 ROM $/carat. 28 7 9 10 11 R3 OPEN PIT R2 OPEN PITR65 OPEN PIT RETURN AIR RAISE FRESH AIR RAISE PORTAL BACKFILL RAISES IN CROWN PILLAR 410L 270L 710L 590L 470L 290L 400L 250L 860L VENTILATION RAISE MAIN RAMP 5 1 4 2 3 8 6 Reserve and Resource categories are compliant with the "CIM Definition Standards on Mineral Resources and Reserves". Mineral resources that are not mineral reserves do not have demonstrated economic viability. The potential quantity and grade of any Exploration Target (previously referred to as a “Potential Mineral Deposit”) is conceptual in nature, and it is uncertain if further exploration will result in the target being delineated as a mineral resource. RENARD 65 RENARD 4 RENARD 9 RENARD 2 RENARD 3
- 29. Open Pit Mining 29 KPIs to March 31, 2016 Actual Plan % Tonnes Mined, R2-R3/R65 7,504,923 7,376,351 102% Tonnes Ore Stockpiled 194,416 207,799 94% Renard 65 Pit (2014-2029) 14.0 Mtonnes moved, 1.38 Mcarats (4.58 Mtonnes at 30cpht) Stripping ratio (Waste to Ore): 2.11, Depth 155m March 2018 End 2018 End 2019 End 2021 End 2024 End 2027 March 2016 October 2016 Dec. 2016 August 2017 Dec. 2017 April 2018 Renard 2-3 Pit (2015-2018) 15.5 Mtonnes moved, 2.58 Mcarats (4.33 Mtonnes at 59cpht) Stripping ratio (Waste to Ore): 2.54, Depth 130m
- 30. Underground Mine Ramp Development 30 KPIs to March 31, 2016 Actual Plan % Ramp Development (m) 1,218 1,643 74%
- 31. Underground Mine Ramp Development
- 32. Contracting Where we are Spending the Money: 2015 Data 32 Quebec, $324M Ontario, $43M USA, $23M South Africa, $6M Other, $4M C$400 million of expenses incurred at Renard in 2015 C$324 million of expenses incurred in Québec in 2015 Mistissini and Eeyou Istchee, $64M Chiboug. & Chapais, $31M Abitibi- Temiscamingue, $53M Other, $39M Chaudiere Appalaches, $28M Bas St- Laurent, $21M Montreal- Laval, $74M Saguenay Lac St-Jean, $14M Contractors at Mine Site in 2015 Construction Talbon Matoush-Grimard Groupe Promec Manseau & Perron inc MY Surveying Equ. Pétrolier Lac St-Jean Sakhiikan Consortium Kesi Construction Construction Proco Eskan Company RCM Habitation Modulaire Air Creebec Jos Ste-Croix Swallow-Fournier inc Petronor Kiskinshiish Camp Services Tessier Ltée Dyno Nobel Canada Communications Telesignal Propane Nord-Ouest Groupe Robert Structures GB Ltée Prevost et Frères Mabarex H2O Innovation Nordic Structures Bois Hewitt Anixter Canada Recyclage Ungava Corner Cast Plomberie Chibougamau Sanivac Réseau Revetement RHR Crevier Chiiwetin Industrie Blais Groupe Industriel Premium Convoyeur Continental ASDR Environnement Mansour Mining Techno. Installations AC Washeyaabiin Const. PAR Tanguay (WEC) Industrie Fournier Biron SNC-Lavalin Yves Lacombe Pétrole MJ Golder Lafleur Portes de Garage Moreau Électrique BBA Protection Incendie Viking Moteur du cuivre/DLB Metallisation du Nord
- 33. Monthly Manpower at Site to April 30, 2016 Stornoway Employees and Contractors at Renard 33
- 34. 34 Origin of Renard’s Workforce Targeting Local Hiring: Stornoway Employees at Mine Site, April 30, 2016 Data 11 19 27 40 41 49 8 19 58 5 43 0 10 20 30 40 50 60 Other Communities (CA) Other Communities (QC) Quebec Saguenay Lac-St-Jean Montreal Abitibi-Témiscamingue Other Communities NQ Chapais Chibougamau Other Cree Communities Mistissini 42% Northern Quebec 55% Other Quebec 3% Other Canada
- 35. 82% 14% 1% 1% 2% April 2016 (395 employees) 75% 20% 1% 2% 2% Sept. 2015 (290 employees) RENARD LONGUEUIL CHIB/MIST TORONTO VANCOUVER 35 Growing a Company Stornoway Payroll, September 2014 to April 2016 34% 44% 6% 7% 9% Sept. 2014 (68 employees)
- 36. Targeted Contracting for Small and Local Suppliers Stornoway emphasises local hiring and procurement, with contracts tailored for local businesses. Stornoway prioritizes, wherever possible, hiring and contracting in the Cree communities of Eeyou Itschee, particularly Mistissini, and with the families of Sydney Swallow (Kiskinshiish Camp Services) and Emerson Swallow (Swallow-Fournier), Tallymen for the Renard area. In 2015 Stornoway purchased $95 million in goods and services from Mistissini, Chibougamau and Chapais, and estimates $8 million in payroll added to the local economy. 36 169 134 50 Numbers of Contracts for Goods and Services in Québec 2015 Data 10-99K$ 100-999K$ 1M$+
- 37. Communities Stornoway is committed to fostering a positive relationship with its communities. 37 In addition to employment and business development opportunities, Stornoway aims to foster educational and training development in youth, respect for traditional activities, two-way communication with community representatives on project impacts, and support for local charitable organisations. Stornoway undertakes regular communication with our employees at site, and communicates more formally through community committees such as the Renard Committee, the Environment Committee, the Training & Employment Committee, and the Comité de Liaison Renard. Our annual Sustainable Development Report is delivered to each household in the region. Stornoway’s commitments are laid out in our 2012 Mecheshoo Agreement with the Cree Nation of Mistissini and the Grand Council of the Crees (EI), and our 2012 Declaration of Partnership with Chibougamau and Chapais.
- 38. Community Engagements 38 Centraide/SWY Golf Tournament Mistissini Open Door Mining Matters activity day Cree Youth at Quebec Mines ExpoCree Training Programs Cree Career Fair Site Visits On-site Cultural Activities
- 39. Looking Forward Matt Manson, President & CEO, Director 39
- 40. Areas of Focus 40 Finality (it’s not over until it’s over) Mining: now on the critical path Stakeholder expectations Full resource reconciliation Employment market: Lack of trained miners Opportunities Construction pace and performance Operating environment Large Diamonds Renard Resource Upside Growth: Exploration and M&A
- 41. 0 20 40 60 80 100 120 140 160 180 Resource Growth at Renard 41 0 50 100 150 200 2004 2006 2008 2009 2011 2013 2015 MillionsofTonnes Resource Growth, 2004-2015 0m 100m 200m 400m 900m 700m 500m 300m 800m 600m 1100m 1200m 1000m Mine Plan: 14 years of mining on 22mcarat Mineral Reserve (33mtonnes) Permitting and Long Term Plan The Vision: Deposit still Open Millions of Tonnes Grades illustrated are for Indicated and Inferred Mineral Resources respectively at a +1DTC sieve size cut-off. Reserve and Resource categories are compliant with the "CIM Definition Standards on Mineral Resources and Reserves". Mineral resources that are not mineral reserves do not have demonstrated economic viability. The potential quantity and grade of any Exploration Target (previously referred to as a “Potential Mineral Deposit”) is conceptual in nature, and it is uncertain if further exploration will result in the target being delineated as a mineral resource. 30 Mcarat Indicated Mineral Resource 13 Mcarat Inferred Mineral Resource 33-71 Mcarat TFFE Mineral Resource Estimate Effective September 24, 2015 (NI 43-101) Renard 65 24/29cpht Renard 9 53cpht Renard 4 61/52cpht Renard 3 102/112cpht Renard 2 84/59cpht TFFE High Range Inferred Mineral Resource TFFE Low Range Indicated Mineral Resource Conceptual R7 R1 R65 R4 R9 R2 R3 R10
- 42. Resource Reconciliation Step 1: Reconcile actual pipe geology with geological model (Successful example from Renard 3 on 490m level shown opposite) Step 2: Reconcile grade (to come upon processing start-up) Step 3: Reconcile size distribution and plant recovery characteristics (to come upon processing start-up) Step 4: Reconcile quality assortment and value (to come upon sorting and sale) 42 Renard 3: Level 490 Mine Geology Kimb3i Kimb3f Kimb3dg Kimb3b Kimb3h CRB Kimb3c Thin lines are the 2015 geological model Thick lines are actual mine geology Renard 3: Level 490 Mine Geology Renard 2 Renard 3
- 43. Large Diamonds at Renard The Renard Diamond Process Plant will be the first plant in the world to have LDR capacity in the primary flow sheet. Large Diamond Recovery (“LDR”) through TOMRA XRT. High Quality Production with Large Stone Potential Distribution in Renard 2 predicts three to six 50-100ct stones and one to two +100ct stones every 100,000 carats. Base Case Diamond Valuation Estimates Using on Best Practice Methodology Average diamond price estimate in March 2016 for the Mineral Reserves at US$155/ct (un-escalated). Substantial revenue potential from large diamonds not accounted for in the base case cash-flow model. 43 1000T storage bin with overflow to stockpileRe-load hopper HPGR Cone crusher Scrubber and screening Process office and MCC’s DMSPK mixer Centrifuge Air compressors Thickening Wet screening Cold storage Dry screening Process Water
- 44. Diamond Sales Stornoway will sell 100% of the Renard diamond production by tender sale in Antwerp on an undivided basis. Stornoway has engaged well known diamond industry broker and rough distributor Bonas-Couzyn as sales commissionaire and tender agent for arm's length market sales. Other than under exceptional circumstances, Stornoway will sell 100% of what it produces, will not carry a stockpile outside of normal goods-in-progress, and will be a market price taker. Stornoway will support the Québec or Canadian brand identification initiatives of its clients through chain of custody certification. First sales are expected in January 2017. 44
- 45. Exploration & Adamantin Stornoway maintains an active diamond exploration team and conducts 100% owned generative programs. Recent drilling at Adamantin Project returned kimberlite in 18 of 78 holes testing 72 geophysical targets interpreted as 11 discrete kimberlite bodies. Intersections of undiluted (100%) HK up to 13.7m and mixed HK/country rock up to 22.9m. AD50/51/52 interpreted as one body dipping 5-10 degrees with a true thickness of 10m, over a 260m strike extent, open, 6-12m below surface (illustrated). Sampled for diamond content. One diamond recovered in till in 2015 sampling. 45 AD-50 AD-51 AD-52 AD-52-03 AD-52-01 AD-52-02 SW NE 6-8 m from surface 9.8 m AD-50-01 AD-50-02 9-10 m from surface 9.8 m SW NE AD-50 AD-51 AD-52 AD-50 AD-52
- 46. 12 Month Outlook and Priorities A Safe and Protected Workplace and Environment Project Completion on Budget and Schedule Resource Reconciliation First Québec Diamond Sales January 2017 Achieving March 2016 Mine Plan Guidance 0.22 Mcarats Produced in FY2016 and 1.71 Mcarats in FY2017 1.36 Mcarats Sold in FY2017 Operating and Sustaining Capital Costs Maintain Balance Sheet Strength 46
- 47. Merci, Thank You, Meegwetch Questions