SlideShare a Scribd company logo
1 of 37
Download to read offline
Political Influence in Transition Economies:
Firm Level Evidence
Raj M. Desai∗
Anders Olofsgard†
This version: April 2009
Abstract
Arrangements by which influential firms receive economic favors, has
been documented in numerous case studies but rarely formalized or an-
alyzed quantitatively. We offer a formal voting model in which political
influence is modeled as a contract by which politicians deliver a more pref-
erential business environment to favored firms who, in exchange, protect
politicians from the political consequences of high unemployment. From
this perspective, cronyism simultaneously lowers a firm’s fixed costs while
raising its variable wage costs. Testing several of the implications of the
model on firm-level data from 26 transition countries, we find that more
influential firms face fewer administrative and regulatory obstacles and
carry bloated payrolls, but they also invest and innovate less. These re-
sults do not change when using propensity-score matching to adjust for
the fact that influence is not randomly assigned.
∗Address: School of Foreign Service, Georgetown University, and the Wolfensohn Center
for Development, Brookings Institution. E-mail: desair@georgetown.edu.
†Address: The Economics Department and School of Foreign Service, Georgetown Univer-
sity, and SITE, Stockholm School of Economics. E-mail: afo2@georgetown.edu.
1
1 Introduction
The countries of the former Soviet Union and Eastern and Central Europe have
come a long way since the onset of the transition from communism. Progress,
though clearly uneven, has been evident in both the economic and political
spheres in most countries. As part of this, the extent of state intervention in
markets has been scaled down, as witnessed by the often rapid pace of pri-
vatization during the 1990’s (e.g. Roland 2000, Shleifer and Triesman 2000).
However, privatization hasn’t necessarily implied a severance of ties between po-
litical elites and commercial interests, and recent events, in particular in Russia,
suggest that state intervention may actually be increasing.
The existing literature has offered several different descriptive (non-formal)
models of the modes and motivations for state intervention during transition.
The “Grabbing hand” model (e.g. Frye and Shleifer 1997) emphasizes that bu-
reaucrats and politicians prey on vulnerable private firms threatening retaliation
unless bribes are paid or other political benefits delivered. The “State capture”
model (e.g. Hellman et al. 2003, Slinko et al. 2005). has instead focused on
the ability of powerful private interests to capture the legislative process, and
its implementation, in order to generate select benefits to a narrow economic
elite at the cost of the rest of society. Finally, the “Elite exchange” model (e.g.
Frye 2002, Stoner-Weiss 2006) suggests a middle way, in which political elites
offer economic elites a favorable business environment in exchange for political
benefits.
In this paper we develop a formal model of an elite exchange and then
test the predictions of the model on firm-level data across 26 countries in the
former Soviet Union and Eastern and Central Europe. Our model features an
election in which politicians differ in their ability to mitigate the macroeconomic
consequences of economic shocks. In particular, a political incumbent may
find she is unable to prevent substantial job destruction in times of a crisis.
Letting this play out may be political costly, though, if voters associate high
unemployment with incompetence. It follows that the incumbent will have
incentives to boost employment levels through hidden means in order to conceal
her inability. This is achieved in our model through an “influence contract”
whereby a firm employs extra labor in exchange for special privileges or favors.
Our theoretical contribution is twofold. We suggest a specific channel (em-
ployment) through which politicians benefit from engaging in cronyism, and we
offer an explanation for the political salience of employment, something that is
typically just assumed (e.g. Shleifer and Vishny, 1994). Additionally, we high-
light a mechanism by which the exchange of favors between firms and politicians
affects firm productivity. In the corridors of some economic ministries, cronyism
is occasionally defended as a crude form of industrial policy that boosts enter-
prise performance. We demonstrate, however, that where cronyism lowers the
fixed costs of doing business, the incentives for firms to innovate and invest may
be diluted, if the firms, in exchange for lowered administrative and regulatory
barriers, face higher variable costs from a bloated payroll.
Our framework suggests three separate but connected implications for po-
2
litically influential firms; they should encounter fewer administrative and reg-
ulatory burdens; they should carry excess labor; and they should invest and
innovate less and be less productive. We test these predictions using firm-level
data from the World Bank’s Enterprise Surveys. We find that politically influ-
ential firms do indeed face a more favorable business environment than their
non-influential counterparts. Influential firms also tend to carry bloated pay-
rolls. Influential firms, finally, are also less likely to open new product lines
or production facilities, or to close obsolete ones, and they report lower real
growth in sales, less spending on research and development and generally lower
productivity. These results hold up to different specifications of our empirical
model, including propensity-score matching to adjust for the fact that influence
is not randomly assigned. Overall, the evidence overwhelmingly suggest that
influence hurts rather than help firm productivity, implying that politically con-
nected firms face a trade-off between short run profits and long run viability.
This also suggests that these selective favors hurt welfare not only by under-
mining competitiveness of non-influential firms, but also by distorting long run
incentives of the influential firms.
Our model emphasizes the political benefit of high employment levels. That
unemployment carries a potential political prize is true for democracies across
the world, but there are also reasons why this should be particularly true in the
countries we consider. First of all, a cornerstone of the communist economic
policy was full employment. Secondly, in the communist system, firms often
provided not only a salary, but also housing, day care, schools, health care and
other utilities. In the absence of publicly provided social safety nets, loosing
ones job therefore typically had very dramatic consequences.
The political importance of employment is also backed up by both theoretical
and empirical research, some of it specifically looking at transition economies.
Shleifer and Vishny (1994) argue that influential firms receiving public subsidies,
in return, would cede part of their control rights over employment decisions to
politicians benefiting politically from low unemployment rates. Robinson and
Verdier (2002) also emphasize the political benefit of having control over em-
ployment decisions. They argue that politicians can create political support
groups by selective job offers that are contingent on the regime’s survival. As
long as these jobs pay better than the market rate, these groups have a joint
stake in keeping the current regime in power. Choi and Thum (2007) offer a sim-
ilar model in which politicians offer selected firms economic benefits, while the
firms in exchange invest in some generic way in stabilizing the regime. Mach
and Jackson (2006), looking at voting behavior in Polish elections, find that
the total level of job creation within voters’ regions is a very strong predictor
of support for a reform agenda (stronger than the voters’ individual employ-
ment status). Fidrmuc (2000a, 2000b), looking at a cross-section of transition
economies, finds that there is persistence in the levels of support for different
parties, but that support is based primarily on the delivered level of employ-
ment, in particular among swing voters. Finally, Bertrand et all (2004), looking
at the case of France, find that politically connected business leaders generate
"re-election favors" to incumbent politicians by creating more jobs, in particular
3
in politically more contested areas and around election years.
Our paper also ties into a broader literature on the causes and consequences
of political connections among firms. In the US, for example, the political weight
of firms and industries using campaign finance, political action committees, and
the “revolving door” between lobbying firms and congressional staff offices has
been extensively examined (e.g. Agrawal and Knoeber 2001; Ang and Boyer
2000, Krozner and Stratmann 1998). An analysis of the benefits to firms from
the seniority system in the US Senate showed that the sudden death of Senator
Henry “Scoop” Jackson in 1983 lead to an abnormal drop in stock prices of
firms contributing to his re-election campaign (Roberts, 1990). At the same
time, firms connected to his successor as ranking member of the Senate Armed
Services Committee, Senator Sam Nunn, benefited from an unexpected rise in
stock prices. Similarly, in Brazil, Claessens, Feijen, and Laeven (2007) found
that firms that provided contributions to (elected) federal deputies experienced
higher stock returns around election years.
In other developing nations, political influence is usually obtained through
a combination of kinship ties, political alliances, ethnic solidarity, or financial
dealings between owners and political elites. Fisman (2001) showed that firms
connected to the Suharto family in Indonesia experienced a negative shock to
their stock values when rumors circulated that Suharto was experiencing seri-
ous health problems. Similar rewards have also been documented for Malaysia
(Johnson and Mitton 2003), and Pakistan, where Khwaja and Mian (2005) esti-
mate that the cost of politically-motivated lending amounts to 0.3 to 1.9 percent
of GDP. Faccio (2006) found that the phenomenon of current and former control-
ling shareholders holding seats in legislatures or positions in national government
is not confined to the developing world; in OECD countries politically-connected
firms often represent significant portions of market capitalization.
The paper is organized as follows. In Section 2 we present our model, and in
Section 3 we characterize a partially pooling equilibrium of the game. In Section
4 we present the data and the empirical strategy. In Section 5 we present our
results, and we conclude in Section 6.
2 The Model
We develop a simple two-period private information voting model with three
sets of players; politicians, firms and voters. There is a continuum of firms of
measure one. The firms operate in different markets and they face the following
downward sloping inverse demand curves
p(y) = φ − y. (1)
Peak demand, φ, depends on an exogenous factor ψ ∈ {d, D} (world market
conditions), where d < D, as well as the ability of the incumbent government to
deal with unfavorable market conditions at the macro level. This competence
is not necessarily known by the incumbent ex ante, but is revealed to him
when trying to handle the unfavorable market conditions. What is important
4
for our argument, though, is that voters interpret the handling of the current
crisis as a signal of the incumbent’s ability to handle a future crisis. That
is, at least in the perception of the voters, there is an element of competence
in governing the economy, and this competence is correlated over time. To
keep the analysis simple, we assume that there are two levels of competence,
λ ∈ {δ (less competent), 1 (more competent)} where δ < 1, and that individual
competence doesn’t change over time. Overall peak demand is
φ =
½
D if ψ = D
dλ if ψ = d
(2)
The probability that ψ = d is given by η ∈ (0, 1) in both periods.
We assume a simple production technology in which output depends linearly
on the input of labour (l), and the productivity of the technology.
y =
l
γ
(3)
The unit labor cost is assumed to be fixed and given by w. Firms start out
with a given technology, but they have the option to upgrade by making an
investment. The investment decision is given by γ, and γ ∈ {1, ˜γ} where ˜γ < 1
corresponds to the upgraded technology. To make the investment is costly, and
the firm specific cost is given by kj, where subscript j denotes the particular
firm. The distribution of investment costs is assumed to be uniform with full
support between
£
0, ¯k
¤
. This investment can be thought of as a new production
technology, the opening of a new plant, or the switching of production to a new
product line for which labour is more productive.
In addition the firms also face a fixed administrative and regulatory cost
of doing business, corresponding to the costs associated with onerous start-
up procedures and other barriers, delays in being granted licenses and permits,
corruption or harassment by police or inspectors, and other methods potentially
used by public officials to extract rents from businesses.1
This cost is set to
c ∈ [0, ¯c], and it depends on government action and may vary across different
firms.
Voters care about consumption. We abstract from saving and borrowing, so
utility depends only on current income. Income, in turn, is earned through an
inelastic supply of labor in case of employment, while income is normalized to
zero in case of unemployment. A voter’s expected income thus depends on the
probability of her holding a job (since wages are fixed), something we assume to
1 Since 2004, the World Bank has benchmarked these costs in its annual series of Doing
Business reports.
5
depend on the total demand for labor in the economy, given by L.2
To capture
other dimensions of voting behavior, we also include a valence characteristic
capturing ideology, or charisma, into voters’ preferences. That is, we use a
probabilistic voting model in which we assume that each voter’s relative prefer-
ence for the current incumbent also depends on an individual specific term, bi,
distributed across the population according to a uniform density function f (b)
with support on [−1, 1], and a common factor, z, drawn from a uniform distri-
bution g (z) with support on
£
−1
2 , 1
2
¤
. This yields the following specification of
a voter’s utility of retaining the current incumbent
u (L2 (·)) + bi + z, (4)
where L2 (·) is the actual (ex post) aggregate level of employment in period 2.
As mentioned above, politicians can be of two types, λ ∈ {1, δ}, differing in
their ability to keep up demand in the presence of a negative economic shock. We
assume that all politicians are drawn from a common pool, with the probability
p of getting λ = 1. Politicians care about the rents from being in office, R.
These rents are assumed to be increasing with the total fixed costs of doing
business, denoted by C, i.e. R(C) with R0
(C) > 0 and R00
(C) < 0. There are
two ways to motivate this assumption. The first interpretation is to think of
the costs of doing business as being the costs of bribes, something that directly
benefits the politician. The second interpretation is that providing high quality
public services and properly regulated markets requires effort, time and funds on
behalf of the government, all which have an opportunity cost. The preferences
of the political incumbent can therefore be represented by
R (C1) + μ (·) R (C2) , (5)
where subscripts stand for periods 1 and 2, and μ (·) is the endogenously de-
termined probability of getting reelected. To simplify the model, we also follow
2 We implicitly assume that the number of capital owners is small enough relative to the
number of workers in order to disregard the capital owners’ votes when calculating the outcome
of the elections. Think of a small number of capital owners each controlling a fraction of the
measure of firms and employing a large number of workers.
6
the assumption of Besley and Burgess (2002) and assume that more compe-
tent politicians do not act strategically, which in this case implies that they
always set c = ¯c for all firms. This means that we are exclusively focusing
on the incentives of the less competent politician to mimic the behavior of the
more competent type, disregarding the incentives of the more competent type
to separate himself. Note though, that incorporating those incentives would
not alter the main result of the model. It would only imply that there may
also exist separating equilibria in which it is the more competent, rather than
the less competent, type that boosts employment levels to increase her chances
of reelection. One can thus think of this assumption as an admittedly ad hoc
argument of equilibrium selection in a more general model that can have also a
separating equilibrium.
There are several sources of incomplete information in the model. The in-
cumbent government does not know the realization of the common shock to the
preferences of the voting population. It follows that the government faces uncer-
tainty with respect to the mapping between its actions and the outcome of the
election, it only knows in which direction an action influences its probability of
winning. More importantly, though, the incumbent government’s type is private
information. Voters can only observe the realization of ψ and the aggregate em-
ployment level, L. This would be enough, though, to tell the type if the govern-
ment had no ability to affect firms’ employment decisions, since firms’ optimal
employment levels will depend on aggregate demand which, in turn, depends on
ψ and λ. However, a key assumption in the model is that the government can
offer a subset (Γ) of firms a lower fixed cost of doing business, i.e. cj < ¯c, in ex-
change for the firm carrying a larger than optimal workforce. More specifically,
we assume that these firms have to carry an additional workforce proportional
to their optimal level of employees. That is, if l∗
is the optimal workforce when
managers have all the control rights, then these firms need to employ (1 + αj) l∗
,
where αj > 0. We think of this deal as an "influence contract" where the firms’
costs of additional employees are compensated for by a lower burden of regula-
7
tion, better provision of public services, and lower levels of required bribes.3
The
more firms that are under this contract, the higher is the level of employment.
If these contracts are unobservable by voters, then less competent governments
will have incentives to use this tool to mimic the outcome of more competent
governments, and thereby increase their chances of reelection. We follow the
assumptions of Besley and Burgess (2002) that only a share of the voters ob-
serve the employment level. These voters will update their beliefs according to
˜p = 0 whenever L (·) 6= L (λ = 1). We also assume that the size of informed
voters is increasing as the gap between the current employment level, and that
expected from a more competent politician is increasing.4
To be more spe-
cific, we assume that the share of informed voters is σ (L (λ = 1) − L (·)), where
L (λ = 1) is the employment level expected when a more competent politician
is in office, while L (·) is the observed employment level. We also assume that
σ (· | L (·) ≤ L (λ = δ, C = ¯c)) = 1, σ (· | L (·) ≥ L (λ = 1)) = 0, ∂σ(·)
∂L(·) ≤ 0, and
that ∂2
σ(·)
∂2L(·) ≥ 0. Note that the share of informed voters is equal to zero when
L (·) = L (λ = 1), so we do not need to specify expectations of informed voters
in this case. However, we need to specify that uninformed voters base their
decisions on their priors, so ˜p = p in this case.
The politician’s strategy is thus a vector, {Γ, αj, cj}. In principle a certain
level of employment can be achieved through many variations of the number of
influential firms and the extra labor requirement, giving rise to many potential
equilibria. We do assume, though, that there is a fixed cost for the politician of
writing a contract, and that this cost is high enough to make the politician prefer
to sign contracts with as few firms as possible. It follows that the contracts will
maximize employment within each firm, which is achieved by setting c = 0 (the
lower bound).
The timing of events is as follows. In the beginning of period 1, nature
draws the demand for the firms’ products, ψ ∈ {D, d}. If ψ = d, then the
3 We are giving the government all the bargaining power here, but in priciple one could
think of a bargaining game between the firms and the government determining the allocation
of the common surplus from the deal. This would not change any of the results, though.
4 This can be motivated by the increased publicity given to unemployment figures when
they are perceived as high relative to expectations.
8
incumbent, and only the incumbent, observes his ability to deal with the shock,
and based on that determines the terms and coverage of eventual influence
contracts, {Γ, αj, cj}. After that firms decide whether to make the investment
in the new technology or not, and how much labour to employ and how much to
produce,
©
yj, γj.lj
ª
. Informed voters then update their beliefs about the type
of the incumbent based on ψ and L, and cast their vote sincerely. In the second
period there is no election, so only the first three events are repeated before
utility is realized. We solve the game for a perfect Bayesian equilibrium.
3 A Partially Pooling Equilibrium
In this section we characterize an equilibrium of the game in which a less compe-
tent period 1 incumbent offer influence-contracts to reduce the unemployment
level and thereby increase his chances of reelection. The case we focus on is
thus the one in which ψ1 = d and λ1 = δ. We refer to this equilibrium as
partially pooling since, following our assumptions of voters’ information, the
less competent type will not necessarily fully mimic the employment level of the
more competent type. Before defining an equilibrium, the following notation is
introduced to simplify the exposition.
π∆ (˜γ, ψ, λ) ≡
(φt − ˜γw)
2
4
−
(φt − w)
2
4
(6)
U∆ (δ | d) ≡ U (L (d, 1)) − U (L (d, δ)) (7)
Equation 6 defines the increase in variable profits (short of the investment cost)
from making the investment, i.e. the benefit of the higher productivity. Equa-
tion 7 defines the gain in utility from having a more rather than less competent
politician when ψ = d.
Definition. There exists a partially pooling perfect Bayesian equilibrium with
the following strategies and beliefs if ˜γ ≥ φt
2w .
9
i) Firms maximize their profits by setting
l∗
jt = (1 + αjt) γjt
³
φt−γjtw
2
´
y∗
jt = (1 + αjt)
³
φt−γjtw
2
´
γ∗
jt =
⎧
⎨
⎩
1 if kj >
³
1 − (αjt)
2
´
π∆ (˜γ, ψ, λ)
˜γ if kj ≤
³
1 − (αjt)
2
´
π∆ (˜γ, ψ, λ)
ii) The politicians choose their policy vectors according to
α∗
jt =
⎧
⎨
⎩
2
√
¯c
(φt−γjtw)
if j ∈ Γt
0 otherwise
c∗
jt =
⎧
⎨
⎩
0 if j ∈ Γt
¯c otherwise
Γ∗
=
⎧
⎪⎨
⎪⎩
arg max
Γ
R ((1 − Γ) ¯c) +
¡1
2 − ηpU∆ (δ | d) σ (L (1) − L (· | δ))
¢
R (¯c) if t = 1
∅ if t = 2
iii) Voters vote to reelect the incumbent iff
bi ≥ ηpU∆ (δ | d) − z if informed
bi ≥ −z if uninformed
iv) The voters update their beliefs according to
˜p =
⎧
⎨
⎩
0 if L (·) 6= L (λ = 1) is observed
p otherwise
To see why this is an equilibrium, we solve the model by backward induction.
The purpose of the influence contracts is to boost employment prior to elections.
There are no elections in period 2, so irrespective of the type of government,
the share of firms offered influence contracts (Γ) is set to zero, and c∗
j2 = ¯c and
α∗
j2 = 0 ∀ j.
The firms’ cost functions are given by
wγjtyjt + cjt + kj, (8)
10
where kj = 0 if γj = 1. A firm’s optimal quantity and labour input are therefore
given by the following maximization
Max
yjt
(φt − yjt) yjt − wγjtyjt − cjt − kj. (9)
This yields the following results for period 2
y∗
j2 =
(φ2−γj2w)
2 , l∗
j2 =
γj2(φ2−γj2w)
2
π∗
j2 =
(φ2−γj2w)2
4 − ¯c − kj
. (10)
What can be noted from these results are that the expected quantities produced
as well as the expected level of employment, and thereby consumer utility, de-
pend on the type of the politician through its impact on φ. This is what drives
forward-looking voters in period 1 to condition their voting behavior on their
perceptions of the type of the period 1 incumbent.
A firm will choose to invest in period 2 if the productivity gains from doing
so exceed the direct costs. This condition is given by
(φ2 − ˜γw)
2
4
− ¯c − kj ≥
(φt − w)
2
4
− ¯c. (11)
Solving for kj and using the definition in equation (6) yields
kj ≤ ˜k (λ) = π∆ (˜γ, ψ, λ) (12)
There are two groups of voters in period 1, informed and uninformed. In-
formed voters observe the actual employment level and realize that any L (·) 6=
L (λ = 1) implies that the incumbent must be less competent, so updated be-
liefs are given by ˜p = 0. Based on these beliefs, the informed voters will vote
on the candidate that yields them the highest expected utility in period 2. An
informed voter will vote to reelect the current incumbent if and only if
(1 − η) u (L (D)) + ηu (L (d, δ)) + bi + z (13)
≥ (1 − η) u (L (D)) + η (pu (L (d, 1)) + (1 − p) u (L (d, δ))) .
This can be simplified as
bi ≥ ηpU∆ (δ | d) − z, (14)
11
where U∆ (δ | d) is defined in equation (7). It follows that the share of informed
voters supporting the current incumbent is given by5
1 − ηpU∆ (δ | d) + z
2
(15)
Uninformed voters do not have any information on which to update their
beliefs about the period 1 incumbent, so the incumbent and the opponent are
expected to generate the same level of employment in period 2. The uninformed
will thus base their voting only on the valence characteristics. The share of
uninformed voters that support the less competent incumbent is therefore
1 + z
2
. (16)
The total support is thus
σ (L (λ = 1) − L (·))
1 − ηpU∆ (δ | d) + z
2
+ (1 − σ (L (λ = 1) − L (·)))
1 + z
2
,
(17)
which can be simplified as
1 + z
2
− σ (L (λ = 1) − L (·))
ηpU∆ (δ | d)
2
. (18)
The probability that the incumbent wins the election is then given by the prob-
ability that this vote share is greater than 1/2, which is
μ (·) =
1
2
− σ (L (λ = 1) − L (·)) ηpU∆ (δ | d) . (19)
Note that the probability of winning the election is increasing in L (·).
Firms maximize profits based on the constraints they face. Firms that are
not bounded by an influence contract will solve the same problem as all firms
face in period 2. This yields the same outcomes as shown in equation (10),
except that φ2 can be replaced by δd. Firms bounded by an influence contract
benefit from zero fixed costs of doing business, but on the other hand have to
5 We do throughout assume that parameter values are such that any expressions of proba-
bilities fall within the open set (0, 1), i.e. that ηpU∆ (δ | d) < 1
2
.
12
take on a suboptimal number of employees. Profit maximization yields
y∗
j1 = (1 + α)
(δd−γj1w)
2 , l∗
j1 = (1 + α)
γj1(δd−γj1w)
2
π∗
j2 =
³
1 − (α)2
´
(δd−γj1w)2
4 − kj
, (20)
and firm j will invest if
kj ≤ ˜k (α, λ) =
³
1 − (αjt)
2
´
π∆ (˜γ, d, δ) . (21)
Equation (21), in comparison with equation (12) yields the main result of the
model: ˜k (α, λ) < ˜k (λ), i.e. a randomly drawn influential firm is less likely to
make an investment than a non-influential firm.
The period 1 incumbent sets {αj1, cj1, Γ1} to maximize his expected utility,
as given by period 1 rents plus the probability that he wins the elections times
period 2 rents. The assumption that there is a high cost of writing a contract
implies that cj = 0 ∀j ∈ Γ1, whereas cj = ¯c ∀j /∈ Γ1. The incumbent will then
set αj for influential firms such that they just accept the contract, i.e. such that
they are just as well off with as without a contract. This implies that
³
1 − (αj)
2
´ ¡
δd − γj1w
¢2
4
− kj =
¡
δd − γj1w
¢2
4
− kj − ¯c. (22)
Solving for αj yields
αj1 =
⎧
⎨
⎩
2
√
¯c
(δd−γj1w)
∀j ∈ Γ1
0 ∀j /∈ Γ1
(23)
Finally, the incumbent sets Γ to trade off the period 1 losses from a larger share
of influential firms against the gains from an increased probability of reelection.
arg max
Γ
R ((1 − Γ) ¯c)+
µ
1
2
− ηpU∆ (δ | d) σ (L (λ = 1) − L (α1j, Γ | λ = δ))
¶
R (¯c)
(24)
Following the previous assumptions, what remains to guarantee the existence of
a unique max-point is to show that total employment in period 1, L (α1j, Γ | λ = δ),
is weakly increasing in Γ and that U∆ (δ | d) > 0. Total employment in period
13
1 is given by
L = Γ
"˜k(α,λ)R
0
(1 + α)
˜γ (δd − ˜γw)
2
f (k) dk +
¯kR
˜k(α,λ)
(1 + α)
(δd − w)
2
f (k) dk
#
+ (1 − Γ)
"˜k(λ)R
0
˜γ (δd − ˜γw)
2
f (k) dk +
¯kR
˜k(λ)
(δd − w)
2
f (k) dk
#
(25)
This expression is increasing in Γ as long as the first bracket, representing em-
ployment within influential firms, is larger than the second bracket, representing
employment within non-influential firms. This is not necessarily true, despite
the extra employment condition, because fewer influential firms will choose to
invest. It follows that if employment is higher in firms choosing not to invest
then the overall difference in employment is uncertain. However, a sufficient
condition to guarantee that the expression in the first bracket is greater than
that in the second bracket is that employment within investing firms is not lower
than that in non-investing firms. This condition requires that
l∗
(˜γ) =
˜γ (δd − ˜γw)
2
≥
(δd − w)
2
= l∗
(1) . (26)
Note first that l∗
(˜γ) = l∗
(1) when ˜γ = 1. It is straightforward to show that
l∗
(˜γ) is concave in γ with a max-point at γ∗
= δd/2w. Thus, l∗
(˜γ) is strictly
decreasing as γ is increasing beyond this point. It follows that as long as ˜γ ≥
δd/2w then l∗
(˜γ) > l∗
(1). This is the condition given in Definition 1. Note that
this is a sufficient but not a necessary condition. There exists an equilibrium as
defined above also when l∗
(˜γ) < l∗
(1) for some parametrizations of the other
variables, but not necessarily for all.
The condition U∆ (δ | d) > 0 requires that L (d, 1) > L (d, δ), or
˜k(1)R
0
˜γ (d − ˜γw)
2
f (k) dk +
¯kR
˜k(1)
(d − w)
2
f (k) dk
>
˜k(δ)R
0
˜γ (δd − ˜γw)
2
f (k) dk +
¯kR
˜k(δ)
(δd − w)
2
f (k) dk. (27)
Once again this is not generally true, because more firms will choose to invest
with a more competent politician in power. If investing firms hire fewer workers,
14
then it is possible that that effect dominates the positive overall effect on hiring
from increased demand. However, under the assumption above, investing firms
will hire at least as many workers as non-investing, and the inequality above
holds. This concludes the proof of the definition above.
The game we have presented offers a potential theory of cronyism, built
around an elite exchange in which the political incumbent provides favoured
firms with a better business environment in exchange for some control rights
over employment decisions. The main result of the model is that more influential
firms are less likely to invest in a new technology, new plant or production line
that increases labour productivity. However, this result obviously relies on the
particular structure of the model developed to capture the logic of the elite
exchange. To more seriously test our model we therefore bring the following
three hypotheses to the data. More influential firms will; i) face a better business
environment, ii) enroll an excessive number of employees, iii) invest and innovate
less. The first two of these more closely correspond to key assumptions, whereas
the third hypotheses is a result.
4 Data and Methodology
The preceding section hypothesized that greater political influence among firms
should produce three outcomes of interest. First, influential firms are less likely
to face the types of constraints to, and costs of, doing business that their less-
influential counterparts would normally face. Second, influential firms are more
likely to serve as a source of politically valuable benefits, in particular in the
form of employment. Third, influential firms are less likely to invest and innovate
than non-influential firms.
To determine whether these hypotheses are empirically justified we rely on
the World Bank’s Enterprise Surveys (formerly the Productivity and Investment
Climate Surveys), which in total has collected data from approximately 50,000
manufacturing and service firms in over 60 developing countries conducted since
2000. For our purpose, we focus on 26 countries in the former Soviet Union and
15
Central and Eastern Europe. This data set, expansive in its cross-country cov-
erage, does not contain the type of information that would allow us to measure
actual political connections, namely, detailed information on owners or officers
that could be used to assess their political identities. Instead, the Enterprise
Surveys contains several perception-based questions about the political influ-
ence of firms in shaping national policies affecting their businesses. Moreover,
questions on political influence were dropped from the core questionnaire after
2005. The subset of this total sample of firms who have coded responses for
questions of political influence, therefore, is smaller–less than 5,000 firms in
our set of countries between 2000 and 2005.
4.1 Measuring Firm-Level Characteristics with Subjective
Data
The problems of comparability when respondents are asked to use ordinal re-
sponse categories are well known. Different respondents may interpret concepts
such as “influence” in vastly different ways based on unobservable character-
istics (“culture,” socialization, etc.). Ordinal scales may mean different things
to different respondents based on idiosyncratic factors such as mood or overall
optimism. Sometimes referred to in educational testing as “differential item
functioning” (DIF), the problem is particularly acute in measurements of po-
litical efficacy, where the actual level of efficacy may differ from the reported
level due to individual-specific proclivities (King and Wand 2007). Firm-level
perceptions of influence would similarly be affected by DIF where identical firms
may have unequal probabilities of answering questions about their own political
influence in the same way.
Explicit “anchoring vignettes” or other hypothetical questions to establish
baselines that could normally correct survey responses for inter-firm incompa-
rability, however, are not included in the Enterprise Surveys core questionnaire.
We rely, then, on two corrections. First, to measure influence we use four related
categories to a perception-based question from the core questionnaire:
16
How much influence do you think the following groups actually
had on recently enacted national laws and regulations that have a
substantial impact on your business? A: your firm; B: other domes-
tic firms; C: dominant firms or conglomerates in key sectors of the
economy; D: individuals or firms with close personal ties to political
leaders.
Each answer ranges from 0 (no impact) to 4 (decisive influence). We take
the sum of the differences between the self-assessment A and the assessments of
other groups, i.e., A — (B + C + D)/3, which yields a measure of the perceived
influence “gap” between the responding firm and other types of firms.6
Our
measure of influence ranges from -4 to +4. As with survey “anchors”, assess-
ments of others are subject to less inter-firm variation than self-assessments,
and thus we use responses to questions about other groups to subtract off the
DIF from the self-assessment question.
This is, of course, an imperfect solution to the problem of potential in-
comparability when other variables with ordinal-response categories are being
regressed on our measure of influence. In cases where our outcome of interest is
perception-based, our second solution is to include among the regressors a proxy
for firm-specific systematic bias. Previous analyses of business environment con-
straints using Enterprise Surveys data have shown that the interpretation of
(subjective) outcomes is complicated by the fact that some managers simply
tend to have a high propensity to complain, regardless of the actual constraints
their businesses may face (Carlin, Shaffer, and Seabright 2006). Inclusion of a
variable among regressors that proxies this propensity, then, can correct for in-
comparability in perception-based outcomes. For this purpose we use responses
by managers to questions about the degree to which their firms’ activity is con-
strained by two things: the macroeconomic environment and economic policy
uncertainty. We assume that firms within the same country and the same in-
6 We difference firms’ self perceptions with their average perceptions regarding three other
groups (other firms, other conglomerates, and other politically-connected firms) rather than
simply “other domestic firms” to reduce the effect of biased perceptions towards any particular
category of firms.
17
dustry are likely to face, objectively, a very similar macroeconomic environment
as well as policy uncertainty. The distribution of responses to these questions
should therefore closely proxy the distribution of the propensity to complain
among the management within our sample. The range for each question is 0
(no obstacle) to 4 (very severe obstacle). Our proxy for firm-specific systemic
bias is the sum of these responses.
4.2 Specification and Methods
Our basic specifications take the following form:
Rj = f (χωωj, χθθj, χxxj) (28)
where R is the hypothesized “crony” outcome for firm j specified in the
preceding section (firm j faces better business environment; firm j provides po-
litically valuable benefits; firm j invest or innovate less), ω is our measure of
the relative influence of firm j, θ is the firm-specific systematic bias of firm j as
described above, x is a vector of firm-specific control variables, and χ are vectors
of coefficients. The firm-specific characteristics we include are: the age of the
firm (in years), the number of permanent employees (log scale, lagged one year),
dummy variables identifying whether the firm is an exporter, whether the firm is
majority owned by a domestic company or individual (vs. a foreign entity), and
whether the firm is a state-owned enterprise. In addition, we include the follow-
ing sets of dummies in all specifications (though their results are not reported in
the tables): a legal-status effect (identifying whether the firm is publicly listed,
privately held, a cooperative, sole proprietorship, or partnership), a location
effect (identifying whether the firm is located in the capital city, in a city with
more than 1 million, 250,000 to 1 million, 50,000 to 250,000, or less than 50,000
in resident population), industry dummies (ISIC 2-digit), survey-year dummies,
and country dummies. All estimations also include a trend. Summary statistics
for all variables used in our analysis are in table 1.7
7 We have also tested if including a dummy specifying wether the firms have ever been
publicly owned makes a difference. The motivation is that newly privatized firms may maintain
18
Our basic specifications are estimated using OLS or logit regressions de-
pending on whether the outcome of interest is continuous or binary. Estimates
of the causal effects of firm-level political influence, however, may be affected
by selection bias due to the non-random character of “influential” vs. “non-
influential” firms, whereby the distribution of covariates ω, θ, and x, may be
very different for firms depending on their level of political influence. We there-
fore correct for observable differences between influential/non-influential firms
by pre-processing our data with matching methods, then re-running our para-
metric analyses on the matched sub-sample of the data as recommended by
Ho et al. (2007), and similar to the parametric bias-adjustment for match-
ing by Abadie and Imbens (2006). We compute coefficients on all independent
variables after matching rather than reporting the simple difference in means
without controlling for potential confounding variables. The purpose of match-
ing here, of course, is to ensure that influential firms are as close as possible
to non-influential firms in terms of relevant covariates, a method analogous to
severing the links between explanatory covariates and likelihood of “treatment”
in observational data.
We rely on exact matching based on the following model
Pr (Influence = 1) = Φ
³
ˆβθθj + ˆβxxj + ˆβLLobbyj
´
, (29)
where Influence = 1 [Influence = 0] occurs when a firm is [is not] able to
influence national policies affecting its business. We designate firms as influential
if their influence score as calculated above is greater than zero. Φ is the standard
normal distribution function, θ is the firm-specific bias, and x is a vector of
firm-specific indicators—age of the firm, number of permanent workers, legal-,
location-, sector-, year-, and country-dummies, as well as additional dummies
specifying whether the firm is an exporter, domestically-owned, or state-owned.
To this we add an additional dummy not used in our other regressions: whether,
in the past two years, the firm has sought to lobby the government or otherwise
close political connections, while struggling with the legacy of public ownership in terms of
bloated payrolls and inefficient business practices. Including this dummy does not change any
of our results, though.
19
influence the content of laws or regulations affecting the firm’s business.
Tests of matching balance are shown in table 2. We perform exact matching
using a propensity score derived from a logit regression of (29), which generates
a conditional “treatment” probability–in this case, the conditional probability
of being an influential firm. As mentioned above, propensity score matching
adjusts for pre-treatment observable differences between treated and control
samples. Without matching, the means of influential and non-influential sam-
ples of firms are distinct as seen in T-tests. After matching, however, we can
no longer reject the null hypothesis of equality of means between influential and
non-influential firms, suggesting that propensity-score matching reduces imbal-
ance between these samples.
5 Results
Before showing regression results, some summary statistics are given in Ta-
ble 1, whereas Figure 1 displays the means and variances of influence across
the 26 countries. The most meaningful measure is the variance, a higher vari-
ance suggesting that there are more firms perceiving themselves as being very
influential/non-influential in relative terms. As shown in Figure 1 there is some
variation both in means and in the variance across the sample. We calculated
the mean in variance in the group of former Soviet-Union countries and com-
pared that to the mean in variance for the other countries, on the assumption
that unequal influence is more of an issue in the former. The variance is in-
deed slightly higher on average in the former Soviet Union countries, and the
difference is statistically significant, but it is quite small.
5.1 Evidence for an elite exchange
To look at evidence in favor of the elite exchange we look at benefits to influential
firms, and indications that influential firms carry bloated payrolls. There is a
certain asymmetry in our results in that we have much more evidence for the
20
first part, but this is entirely driven by data availability. Table 3 examines
two costs typically imposed on businesses in transition countries: bribes, and
theft. Columns (1) to (4) examine bribes, both in total as a percentage of sales,
and specifically for government contracts as a percentage of contract value. For
each outcome we present, first the results from basic OLS regressions using
the full sample, and then using only the matched sample of observations. In
each specification, influential firms pay less in bribes both in general and for
government contracts. With less consistency, we also find that older firms,
state-owned companies, and foreign companies are better protected from bribe-
collectors. We also include workers in quadratic form, and find that firms with
more employees pay more in bribes (for government contracts) but the effect
is diminishing. We include, but do not report legal status, location, industry,
time, and country dummies.8
In columns (5) and (6) we examine the effect of
political influence on losses from theft, robbery, arson, or vandalism. In this
case we find no significant difference, indicating that crime take a toll on the
politically-connected and ordinary in roughly similar ways.
In table 4 we turn to firms’ subjective rankings of business constraints. Our
dependent variables are averages of responses to questions about the severity
of five categories of constraints: infrastructure (telecommunications, electricity,
and transportation), taxation (both rates and the administration of), regula-
tions (including customs, licensing, and permits), finance (cost and access), and
the legal system (anti-competitive practices, crime, and the efficacy of the legal
system). In each case we coded these variables 1 if the obstacle was considered
“major” or “severe,” 0 otherwise. To these five indicators we add a sixth, based
on firm responses to a question of how customers would respond were the firm
to raise prices of their main product or service by 10%. We code this outcome 1
if firms state that there would be no change in customer behavior, 0 otherwise.9
8 It is always possible that influential firms pay more bribes because they have more ex-
tensive dealings with public officials than non-influential firms. We find no evidence for this
disparity. We estimated the percentage of "senior management’s time spent in dealing with
requirements imposed by government regulations" based on the benchmark specification in
table 3, and find that influence has no statistically significant effect.
9 Firms were given four choices of responses: A: customers would continue to buy at the
same quantities; B: customers would continue to buy but at slightly lower quantities; C:
21
The results of logit regressions are summarized in table 4. For simplicity we
only report the coefficient on influence across estimations. All outcomes, how-
ever, were estimated using the full specification in (28), including firm-specific
systematic bias, on both unmatched and matched samples. We also report
pseudo R2
and prob. > χ2
values from the full estimations. Infrastructural
constraints actually affect influential firms slightly more, though the results are
significant only at the ten percent level. But all other constraints are decid-
edly more severe for non-influential firms. Influential firms are also more likely
to face a situation where price hikes do not change their customers’ behavior.
This suggests that another benefit of influence over laws and regulations is that
influential firms get shielded from competition.
As mentioned previously, the allocation of credit to privileged firms on “soft”
terms is considered one of the central instruments of crony capitalism. In ta-
ble 5 we investigate whether influential firms have easier access to credit. As
with the previous table, we estimated our full model on both unmatched and
matched samples, but we only report the coefficients and standard errors for
the influence variable. Here we examine four outcomes: (i) whether collateral
was required for the most recent loan (for firms that obtained loans); (ii) the
cost of the collateral (as a percentage of loan value); and the percentage of
(iii) working capital and (iv) new investments financed by “informal sources”
(money-lenders or other informal financial institutions). For the first outcome–
the collateral requirement–we use logit regressions, while for all others we rely
on OLS. Consistently, influential firms appear to have easier access to credit.
Unsurprisingly, influential firms are less likely to be asked to collateralize loans
by lenders. Among firms that do provide collateral or a deposit for their financ-
ing, the more influential firms typically have to cover less of their loans than
less influential firms. And influential firms are less entwined in the informal
financial sector.
As mentioned in the introduction, an inordinate amount of attention has
customers would continue to buy but at much lower quantities; and D: customers would stop
buying.
22
focused on the benefits of political influence that accrue to the firms them-
selves, while far less is understood in terms of the specific types of rents or
political rewards politicians can extract from cronyism. In table 6 we exam-
ine evidence of the high-employment guarantees implicit in the firm-politician
relationship. Recall that in the partially-pooling equilibrium, political leaders
who find themselves less able to handle negative economic shocks rely instead
on influence contracts, a component of which involves firms keeping excess la-
bor in exchange for lowered costs of business. Columns (1) and (2) present
logit results for unmatched and matched samples, respectively, of estimating
the effect of political influence on excess employment. Firms were asked, if they
could change the number of full-time workers without restriction or punishment,
whether they would shrink their payrolls. We code responses 1 or 0 depending
on whether firms reported they would lay off workers. In columns (1) and (2),
in addition to the variables included in the basic specification, we also include
firms’ capacity utilization, on the assumption that use of installed productive
capacity can affect firm managers’ preferences regarding optimal employment
levels. We find that influential firms are more likely to maintain excess labor
than non-influential firms.
5.2 Consequences of political connections
Our last set of results addresses the question, indirectly, of enterprise dynamism
and performance. Rewards in the form of lowered costs of business, monopoly
rents, and other benefits are often justified by developing country governments
as a de facto form of targeted industrial policy, on the assumption that most
politically-connected firms use these benefits to invest and innovate, and that
these influential forms are also the most dynamic. However, our model suggests
that the opposite may be true; more influential firms are less likely to invest and
innovate if the price for influence is to give up control rights over employment
decisions. We examine this relationship in table 5.
Firms were asked a series of questions on their restructuring activities and
23
innovation. Table 7 shows the results of estimations in which the dependent
variables are a set of innovation/restructuring outcomes: whether, in the past
three years, the firm opened a new plant, introduced a new product line, closed
an old plant, or closed an obsolete product line. While there are valid concerns
regarding the comparability of "newness" or "obsolescence" across firms in dif-
ferent countries and in different industries, the inclusion of industry and country
dummies should correct for these differences. As in table 4, we only report co-
efficients and standard errors for the influence variable, for estimations using
both unmatched and matched samples. Once again, influential firms display a
certain consistency: they are less likely to open a new facility, or to introduce
or close out product lines. In the regression on the probability of closing an old
facility, influence has the expected sign, but is not statistically significant.
6 Conclusions
We argue that cronyism in business-government dealings in transition economies
takes a specific form: an influence contract between firms and politicians whereby
the former relinquish a portion of control rights over employment decisions in ex-
change for a more favorable business environment. This exchange affects firms’
costs of doing business as well as certain operating decisions. In particular, we
suggest that privileged firms benefit through lower fixed costs, while also facing
higher variable costs through increased payrolls. The important consequence of
that is that influential firms are less likely to make investments that increase
labour productivity because they are unable to reap all the benefits from it.
Our model is generally supported by evidence from approximately 5,000
firms in 26 countries in the former Soviet Union and central and Eastern Europe.
We find that influential firms pay smaller bribes, enjoy regulatory forbearance,
monopoly rights, and preferential access to credit, and face weaker obstacles to
doing business than less-influential firms. In return, influential firms provide
politicians with political benefits in the form of higher employment, through
overstaffing. Finally, and most importantly, the influential firms are less likely
24
to open new product lines or production facilities or close obsolete ones, sug-
gesting that influence, though beneficial in the short run, may inhibit long run
dynamism and productivity.
Our results thus refute the claim, occasionally repeated in commercial or eco-
nomic development ministries in developing countries, that selective industrial
policy typically is an efficient instrument to promote innovation, technological
progress and productivity in developing countries (e.g. Khan 2000). In practice,
the lack of competitive pressure and the meddling of political considerations in
management decisions (in particular employment) create more disincentives,
than the otherwise favorable business environment creates incentives, for in-
novation and long-term investments. This is important since it suggests that
cronyism carries a welfare cost not only by distorting competition and eroding
trust in the fairness and honesty of the political system, but also by hampering
the long run development even of the firms that stand to gain in the short run.
Our results also argue against the view that bribes are an instrument of
influence-peddling by private sector elites. Rather, our findings suggest that
bribe taxes are used by the public sector to extort payments from weak or vulner-
able enterprises. This is consistent with a bargaining framework for bribe-paying
in which political connectedness can increase firms’ relative bargaining power
in dealing with public officials (Svensson 2003). High-level connections shield
firms from predatory behavior by rank and file administrators. These findings
suggest a need to make a clear distinction between cronyism and administrative
corruption in the literature; they serve different purposes and involve different
segments of the public and private sectors.
References
[1] Abadie, A. and G. W. Imbens (2006), "Large Sample Properties of Match-
ing Estimators for Average Treatment Effects" Econometrica 74, 235-67.
25
[2] Agrawal, A. and C. R. Knoeber (2001), “Do some outside directors play a
political role?” Journal of Law and Economics 44, 179—198.
[3] Ang, J. and C. M. Boyer (2000), “Finance and politics: special interest
group influence during the nationalization and privatization of Conrail”
working paper, Florida State University.
[4] Aslund, A., P. Boone, and S. Johnson (2001), “Escaping the Under-Reform
Trap”, IMF Staff Papers 48, 88 — 108.
[5] Bertrand, M., Kramarz, F., Schoar, A., and D. Thesmar (2004), "Politi-
cally Connected CEOs and Corporate Outcomes: Evidence from France",
mimeo.
[6] Besley, T. and R. Burgess (2002), "The Political Economy of Government
Responsiveness: Theory and Evidence from India", Quarterly Journal of
Economics 117, 1415-1451.
[7] Campos, N. and F.Giovannoni (2006), "Lobbying, Corruption and Political
Influence", IZA Discussion Paper 2313.
[8] Carlin, W., Schaffer, M. E. and P. Seabright (2006),."Where Are the Real
Bottlenecks? Evidence from 20,000 Firms in 60 Countries About the
Shadow Costs of Constraints to Firm Performance", CEPR Discussion Pa-
pers 5719.
[9] Choi, J. P. and M. Thum (2007), "The Economics of Politically Connected
Firms", CESifo Working Paper 2025.
[10] Chong, A. and M. Gradstein (2007), "On the Determinants and Effects
of Political Influence", Inter-American Development Bank Working Paper
616.
[11] Claessens, S., Feijen, E. and L. Laeven (2007), "Political Connections and
Preferential Access to Finance: The Role of Campaign Contributions",
CEPR Working Paper, London.
26
[12] Desai, P., and T. Idson (2000), "Work without Wages: Russia’s Nonpay-
ment Crisis", MIT Press, Cambridge, Mass.
[13] Faccio, M. (2006), "Politically Connected Firms", American Economic Re-
view 96, 369-386.
[14] Fidrmuc, J. (2000a), "Political Support for Reforms: Economics of Voting
in Transition Economies", European Economic Review 44, 1491-1513.
[15] Fidrmuc, J. (2000b), "Economics of Voting in Post-Communist Countries",
Electoral Studies 19, 199-217.
[16] Fisman, R. (2001), "Estimating the Value of Political Connections", Amer-
ican Economic Review 91, 1095-1102.
[17] Frye, T. (2002), "Capture or Exchange? Business Lobbying in Russia",
Europe-Asia Studies 54, 1017-1036.
[18] Frye, T. and A. Shleifer (1997), "The Invisible Hand and the Grabbing
Hand", American Economic Review 87, 354-358.
[19] Gehlbach, S. (2006), "The Consequences of Collective Action: An
Incomplete-Contracts Approach", American Journal of Political Science
50, 802-823.
[20] Gonzalez, A., J. E. Lopez-Cordova, and E. E. Valladares (2007), "The
Incidence of Graft on Developing-Country Firms", working paper, World
Bank, Washington DC.
[21] Haber, S., ed. (2002), "Crony Capitalism and Economic Growth in Latin
America: Theory and Evidence," Hoover Institute Press, Stanford, Calif.
[22] Hellman, J., G. Jones, and D. Kaufmann (2003), "Seize the State, Seize
the Day: State Capture and Influence in Transition Economies", Journal
of Comparative Economics 31, 751-73.
[23] Hellman, J. and D Kaufmann (2003), "The Inequality of Influence", mimeo.
27
[24] Ho, D. E., Kosuke, I., King, G. and E. A. Stuart (2007), "Matching as Non-
parametric Preprocessing for Reducing Model Dependence in Parametric
Causal Inference", Political Analysis 10.1093/pan/mpl013.
[25] Johnson, S. and T. Mitten (2003), "Cronyism and Capital Controls: Evi-
dence from Malaysia", Journal of Financial Economics, 351-382.
[26] Khan, M. H. (2000), "Rents, Efficiency and Growth", in Khan, M. H. and
K. S. Jomo (eds) rents, Rent-seeking and Economic Development: Theory
and Evidence in Asia, Cambridge University Press, Cambridge, Massa-
chusetts.
[27] Khwaja, A. I. and A. Mian (2005), "Do Lenders Prefer Politically Con-
nected Firms? Rent Seeking in an Emerging Financial Market", Quarterly
Journal of Economics 120, 1371-1411.
[28] King, G. J. Wand (2007), "Comparing Incomparable Survey Responses:
Evaluating and Selecting Anchoring Vignettes", Political Analysis 15, 46-
66.
[29] Mach, B. W. and J. E. Jackson (2006), "Employment Change, Attitude
Evolution and Voting during Poland’s transition: Longitudinal Evidence",
European Journal of Political Economy, 22, 472-502.
[30] Pinto, B., V. Drebentsov, and A. Morozov (2000), "Dismantling Rus-
sia’s Nonpayments System: Creating Conditions for Growth", World Bank
Technical Paper 471, World Bank, Washington DC.
[31] Roberts, B. (1990), "A Dead Senator Tells no Lies: Seniority and the
Distribution of Federal Benefits", American Journal of Political Science
34, 31-58.
[32] Robinson, J. and T. Verdier (2002), "The Political Economy of Clien-
telism", CEPR Discussion Papers 3205.
28
[33] Roland. G. (2000), "Transition and Economics", MIT Press, Cambridge,
Massachusetts.
[34] Shleifer, A. and R. Vishny (1994), "Politicians and Firms", Quarterly Jour-
nal of Economics 109, 995-1026.
[35] Shleifer, A. and D. Treisman (2000), "Without a Map", MIT Press, Cam-
bridge, Massachusetts.
[36] Slinko, I., E. Yakovlev, and E. Zhuravskaya (2005), "Laws for Sale: Evi-
dence from Russia", American Law and Economics Review 7, 284-318.
[37] Stoner-Weiss, K. (2006), "Resisting the State: Reform and Retrenchment
in Post-Soviet Russia", Cambride University Press, New York.
[38] Svensson, J. (2003), "Who Payes Bribes and How Much? Evidence from a
Cross-Section of Firms", Quarterly Journal of Economics 118, 207-30.
29
30
Figure 1: Variance of influence
‐5
‐4
‐3
‐2
‐1
0
1
2
3
4
5
Slo
vakia
Tajikistan
C
zech
Lith
u
an
ia
M
aced
o
n
ia
R
o
m
an
ia
U
krain
e
A
rm
en
ia
Esto
n
ia
Serb
ia
A
lb
an
ia
Slo
ven
ia
C
ro
atia
H
u
n
gary
B
elaru
s
M
o
ld
o
va
B
o
sn
ia
U
zb
ekistan
B
u
lgaria
R
u
ssia
G
eo
rgia
Kyrgyzstan
K
azakh
stan
P
o
lan
d
A
zerb
aijan
K
o
so
vo
A
ve
rage In
flu
en
ce
 Sco
re
Notes: Graph shows countries ordered by dispersion of the average influence score; top and bottom of boxes are
means plus and minus one standard deviation, respectively. Top and bottom of lines are country maxima and
minima, respectively.
31
Table 1: Summary Statistics
Variable Obs Mean Std. Dev. Min Max
Influence 4889 -0.95 1.20 -4 4
Age 4889 18.39 18.28 4 206
Exporter 4889 0.19 0.39 0 1
Domestic 4889 0.84 0.37 0 1
State-owned 4889 0.11 0.31 0 1
Bias 4889 3.70 2.00 0 8
Lobby 4877 0.24 0.43 0 1
Workers 4889 3.24 1.74 0.69 9.21
Capacity Utilization 4799 79.37 20.38 3 100
Bribes (% sales) 4516 1.67 3.35 0 50
Bribes for Government Contracts (% of contract value) 4483 1.96 4.66 0 50
Theft Losses (% sales) 4508 1.02 4.41 0 95
Opened New Plans 4857 0.15 0.36 0 1
Opened New Product 4865 0.40 0.49 0 1
Closed Old Plant 4852 0.12 0.32 0 1
Closed Old Product 4858 0.22 0.42 0 1
Excess Labor 3695 0.56 0.50 0 1
Infrastructure 4828 0.04 0.20 0 1
Taxation 4889 0.33 0.47 0 1
Regulation 4551 0.14 0.34 0 1
Finance 4662 0.26 0.44 0 1
Legal System 4555 0.12 0.33 0 1
Monopoly Rights 4850 0.20 0.40 0 1
Collateral 2059 0.81 0.39 0 1
Cost of Collateral (% of loan) 1507 144.74 81.38 1 900
Informal Finance (% of working capital) 4800 1.18 7.48 0 100
Informal Finance (% of new investments) 3487 0.90 6.71 0 100
32
Table 2: Balance Testing for Matched and Unmatched Covariates
Variable Sample Influential Non-influential T-test
Age Unmatched 23.26 18.57 0.00
Matched 23.07 24.09 0.50
export 0.23 0.18 0.01
0.24 0.25 0.72
domestic 0.83 0.85 0.09
0.82 0.85 0.28
state 0.21 0.10 0.00
0.21 0.20 0.82
bias2 3.24 3.83 0.00
3.22 3.34 0.35
lobby 0.53 0.19 0.00
0.55 0.55 0.95
Notes: Results generated from exact propensity score matching using logit regression with legal-status, location,
industry, time, and country dummies (not reported). Figures in italics are for the matched sub-sample. T-tests are
of equality of means between non-influential and influential firms.
33
Table 3
(1) (2) (3) (4) (5) (6)
Bribes (% of sales) Bribes for government
contracts (% of contract value)
Theft losses (% sales)
Influence -0.205***
(0.042)
-0.209***
(0.042)
-0.353***
(0.059)
-0.355***
(0.059)
-0.034
(0.057)
-0.038
(0.058)
Age (years) -0.001
(0.003)
-0.001
(0.003)
-0.009**
(0.004)
-0.009**
(0.004)
-0.003
(0.004)
-0.002
(0.004)
Exporter -0.102
(0.136)
-0.104
(0.138)
0.071
(0.193)
0.064
(0.195)
0.061
(0.187)
0.095
(0.189)
Domestic 0.443***
(0.139)
0.455***
(0.141)
0.299
(0.198)
0.316
(0.199)
0.397**
(0.190)
0.411**
(0.193)
State-owned -0.611**
(0.271)
-0.619**
(0.277)
-0.957**
(0.385)
-1.044***
(0.392)
0.091
(0.374)
0.049
(0.384)
Workers -0.016
(0.111)
-0.030
(0.113)
0.282*
(0.159)
0.278*
(0.160)
-0.076
(0.152)
-0.095
(0.155)
Workers2
-0.015
(0.014)
-0.013
(0.014)
-0.050**
(0.020)
-0.049**
(0.020)
0.001
(0.019)
0.004
(0.020)
(Adjusted) R2
0.087 0.101 0.097 0.100 0.030 0.030
Observations 4717 4597 4681 4564 4716 4593
Notes: Results from OLS and 3SLS regressions, with legal-status, location, industry, time, and country dummies
(not reported). Columns (1), (3), and (5) are OLS regressions on the unmatched sample. Columns (2), (4), and (6)
are OLS regressions on the matched sample of observations. Exact matching is performed using a conditional
propensity score.
*** p < 0.01
** p < 0.05
* p < 0.10.
34
Table 4
Dep. variable Coefficient Std. error Observations
(1) Infrastructure 0.126* 0.067 4659
(2) 0.120* 0.067 4647
(3) Taxation -0.195*** 0.032 4889
(4) -0.194*** 0.032 4877
(5) Regulations -0.218*** 0.043 4451
(6) -0.215*** 0.044 4439
(7) Finance -0.111*** 0.033 4739
(8) -0.111*** 0.033 4727
(9) Legal -0.155*** 0.047 4545
(10) -0.153*** 0.047 4533
(11) Monopoly 0.146*** 0.033 4926
(12) 0.148*** 0.033 4914
Notes: Coefficients and standard errors on “influence” are reported. All regressions include, in addition to
influence, the following variables: age of firm, exporter dummy, domestic dummy, workers (linear and
quadratic), firm-specific bias, time trend, legal-status, location, industry, time, and country dummies. Figures in
italics are for matched data using propensity-score matching based on logit model.
*** p < 0.01
** p < 0.05
* p < 0.10
35
Table 5
Dep. variable Coefficient Std. error Observations R-squared
(1) Collateral required -0.166*** (0.055) 2134 0.164
(2) -0.159*** (0.056) 2082 0.166
(3) Cost of collateral (% of
loan value)
-3.451* (1.814) 1564 0.160
(4) -3.106* (1.827) 1529 0.160
(5) Informal finance
(% of working capital)
-0.178* (0.095) 5009 0.024
(6) -0.169* (0.097) 4884 0.025
(7) Informal finance
(% of new investments)
-0.176* (0.100) 3615 0.020
(8) -0.180* (0.101) 3545 0.020
Notes: Coefficients and standard errors on “influence” are reported. All regressions include, in addition to
influence, the following variables: age of firm, exporter dummy, domestic dummy, workers (linear and
quadratic), firm-specific bias, time trend, legal-status, location, industry, time, and country dummies. Figures in
italics are for matched data using propensity-score matching based on logit model. Equations (1) and (2) show
results from logit regressions, all other equations are OLS.
*** p < 0.01
** p < 0.05
* p < 0.10.
36
Table 6:
(1) (2)
Excess Labor
Influence 0.106***
(0.033)
0.107***
(0.033)
Age (years) -0.001
(0.003)
-0.001
(0.003)
Exporter 0.031
(0.105)
0.040
(0.105)
Domestic 0.076
(0.103)
0.075
(0.103)
State-owned 0.242
(0.229)
0.224
(0.231)
Bias 0.033*
(0.019)
0.033*
(0.019)
Workers 0.123
(0.085)
0.118
(0.086)
Workers2
-0.021*
(0.011)
-0.021*
(0.011)
Capacity
Utilization
-0.000
(0.002)
-0.000
(0.002)
Observations 3675 3667
R2
0.067 0.067
Notes: Results from OLS regressions, with legal-status, location, industry, time, and country dummies (not
reported). Column (1) is an OLS regression on the unmatched sample, (2) is on the matched sample. Exact
matching is performed using a conditional propensity score.
*** p < 0.01
** p < 0.05
* p < 0.10.
37
Table 7
Dep. variable Coefficient Std. error Observations
(1) New product -0.059** 0.029 4879
(2) -0.060** 0.029 4867
(3) New plant -0.139*** 0.040 4872
(4) -0.137*** 0.040 4860
(5) Closed product -0.148*** 0.034 4873
(6) -0.145*** 0.034 4861
(7) Closed plant -0.034 0.042 4859
(8) -0.033 0.042 4847
Notes: Coefficients and standard errors on “influence” are reported. All regressions include, in addition to
influence, the following variables: age of firm, exporter dummy, domestic dummy, workers (linear and
quadratic), time trend, legal-status, location, industry, time, and country dummies. Equations (1) – (8) also include
firm-specific systemic bias. Figures in italics are for matched data using propensity-score matching based on a
logit model. Estimation is by logit regressions.
*** p < 0.01
** p < 0.05
* p < 0.10.

More Related Content

What's hot

Poverty, Exclusion, and Dissent - Support for Regimes in Developing Countries
Poverty, Exclusion, and Dissent - Support for Regimes in Developing CountriesPoverty, Exclusion, and Dissent - Support for Regimes in Developing Countries
Poverty, Exclusion, and Dissent - Support for Regimes in Developing Countries
Stockholm Institute of Transition Economics
 
The Constitutional Channels of the Resource Curse
The Constitutional Channels of the Resource CurseThe Constitutional Channels of the Resource Curse
The Constitutional Channels of the Resource Curse
Stockholm Institute of Transition Economics
 
Leniency, Asymmetric Punishment and Corruption Evidence from China
Leniency, Asymmetric Punishment and Corruption Evidence from ChinaLeniency, Asymmetric Punishment and Corruption Evidence from China
Leniency, Asymmetric Punishment and Corruption Evidence from China
Stockholm Institute of Transition Economics
 
Religion, Politics, and Development Essays in Development Economics and Polit...
Religion, Politics, and Development Essays in Development Economics and Polit...Religion, Politics, and Development Essays in Development Economics and Polit...
Religion, Politics, and Development Essays in Development Economics and Polit...
Stockholm Institute of Transition Economics
 
Islamic Rule and the Empowerment of the Poor and Pious
Islamic Rule and the Empowerment of the Poor and PiousIslamic Rule and the Empowerment of the Poor and Pious
Islamic Rule and the Empowerment of the Poor and Pious
Stockholm Institute of Transition Economics
 
Barbuti_Di-Palma_Dubini_Thibault-APPLICATIONS-PROJECT
Barbuti_Di-Palma_Dubini_Thibault-APPLICATIONS-PROJECTBarbuti_Di-Palma_Dubini_Thibault-APPLICATIONS-PROJECT
Barbuti_Di-Palma_Dubini_Thibault-APPLICATIONS-PROJECT
Quentin Thibault
 

What's hot (20)

Union Leaders as Experts: Wage Bargaining and Strikes with Union-Wide Ballot ...
Union Leaders as Experts: Wage Bargaining and Strikes with Union-Wide Ballot ...Union Leaders as Experts: Wage Bargaining and Strikes with Union-Wide Ballot ...
Union Leaders as Experts: Wage Bargaining and Strikes with Union-Wide Ballot ...
 
Poverty, Exclusion, and Dissent - Support for Regimes in Developing Countries
Poverty, Exclusion, and Dissent - Support for Regimes in Developing CountriesPoverty, Exclusion, and Dissent - Support for Regimes in Developing Countries
Poverty, Exclusion, and Dissent - Support for Regimes in Developing Countries
 
On the Timing of Turkey’s Authoritarian Turn
On the Timing of Turkey’s Authoritarian TurnOn the Timing of Turkey’s Authoritarian Turn
On the Timing of Turkey’s Authoritarian Turn
 
The Long-run Determinants of Inequality: What Can We Learn From Top Income Data?
The Long-run Determinants of Inequality: What Can We Learn From Top Income Data?The Long-run Determinants of Inequality: What Can We Learn From Top Income Data?
The Long-run Determinants of Inequality: What Can We Learn From Top Income Data?
 
The Constitutional Channels of the Resource Curse
The Constitutional Channels of the Resource CurseThe Constitutional Channels of the Resource Curse
The Constitutional Channels of the Resource Curse
 
Herding in Aid Allocation
Herding in Aid AllocationHerding in Aid Allocation
Herding in Aid Allocation
 
Leniency, Asymmetric Punishment and Corruption Evidence from China
Leniency, Asymmetric Punishment and Corruption Evidence from ChinaLeniency, Asymmetric Punishment and Corruption Evidence from China
Leniency, Asymmetric Punishment and Corruption Evidence from China
 
Delegation versus Communication in the Organization of Government
Delegation versus Communication in the Organization of GovernmentDelegation versus Communication in the Organization of Government
Delegation versus Communication in the Organization of Government
 
Efficient Fiscal Spending by Supranational Unions
Efficient Fiscal Spending by Supranational UnionsEfficient Fiscal Spending by Supranational Unions
Efficient Fiscal Spending by Supranational Unions
 
Religion, Politics, and Development Essays in Development Economics and Polit...
Religion, Politics, and Development Essays in Development Economics and Polit...Religion, Politics, and Development Essays in Development Economics and Polit...
Religion, Politics, and Development Essays in Development Economics and Polit...
 
Foreign Aid: An Instrument for Fighting Communism?
Foreign Aid: An Instrument for Fighting Communism?Foreign Aid: An Instrument for Fighting Communism?
Foreign Aid: An Instrument for Fighting Communism?
 
Islamic Rule and the Empowerment of the Poor and Pious
Islamic Rule and the Empowerment of the Poor and PiousIslamic Rule and the Empowerment of the Poor and Pious
Islamic Rule and the Empowerment of the Poor and Pious
 
The Evolution of Post-communist Economic systems
The Evolution of Post-communist Economic systemsThe Evolution of Post-communist Economic systems
The Evolution of Post-communist Economic systems
 
Deja vu in myanmar
Deja vu in myanmarDeja vu in myanmar
Deja vu in myanmar
 
Preparing for Genocide: Community Work in Rwanda
Preparing for Genocide: Community Work in RwandaPreparing for Genocide: Community Work in Rwanda
Preparing for Genocide: Community Work in Rwanda
 
Can the Poor Be Organized?
Can the Poor Be Organized?Can the Poor Be Organized?
Can the Poor Be Organized?
 
Leniency, Asymmetric Punishment and Corruption: Evidence from China
Leniency, Asymmetric Punishment and Corruption: Evidence from ChinaLeniency, Asymmetric Punishment and Corruption: Evidence from China
Leniency, Asymmetric Punishment and Corruption: Evidence from China
 
Are we all working class now the rise of white collar working class voters
Are we all working class now the rise of white collar working class votersAre we all working class now the rise of white collar working class voters
Are we all working class now the rise of white collar working class voters
 
Barbuti_Di-Palma_Dubini_Thibault-APPLICATIONS-PROJECT
Barbuti_Di-Palma_Dubini_Thibault-APPLICATIONS-PROJECTBarbuti_Di-Palma_Dubini_Thibault-APPLICATIONS-PROJECT
Barbuti_Di-Palma_Dubini_Thibault-APPLICATIONS-PROJECT
 
Booklet highlighting the key messages from the OECD publication "Lobbyists, G...
Booklet highlighting the key messages from the OECD publication "Lobbyists, G...Booklet highlighting the key messages from the OECD publication "Lobbyists, G...
Booklet highlighting the key messages from the OECD publication "Lobbyists, G...
 

Viewers also liked

Importance of family background for economic status – evidence from child eva...
Importance of family background for economic status – evidence from child eva...Importance of family background for economic status – evidence from child eva...
Importance of family background for economic status – evidence from child eva...
Stockholm Institute of Transition Economics
 
Community Participation in Decision-Making Evidence from an experiment in pro...
Community Participation in Decision-Making Evidence from an experiment in pro...Community Participation in Decision-Making Evidence from an experiment in pro...
Community Participation in Decision-Making Evidence from an experiment in pro...
Stockholm Institute of Transition Economics
 

Viewers also liked (17)

The economic consequences of mutual help in extended families
The economic consequences of mutual help in extended familiesThe economic consequences of mutual help in extended families
The economic consequences of mutual help in extended families
 
Raising Returns, Managing Risk: A Randomized Experiment on Combining Input Su...
Raising Returns, Managing Risk: A Randomized Experiment on Combining Input Su...Raising Returns, Managing Risk: A Randomized Experiment on Combining Input Su...
Raising Returns, Managing Risk: A Randomized Experiment on Combining Input Su...
 
The Economic Effects of a Borrower Bailout: Evidence from an Emerging Market
The Economic Effects of a Borrower Bailout: Evidence from an Emerging MarketThe Economic Effects of a Borrower Bailout: Evidence from an Emerging Market
The Economic Effects of a Borrower Bailout: Evidence from an Emerging Market
 
Fines, Leniency, Rewards and Organized Crime: Evidence from Antitrust Experiment
Fines, Leniency, Rewards and Organized Crime: Evidence from Antitrust ExperimentFines, Leniency, Rewards and Organized Crime: Evidence from Antitrust Experiment
Fines, Leniency, Rewards and Organized Crime: Evidence from Antitrust Experiment
 
Competition policy and productivity growth: An empirical assessment
Competition policy and productivity growth: An empirical assessmentCompetition policy and productivity growth: An empirical assessment
Competition policy and productivity growth: An empirical assessment
 
Financial Instruments for Energy Markets
Financial Instruments for Energy MarketsFinancial Instruments for Energy Markets
Financial Instruments for Energy Markets
 
Reputation, Competition and Entry in Procurement
Reputation, Competition and Entry in ProcurementReputation, Competition and Entry in Procurement
Reputation, Competition and Entry in Procurement
 
Importance of family background for economic status – evidence from child eva...
Importance of family background for economic status – evidence from child eva...Importance of family background for economic status – evidence from child eva...
Importance of family background for economic status – evidence from child eva...
 
Community Participation in Decision-Making Evidence from an experiment in pro...
Community Participation in Decision-Making Evidence from an experiment in pro...Community Participation in Decision-Making Evidence from an experiment in pro...
Community Participation in Decision-Making Evidence from an experiment in pro...
 
9 Priority Financing for Development Commitments
9 Priority Financing for Development Commitments9 Priority Financing for Development Commitments
9 Priority Financing for Development Commitments
 
International Climate Policy and Linking of Carbon Markets
International Climate Policy and Linking of Carbon MarketsInternational Climate Policy and Linking of Carbon Markets
International Climate Policy and Linking of Carbon Markets
 
‘Finance for Sustainable Development’ Speakers’ bios, Development Day 2015, M...
‘Finance for Sustainable Development’ Speakers’ bios, Development Day 2015, M...‘Finance for Sustainable Development’ Speakers’ bios, Development Day 2015, M...
‘Finance for Sustainable Development’ Speakers’ bios, Development Day 2015, M...
 
Wealth, Health, and Child Development: Evidence from Administrative Data on S...
Wealth, Health, and Child Development: Evidence from Administrative Data on S...Wealth, Health, and Child Development: Evidence from Administrative Data on S...
Wealth, Health, and Child Development: Evidence from Administrative Data on S...
 
On the Role of Capital Gains in Top Incomes
On the Role of Capital Gains in Top IncomesOn the Role of Capital Gains in Top Incomes
On the Role of Capital Gains in Top Incomes
 
Will new technologies change energy markets?—Some “macro” notes
Will new technologies change energy markets?—Some “macro” notesWill new technologies change energy markets?—Some “macro” notes
Will new technologies change energy markets?—Some “macro” notes
 
Smart grid: technology and market evidence
Smart grid: technology and market evidenceSmart grid: technology and market evidence
Smart grid: technology and market evidence
 
A first analysis and profiling of social enterprises in Sweden prepared by th...
A first analysis and profiling of social enterprises in Sweden prepared by th...A first analysis and profiling of social enterprises in Sweden prepared by th...
A first analysis and profiling of social enterprises in Sweden prepared by th...
 

Similar to Political Influence in Transition Economies: Firm Level Evidence

Political capital in a market economy
Political capital in a market economyPolitical capital in a market economy
Political capital in a market economy
Dr. Miya Burt-Stewart
 
Access provided by University of Redlands (5 May 2016 2346 GM.docx
Access provided by University of Redlands (5 May 2016 2346 GM.docxAccess provided by University of Redlands (5 May 2016 2346 GM.docx
Access provided by University of Redlands (5 May 2016 2346 GM.docx
nettletondevon
 
Keller Kelly accepted article
Keller Kelly accepted articleKeller Kelly accepted article
Keller Kelly accepted article
edejkeller
 
The FixHow Citizens Unitedchanged politics, in 7charts.docx
The FixHow Citizens Unitedchanged politics, in 7charts.docxThe FixHow Citizens Unitedchanged politics, in 7charts.docx
The FixHow Citizens Unitedchanged politics, in 7charts.docx
oreo10
 
273PRODUCING DEMOCRATIC VIBRANCY^K. Sabeel Rahman.docx
273PRODUCING DEMOCRATIC VIBRANCY^K. Sabeel Rahman.docx273PRODUCING DEMOCRATIC VIBRANCY^K. Sabeel Rahman.docx
273PRODUCING DEMOCRATIC VIBRANCY^K. Sabeel Rahman.docx
vickeryr87
 
273PRODUCING DEMOCRATIC VIBRANCY^K. Sabeel Rahman.docx
273PRODUCING DEMOCRATIC VIBRANCY^K. Sabeel Rahman.docx273PRODUCING DEMOCRATIC VIBRANCY^K. Sabeel Rahman.docx
273PRODUCING DEMOCRATIC VIBRANCY^K. Sabeel Rahman.docx
lorainedeserre
 
Jp ec98 mauro-corruption-and_the_composition_of_government_expenditure
Jp ec98 mauro-corruption-and_the_composition_of_government_expenditureJp ec98 mauro-corruption-and_the_composition_of_government_expenditure
Jp ec98 mauro-corruption-and_the_composition_of_government_expenditure
Lhiny19
 
Economics ResourcesTaxes on Savings - GRUBER File.pdf.docx
Economics ResourcesTaxes on Savings - GRUBER File.pdf.docxEconomics ResourcesTaxes on Savings - GRUBER File.pdf.docx
Economics ResourcesTaxes on Savings - GRUBER File.pdf.docx
tidwellveronique
 
Social Work, Politics, and Social Policy Education Applying
Social Work, Politics, and Social Policy Education ApplyingSocial Work, Politics, and Social Policy Education Applying
Social Work, Politics, and Social Policy Education Applying
AlleneMcclendon878
 
The Government Intervention And Investment Decision Evidence From Vietnam.doc
The Government Intervention And Investment Decision Evidence From Vietnam.docThe Government Intervention And Investment Decision Evidence From Vietnam.doc
The Government Intervention And Investment Decision Evidence From Vietnam.doc
Dịch vụ viết đề tài trọn gói Liên hệ ZALO/TELE: 0973.287.149
 
Recession, Renewal, Revolution Nonprofit and Voluntary Action in an Age of Tu...
Recession, Renewal, Revolution Nonprofit and Voluntary Action in an Age of Tu...Recession, Renewal, Revolution Nonprofit and Voluntary Action in an Age of Tu...
Recession, Renewal, Revolution Nonprofit and Voluntary Action in an Age of Tu...
Daniel P. Vitaletti
 

Similar to Political Influence in Transition Economies: Firm Level Evidence (20)

Political capital in a market economy
Political capital in a market economyPolitical capital in a market economy
Political capital in a market economy
 
Access provided by University of Redlands (5 May 2016 2346 GM.docx
Access provided by University of Redlands (5 May 2016 2346 GM.docxAccess provided by University of Redlands (5 May 2016 2346 GM.docx
Access provided by University of Redlands (5 May 2016 2346 GM.docx
 
Blessing corruption: institutional reforms
Blessing corruption: institutional reformsBlessing corruption: institutional reforms
Blessing corruption: institutional reforms
 
Corruption and fdi: a theorical analysis
Corruption and fdi: a theorical analysisCorruption and fdi: a theorical analysis
Corruption and fdi: a theorical analysis
 
A formal analisys of patronage politics
A formal analisys of patronage politics A formal analisys of patronage politics
A formal analisys of patronage politics
 
A formal analisys of patronage politics
A formal analisys of patronage politics A formal analisys of patronage politics
A formal analisys of patronage politics
 
A formal analisys of patronage politics
A formal analisys of patronage politics A formal analisys of patronage politics
A formal analisys of patronage politics
 
Keller Kelly accepted article
Keller Kelly accepted articleKeller Kelly accepted article
Keller Kelly accepted article
 
ch2
ch2ch2
ch2
 
The FixHow Citizens Unitedchanged politics, in 7charts.docx
The FixHow Citizens Unitedchanged politics, in 7charts.docxThe FixHow Citizens Unitedchanged politics, in 7charts.docx
The FixHow Citizens Unitedchanged politics, in 7charts.docx
 
Bolivar- Research Proposal, Sociopolitical Variables of Development
Bolivar- Research Proposal, Sociopolitical Variables of DevelopmentBolivar- Research Proposal, Sociopolitical Variables of Development
Bolivar- Research Proposal, Sociopolitical Variables of Development
 
273PRODUCING DEMOCRATIC VIBRANCY^K. Sabeel Rahman.docx
273PRODUCING DEMOCRATIC VIBRANCY^K. Sabeel Rahman.docx273PRODUCING DEMOCRATIC VIBRANCY^K. Sabeel Rahman.docx
273PRODUCING DEMOCRATIC VIBRANCY^K. Sabeel Rahman.docx
 
273PRODUCING DEMOCRATIC VIBRANCY^K. Sabeel Rahman.docx
273PRODUCING DEMOCRATIC VIBRANCY^K. Sabeel Rahman.docx273PRODUCING DEMOCRATIC VIBRANCY^K. Sabeel Rahman.docx
273PRODUCING DEMOCRATIC VIBRANCY^K. Sabeel Rahman.docx
 
Jp ec98 mauro-corruption-and_the_composition_of_government_expenditure
Jp ec98 mauro-corruption-and_the_composition_of_government_expenditureJp ec98 mauro-corruption-and_the_composition_of_government_expenditure
Jp ec98 mauro-corruption-and_the_composition_of_government_expenditure
 
Voter Preferences and Political Change: Evidence From the Political Economy o...
Voter Preferences and Political Change: Evidence From the Political Economy o...Voter Preferences and Political Change: Evidence From the Political Economy o...
Voter Preferences and Political Change: Evidence From the Political Economy o...
 
Economics ResourcesTaxes on Savings - GRUBER File.pdf.docx
Economics ResourcesTaxes on Savings - GRUBER File.pdf.docxEconomics ResourcesTaxes on Savings - GRUBER File.pdf.docx
Economics ResourcesTaxes on Savings - GRUBER File.pdf.docx
 
Social Work, Politics, and Social Policy Education Applying
Social Work, Politics, and Social Policy Education ApplyingSocial Work, Politics, and Social Policy Education Applying
Social Work, Politics, and Social Policy Education Applying
 
A Game of Thrones
A Game of ThronesA Game of Thrones
A Game of Thrones
 
The Government Intervention And Investment Decision Evidence From Vietnam.doc
The Government Intervention And Investment Decision Evidence From Vietnam.docThe Government Intervention And Investment Decision Evidence From Vietnam.doc
The Government Intervention And Investment Decision Evidence From Vietnam.doc
 
Recession, Renewal, Revolution Nonprofit and Voluntary Action in an Age of Tu...
Recession, Renewal, Revolution Nonprofit and Voluntary Action in an Age of Tu...Recession, Renewal, Revolution Nonprofit and Voluntary Action in an Age of Tu...
Recession, Renewal, Revolution Nonprofit and Voluntary Action in an Age of Tu...
 

More from Stockholm Institute of Transition Economics

More from Stockholm Institute of Transition Economics (20)

IT sector development fading | Belarus Conference in Stockholm
IT sector development fading | Belarus Conference in StockholmIT sector development fading | Belarus Conference in Stockholm
IT sector development fading | Belarus Conference in Stockholm
 
Corisk Sanctions of Russia | Belarus Conference in Stockholm
Corisk Sanctions of Russia | Belarus Conference in StockholmCorisk Sanctions of Russia | Belarus Conference in Stockholm
Corisk Sanctions of Russia | Belarus Conference in Stockholm
 
Selected Economic Effects of Sanctions | Belarus Conference in Stockholm
Selected Economic Effects of Sanctions | Belarus Conference in StockholmSelected Economic Effects of Sanctions | Belarus Conference in Stockholm
Selected Economic Effects of Sanctions | Belarus Conference in Stockholm
 
Belarusian Economy 2024 | Conference in Stockholm
Belarusian Economy 2024 | Conference in StockholmBelarusian Economy 2024 | Conference in Stockholm
Belarusian Economy 2024 | Conference in Stockholm
 
Tracking sanctions compliance | SITE 2023 Development Day conference
Tracking sanctions compliance | SITE 2023 Development Day conferenceTracking sanctions compliance | SITE 2023 Development Day conference
Tracking sanctions compliance | SITE 2023 Development Day conference
 
War and Trade in Eurasia | SITE 2023 Development Day conference
War and Trade in Eurasia | SITE 2023 Development Day conferenceWar and Trade in Eurasia | SITE 2023 Development Day conference
War and Trade in Eurasia | SITE 2023 Development Day conference
 
Reducing the Russian Economic Capacity and support Ukraine
Reducing the Russian Economic Capacity and support UkraineReducing the Russian Economic Capacity and support Ukraine
Reducing the Russian Economic Capacity and support Ukraine
 
Energy sanctions - What else can be done?
Energy sanctions - What else can be done?Energy sanctions - What else can be done?
Energy sanctions - What else can be done?
 
How should policy be designed during energy-economic warfare?
How should policy be designed during energy-economic warfare?How should policy be designed during energy-economic warfare?
How should policy be designed during energy-economic warfare?
 
The impact of the war on Russia’s fossil fuel earnings
The impact of the war on Russia’s fossil fuel earningsThe impact of the war on Russia’s fossil fuel earnings
The impact of the war on Russia’s fossil fuel earnings
 
The Russia sanctions as a human rights instrument: Violations of export contr...
The Russia sanctions as a human rights instrument: Violations of export contr...The Russia sanctions as a human rights instrument: Violations of export contr...
The Russia sanctions as a human rights instrument: Violations of export contr...
 
SITE 2022 Development Day conference program
SITE 2022 Development Day conference programSITE 2022 Development Day conference program
SITE 2022 Development Day conference program
 
SITE 2022 Development Day conference | Program
SITE 2022 Development Day conference | ProgramSITE 2022 Development Day conference | Program
SITE 2022 Development Day conference | Program
 
Program | SITE 2022 Development Day conference
Program | SITE 2022 Development Day conferenceProgram | SITE 2022 Development Day conference
Program | SITE 2022 Development Day conference
 
Ce^2 Conference 2022 Programme
Ce^2 Conference 2022 ProgrammeCe^2 Conference 2022 Programme
Ce^2 Conference 2022 Programme
 
Ce2 Worksop & Conference 2022 Program
Ce2 Worksop & Conference 2022 ProgramCe2 Worksop & Conference 2022 Program
Ce2 Worksop & Conference 2022 Program
 
Ce^2 Conference 2022 Program
Ce^2 Conference 2022 ProgramCe^2 Conference 2022 Program
Ce^2 Conference 2022 Program
 
(Ce)2 Workshop program (preliminary)
(Ce)2 Workshop program (preliminary)(Ce)2 Workshop program (preliminary)
(Ce)2 Workshop program (preliminary)
 
Unemployment and Intra-Household Dynamics: the Effect of Male Job Loss on Int...
Unemployment and Intra-Household Dynamics: the Effect of Male Job Loss on Int...Unemployment and Intra-Household Dynamics: the Effect of Male Job Loss on Int...
Unemployment and Intra-Household Dynamics: the Effect of Male Job Loss on Int...
 
Football, Alcohol and Domestic Abuse
Football, Alcohol and Domestic AbuseFootball, Alcohol and Domestic Abuse
Football, Alcohol and Domestic Abuse
 

Recently uploaded

Call Girls in Yamuna Vihar (delhi) call me [🔝9953056974🔝] escort service 24X7
Call Girls in  Yamuna Vihar  (delhi) call me [🔝9953056974🔝] escort service 24X7Call Girls in  Yamuna Vihar  (delhi) call me [🔝9953056974🔝] escort service 24X7
Call Girls in Yamuna Vihar (delhi) call me [🔝9953056974🔝] escort service 24X7
9953056974 Low Rate Call Girls In Saket, Delhi NCR
 
Call Girls in Tilak Nagar (delhi) call me [🔝9953056974🔝] escort service 24X7
Call Girls in Tilak Nagar (delhi) call me [🔝9953056974🔝] escort service 24X7Call Girls in Tilak Nagar (delhi) call me [🔝9953056974🔝] escort service 24X7
Call Girls in Tilak Nagar (delhi) call me [🔝9953056974🔝] escort service 24X7
9953056974 Low Rate Call Girls In Saket, Delhi NCR
 

Recently uploaded (20)

Call Girls in Yamuna Vihar (delhi) call me [🔝9953056974🔝] escort service 24X7
Call Girls in  Yamuna Vihar  (delhi) call me [🔝9953056974🔝] escort service 24X7Call Girls in  Yamuna Vihar  (delhi) call me [🔝9953056974🔝] escort service 24X7
Call Girls in Yamuna Vihar (delhi) call me [🔝9953056974🔝] escort service 24X7
 
7 tips trading Deriv Accumulator Options
7 tips trading Deriv Accumulator Options7 tips trading Deriv Accumulator Options
7 tips trading Deriv Accumulator Options
 
Famous Kala Jadu, Black magic expert in Faisalabad and Kala ilam specialist i...
Famous Kala Jadu, Black magic expert in Faisalabad and Kala ilam specialist i...Famous Kala Jadu, Black magic expert in Faisalabad and Kala ilam specialist i...
Famous Kala Jadu, Black magic expert in Faisalabad and Kala ilam specialist i...
 
Q1 2024 Conference Call Presentation vF.pdf
Q1 2024 Conference Call Presentation vF.pdfQ1 2024 Conference Call Presentation vF.pdf
Q1 2024 Conference Call Presentation vF.pdf
 
Famous No1 Amil Baba Love marriage Astrologer Specialist Expert In Pakistan a...
Famous No1 Amil Baba Love marriage Astrologer Specialist Expert In Pakistan a...Famous No1 Amil Baba Love marriage Astrologer Specialist Expert In Pakistan a...
Famous No1 Amil Baba Love marriage Astrologer Specialist Expert In Pakistan a...
 
Solution Manual For Financial Statement Analysis, 13th Edition By Charles H. ...
Solution Manual For Financial Statement Analysis, 13th Edition By Charles H. ...Solution Manual For Financial Statement Analysis, 13th Edition By Charles H. ...
Solution Manual For Financial Statement Analysis, 13th Edition By Charles H. ...
 
W.D. Gann Theory Complete Information.pdf
W.D. Gann Theory Complete Information.pdfW.D. Gann Theory Complete Information.pdf
W.D. Gann Theory Complete Information.pdf
 
Certified Kala Jadu, Black magic specialist in Rawalpindi and Bangali Amil ba...
Certified Kala Jadu, Black magic specialist in Rawalpindi and Bangali Amil ba...Certified Kala Jadu, Black magic specialist in Rawalpindi and Bangali Amil ba...
Certified Kala Jadu, Black magic specialist in Rawalpindi and Bangali Amil ba...
 
Mahendragarh Escorts 🥰 8617370543 Call Girls Offer VIP Hot Girls
Mahendragarh Escorts 🥰 8617370543 Call Girls Offer VIP Hot GirlsMahendragarh Escorts 🥰 8617370543 Call Girls Offer VIP Hot Girls
Mahendragarh Escorts 🥰 8617370543 Call Girls Offer VIP Hot Girls
 
Call Girls in Tilak Nagar (delhi) call me [🔝9953056974🔝] escort service 24X7
Call Girls in Tilak Nagar (delhi) call me [🔝9953056974🔝] escort service 24X7Call Girls in Tilak Nagar (delhi) call me [🔝9953056974🔝] escort service 24X7
Call Girls in Tilak Nagar (delhi) call me [🔝9953056974🔝] escort service 24X7
 
logistics industry development power point ppt.pdf
logistics industry development power point ppt.pdflogistics industry development power point ppt.pdf
logistics industry development power point ppt.pdf
 
Seeman_Fiintouch_LLP_Newsletter_May-2024.pdf
Seeman_Fiintouch_LLP_Newsletter_May-2024.pdfSeeman_Fiintouch_LLP_Newsletter_May-2024.pdf
Seeman_Fiintouch_LLP_Newsletter_May-2024.pdf
 
Toronto dominion bank investor presentation.pdf
Toronto dominion bank investor presentation.pdfToronto dominion bank investor presentation.pdf
Toronto dominion bank investor presentation.pdf
 
Vip Call Girls Rasulgada😉 Bhubaneswar 9777949614 Housewife Call Girls Servic...
Vip Call Girls Rasulgada😉  Bhubaneswar 9777949614 Housewife Call Girls Servic...Vip Call Girls Rasulgada😉  Bhubaneswar 9777949614 Housewife Call Girls Servic...
Vip Call Girls Rasulgada😉 Bhubaneswar 9777949614 Housewife Call Girls Servic...
 
Turbhe Fantastic Escorts📞📞9833754194 Kopar Khairane Marathi Call Girls-Kopar ...
Turbhe Fantastic Escorts📞📞9833754194 Kopar Khairane Marathi Call Girls-Kopar ...Turbhe Fantastic Escorts📞📞9833754194 Kopar Khairane Marathi Call Girls-Kopar ...
Turbhe Fantastic Escorts📞📞9833754194 Kopar Khairane Marathi Call Girls-Kopar ...
 
Benefits & Risk Of Stock Loans
Benefits & Risk Of Stock LoansBenefits & Risk Of Stock Loans
Benefits & Risk Of Stock Loans
 
Lion One Corporate Presentation May 2024
Lion One Corporate Presentation May 2024Lion One Corporate Presentation May 2024
Lion One Corporate Presentation May 2024
 
Escorts Indore Call Girls-9155612368-Vijay Nagar Decent Fantastic Call Girls ...
Escorts Indore Call Girls-9155612368-Vijay Nagar Decent Fantastic Call Girls ...Escorts Indore Call Girls-9155612368-Vijay Nagar Decent Fantastic Call Girls ...
Escorts Indore Call Girls-9155612368-Vijay Nagar Decent Fantastic Call Girls ...
 
7 steps to achieve financial freedom.pdf
7 steps to achieve financial freedom.pdf7 steps to achieve financial freedom.pdf
7 steps to achieve financial freedom.pdf
 
Business Principles, Tools, and Techniques in Participating in Various Types...
Business Principles, Tools, and Techniques  in Participating in Various Types...Business Principles, Tools, and Techniques  in Participating in Various Types...
Business Principles, Tools, and Techniques in Participating in Various Types...
 

Political Influence in Transition Economies: Firm Level Evidence

  • 1. Political Influence in Transition Economies: Firm Level Evidence Raj M. Desai∗ Anders Olofsgard† This version: April 2009 Abstract Arrangements by which influential firms receive economic favors, has been documented in numerous case studies but rarely formalized or an- alyzed quantitatively. We offer a formal voting model in which political influence is modeled as a contract by which politicians deliver a more pref- erential business environment to favored firms who, in exchange, protect politicians from the political consequences of high unemployment. From this perspective, cronyism simultaneously lowers a firm’s fixed costs while raising its variable wage costs. Testing several of the implications of the model on firm-level data from 26 transition countries, we find that more influential firms face fewer administrative and regulatory obstacles and carry bloated payrolls, but they also invest and innovate less. These re- sults do not change when using propensity-score matching to adjust for the fact that influence is not randomly assigned. ∗Address: School of Foreign Service, Georgetown University, and the Wolfensohn Center for Development, Brookings Institution. E-mail: desair@georgetown.edu. †Address: The Economics Department and School of Foreign Service, Georgetown Univer- sity, and SITE, Stockholm School of Economics. E-mail: afo2@georgetown.edu. 1
  • 2. 1 Introduction The countries of the former Soviet Union and Eastern and Central Europe have come a long way since the onset of the transition from communism. Progress, though clearly uneven, has been evident in both the economic and political spheres in most countries. As part of this, the extent of state intervention in markets has been scaled down, as witnessed by the often rapid pace of pri- vatization during the 1990’s (e.g. Roland 2000, Shleifer and Triesman 2000). However, privatization hasn’t necessarily implied a severance of ties between po- litical elites and commercial interests, and recent events, in particular in Russia, suggest that state intervention may actually be increasing. The existing literature has offered several different descriptive (non-formal) models of the modes and motivations for state intervention during transition. The “Grabbing hand” model (e.g. Frye and Shleifer 1997) emphasizes that bu- reaucrats and politicians prey on vulnerable private firms threatening retaliation unless bribes are paid or other political benefits delivered. The “State capture” model (e.g. Hellman et al. 2003, Slinko et al. 2005). has instead focused on the ability of powerful private interests to capture the legislative process, and its implementation, in order to generate select benefits to a narrow economic elite at the cost of the rest of society. Finally, the “Elite exchange” model (e.g. Frye 2002, Stoner-Weiss 2006) suggests a middle way, in which political elites offer economic elites a favorable business environment in exchange for political benefits. In this paper we develop a formal model of an elite exchange and then test the predictions of the model on firm-level data across 26 countries in the former Soviet Union and Eastern and Central Europe. Our model features an election in which politicians differ in their ability to mitigate the macroeconomic consequences of economic shocks. In particular, a political incumbent may find she is unable to prevent substantial job destruction in times of a crisis. Letting this play out may be political costly, though, if voters associate high unemployment with incompetence. It follows that the incumbent will have incentives to boost employment levels through hidden means in order to conceal her inability. This is achieved in our model through an “influence contract” whereby a firm employs extra labor in exchange for special privileges or favors. Our theoretical contribution is twofold. We suggest a specific channel (em- ployment) through which politicians benefit from engaging in cronyism, and we offer an explanation for the political salience of employment, something that is typically just assumed (e.g. Shleifer and Vishny, 1994). Additionally, we high- light a mechanism by which the exchange of favors between firms and politicians affects firm productivity. In the corridors of some economic ministries, cronyism is occasionally defended as a crude form of industrial policy that boosts enter- prise performance. We demonstrate, however, that where cronyism lowers the fixed costs of doing business, the incentives for firms to innovate and invest may be diluted, if the firms, in exchange for lowered administrative and regulatory barriers, face higher variable costs from a bloated payroll. Our framework suggests three separate but connected implications for po- 2
  • 3. litically influential firms; they should encounter fewer administrative and reg- ulatory burdens; they should carry excess labor; and they should invest and innovate less and be less productive. We test these predictions using firm-level data from the World Bank’s Enterprise Surveys. We find that politically influ- ential firms do indeed face a more favorable business environment than their non-influential counterparts. Influential firms also tend to carry bloated pay- rolls. Influential firms, finally, are also less likely to open new product lines or production facilities, or to close obsolete ones, and they report lower real growth in sales, less spending on research and development and generally lower productivity. These results hold up to different specifications of our empirical model, including propensity-score matching to adjust for the fact that influence is not randomly assigned. Overall, the evidence overwhelmingly suggest that influence hurts rather than help firm productivity, implying that politically con- nected firms face a trade-off between short run profits and long run viability. This also suggests that these selective favors hurt welfare not only by under- mining competitiveness of non-influential firms, but also by distorting long run incentives of the influential firms. Our model emphasizes the political benefit of high employment levels. That unemployment carries a potential political prize is true for democracies across the world, but there are also reasons why this should be particularly true in the countries we consider. First of all, a cornerstone of the communist economic policy was full employment. Secondly, in the communist system, firms often provided not only a salary, but also housing, day care, schools, health care and other utilities. In the absence of publicly provided social safety nets, loosing ones job therefore typically had very dramatic consequences. The political importance of employment is also backed up by both theoretical and empirical research, some of it specifically looking at transition economies. Shleifer and Vishny (1994) argue that influential firms receiving public subsidies, in return, would cede part of their control rights over employment decisions to politicians benefiting politically from low unemployment rates. Robinson and Verdier (2002) also emphasize the political benefit of having control over em- ployment decisions. They argue that politicians can create political support groups by selective job offers that are contingent on the regime’s survival. As long as these jobs pay better than the market rate, these groups have a joint stake in keeping the current regime in power. Choi and Thum (2007) offer a sim- ilar model in which politicians offer selected firms economic benefits, while the firms in exchange invest in some generic way in stabilizing the regime. Mach and Jackson (2006), looking at voting behavior in Polish elections, find that the total level of job creation within voters’ regions is a very strong predictor of support for a reform agenda (stronger than the voters’ individual employ- ment status). Fidrmuc (2000a, 2000b), looking at a cross-section of transition economies, finds that there is persistence in the levels of support for different parties, but that support is based primarily on the delivered level of employ- ment, in particular among swing voters. Finally, Bertrand et all (2004), looking at the case of France, find that politically connected business leaders generate "re-election favors" to incumbent politicians by creating more jobs, in particular 3
  • 4. in politically more contested areas and around election years. Our paper also ties into a broader literature on the causes and consequences of political connections among firms. In the US, for example, the political weight of firms and industries using campaign finance, political action committees, and the “revolving door” between lobbying firms and congressional staff offices has been extensively examined (e.g. Agrawal and Knoeber 2001; Ang and Boyer 2000, Krozner and Stratmann 1998). An analysis of the benefits to firms from the seniority system in the US Senate showed that the sudden death of Senator Henry “Scoop” Jackson in 1983 lead to an abnormal drop in stock prices of firms contributing to his re-election campaign (Roberts, 1990). At the same time, firms connected to his successor as ranking member of the Senate Armed Services Committee, Senator Sam Nunn, benefited from an unexpected rise in stock prices. Similarly, in Brazil, Claessens, Feijen, and Laeven (2007) found that firms that provided contributions to (elected) federal deputies experienced higher stock returns around election years. In other developing nations, political influence is usually obtained through a combination of kinship ties, political alliances, ethnic solidarity, or financial dealings between owners and political elites. Fisman (2001) showed that firms connected to the Suharto family in Indonesia experienced a negative shock to their stock values when rumors circulated that Suharto was experiencing seri- ous health problems. Similar rewards have also been documented for Malaysia (Johnson and Mitton 2003), and Pakistan, where Khwaja and Mian (2005) esti- mate that the cost of politically-motivated lending amounts to 0.3 to 1.9 percent of GDP. Faccio (2006) found that the phenomenon of current and former control- ling shareholders holding seats in legislatures or positions in national government is not confined to the developing world; in OECD countries politically-connected firms often represent significant portions of market capitalization. The paper is organized as follows. In Section 2 we present our model, and in Section 3 we characterize a partially pooling equilibrium of the game. In Section 4 we present the data and the empirical strategy. In Section 5 we present our results, and we conclude in Section 6. 2 The Model We develop a simple two-period private information voting model with three sets of players; politicians, firms and voters. There is a continuum of firms of measure one. The firms operate in different markets and they face the following downward sloping inverse demand curves p(y) = φ − y. (1) Peak demand, φ, depends on an exogenous factor ψ ∈ {d, D} (world market conditions), where d < D, as well as the ability of the incumbent government to deal with unfavorable market conditions at the macro level. This competence is not necessarily known by the incumbent ex ante, but is revealed to him when trying to handle the unfavorable market conditions. What is important 4
  • 5. for our argument, though, is that voters interpret the handling of the current crisis as a signal of the incumbent’s ability to handle a future crisis. That is, at least in the perception of the voters, there is an element of competence in governing the economy, and this competence is correlated over time. To keep the analysis simple, we assume that there are two levels of competence, λ ∈ {δ (less competent), 1 (more competent)} where δ < 1, and that individual competence doesn’t change over time. Overall peak demand is φ = ½ D if ψ = D dλ if ψ = d (2) The probability that ψ = d is given by η ∈ (0, 1) in both periods. We assume a simple production technology in which output depends linearly on the input of labour (l), and the productivity of the technology. y = l γ (3) The unit labor cost is assumed to be fixed and given by w. Firms start out with a given technology, but they have the option to upgrade by making an investment. The investment decision is given by γ, and γ ∈ {1, ˜γ} where ˜γ < 1 corresponds to the upgraded technology. To make the investment is costly, and the firm specific cost is given by kj, where subscript j denotes the particular firm. The distribution of investment costs is assumed to be uniform with full support between £ 0, ¯k ¤ . This investment can be thought of as a new production technology, the opening of a new plant, or the switching of production to a new product line for which labour is more productive. In addition the firms also face a fixed administrative and regulatory cost of doing business, corresponding to the costs associated with onerous start- up procedures and other barriers, delays in being granted licenses and permits, corruption or harassment by police or inspectors, and other methods potentially used by public officials to extract rents from businesses.1 This cost is set to c ∈ [0, ¯c], and it depends on government action and may vary across different firms. Voters care about consumption. We abstract from saving and borrowing, so utility depends only on current income. Income, in turn, is earned through an inelastic supply of labor in case of employment, while income is normalized to zero in case of unemployment. A voter’s expected income thus depends on the probability of her holding a job (since wages are fixed), something we assume to 1 Since 2004, the World Bank has benchmarked these costs in its annual series of Doing Business reports. 5
  • 6. depend on the total demand for labor in the economy, given by L.2 To capture other dimensions of voting behavior, we also include a valence characteristic capturing ideology, or charisma, into voters’ preferences. That is, we use a probabilistic voting model in which we assume that each voter’s relative prefer- ence for the current incumbent also depends on an individual specific term, bi, distributed across the population according to a uniform density function f (b) with support on [−1, 1], and a common factor, z, drawn from a uniform distri- bution g (z) with support on £ −1 2 , 1 2 ¤ . This yields the following specification of a voter’s utility of retaining the current incumbent u (L2 (·)) + bi + z, (4) where L2 (·) is the actual (ex post) aggregate level of employment in period 2. As mentioned above, politicians can be of two types, λ ∈ {1, δ}, differing in their ability to keep up demand in the presence of a negative economic shock. We assume that all politicians are drawn from a common pool, with the probability p of getting λ = 1. Politicians care about the rents from being in office, R. These rents are assumed to be increasing with the total fixed costs of doing business, denoted by C, i.e. R(C) with R0 (C) > 0 and R00 (C) < 0. There are two ways to motivate this assumption. The first interpretation is to think of the costs of doing business as being the costs of bribes, something that directly benefits the politician. The second interpretation is that providing high quality public services and properly regulated markets requires effort, time and funds on behalf of the government, all which have an opportunity cost. The preferences of the political incumbent can therefore be represented by R (C1) + μ (·) R (C2) , (5) where subscripts stand for periods 1 and 2, and μ (·) is the endogenously de- termined probability of getting reelected. To simplify the model, we also follow 2 We implicitly assume that the number of capital owners is small enough relative to the number of workers in order to disregard the capital owners’ votes when calculating the outcome of the elections. Think of a small number of capital owners each controlling a fraction of the measure of firms and employing a large number of workers. 6
  • 7. the assumption of Besley and Burgess (2002) and assume that more compe- tent politicians do not act strategically, which in this case implies that they always set c = ¯c for all firms. This means that we are exclusively focusing on the incentives of the less competent politician to mimic the behavior of the more competent type, disregarding the incentives of the more competent type to separate himself. Note though, that incorporating those incentives would not alter the main result of the model. It would only imply that there may also exist separating equilibria in which it is the more competent, rather than the less competent, type that boosts employment levels to increase her chances of reelection. One can thus think of this assumption as an admittedly ad hoc argument of equilibrium selection in a more general model that can have also a separating equilibrium. There are several sources of incomplete information in the model. The in- cumbent government does not know the realization of the common shock to the preferences of the voting population. It follows that the government faces uncer- tainty with respect to the mapping between its actions and the outcome of the election, it only knows in which direction an action influences its probability of winning. More importantly, though, the incumbent government’s type is private information. Voters can only observe the realization of ψ and the aggregate em- ployment level, L. This would be enough, though, to tell the type if the govern- ment had no ability to affect firms’ employment decisions, since firms’ optimal employment levels will depend on aggregate demand which, in turn, depends on ψ and λ. However, a key assumption in the model is that the government can offer a subset (Γ) of firms a lower fixed cost of doing business, i.e. cj < ¯c, in ex- change for the firm carrying a larger than optimal workforce. More specifically, we assume that these firms have to carry an additional workforce proportional to their optimal level of employees. That is, if l∗ is the optimal workforce when managers have all the control rights, then these firms need to employ (1 + αj) l∗ , where αj > 0. We think of this deal as an "influence contract" where the firms’ costs of additional employees are compensated for by a lower burden of regula- 7
  • 8. tion, better provision of public services, and lower levels of required bribes.3 The more firms that are under this contract, the higher is the level of employment. If these contracts are unobservable by voters, then less competent governments will have incentives to use this tool to mimic the outcome of more competent governments, and thereby increase their chances of reelection. We follow the assumptions of Besley and Burgess (2002) that only a share of the voters ob- serve the employment level. These voters will update their beliefs according to ˜p = 0 whenever L (·) 6= L (λ = 1). We also assume that the size of informed voters is increasing as the gap between the current employment level, and that expected from a more competent politician is increasing.4 To be more spe- cific, we assume that the share of informed voters is σ (L (λ = 1) − L (·)), where L (λ = 1) is the employment level expected when a more competent politician is in office, while L (·) is the observed employment level. We also assume that σ (· | L (·) ≤ L (λ = δ, C = ¯c)) = 1, σ (· | L (·) ≥ L (λ = 1)) = 0, ∂σ(·) ∂L(·) ≤ 0, and that ∂2 σ(·) ∂2L(·) ≥ 0. Note that the share of informed voters is equal to zero when L (·) = L (λ = 1), so we do not need to specify expectations of informed voters in this case. However, we need to specify that uninformed voters base their decisions on their priors, so ˜p = p in this case. The politician’s strategy is thus a vector, {Γ, αj, cj}. In principle a certain level of employment can be achieved through many variations of the number of influential firms and the extra labor requirement, giving rise to many potential equilibria. We do assume, though, that there is a fixed cost for the politician of writing a contract, and that this cost is high enough to make the politician prefer to sign contracts with as few firms as possible. It follows that the contracts will maximize employment within each firm, which is achieved by setting c = 0 (the lower bound). The timing of events is as follows. In the beginning of period 1, nature draws the demand for the firms’ products, ψ ∈ {D, d}. If ψ = d, then the 3 We are giving the government all the bargaining power here, but in priciple one could think of a bargaining game between the firms and the government determining the allocation of the common surplus from the deal. This would not change any of the results, though. 4 This can be motivated by the increased publicity given to unemployment figures when they are perceived as high relative to expectations. 8
  • 9. incumbent, and only the incumbent, observes his ability to deal with the shock, and based on that determines the terms and coverage of eventual influence contracts, {Γ, αj, cj}. After that firms decide whether to make the investment in the new technology or not, and how much labour to employ and how much to produce, © yj, γj.lj ª . Informed voters then update their beliefs about the type of the incumbent based on ψ and L, and cast their vote sincerely. In the second period there is no election, so only the first three events are repeated before utility is realized. We solve the game for a perfect Bayesian equilibrium. 3 A Partially Pooling Equilibrium In this section we characterize an equilibrium of the game in which a less compe- tent period 1 incumbent offer influence-contracts to reduce the unemployment level and thereby increase his chances of reelection. The case we focus on is thus the one in which ψ1 = d and λ1 = δ. We refer to this equilibrium as partially pooling since, following our assumptions of voters’ information, the less competent type will not necessarily fully mimic the employment level of the more competent type. Before defining an equilibrium, the following notation is introduced to simplify the exposition. π∆ (˜γ, ψ, λ) ≡ (φt − ˜γw) 2 4 − (φt − w) 2 4 (6) U∆ (δ | d) ≡ U (L (d, 1)) − U (L (d, δ)) (7) Equation 6 defines the increase in variable profits (short of the investment cost) from making the investment, i.e. the benefit of the higher productivity. Equa- tion 7 defines the gain in utility from having a more rather than less competent politician when ψ = d. Definition. There exists a partially pooling perfect Bayesian equilibrium with the following strategies and beliefs if ˜γ ≥ φt 2w . 9
  • 10. i) Firms maximize their profits by setting l∗ jt = (1 + αjt) γjt ³ φt−γjtw 2 ´ y∗ jt = (1 + αjt) ³ φt−γjtw 2 ´ γ∗ jt = ⎧ ⎨ ⎩ 1 if kj > ³ 1 − (αjt) 2 ´ π∆ (˜γ, ψ, λ) ˜γ if kj ≤ ³ 1 − (αjt) 2 ´ π∆ (˜γ, ψ, λ) ii) The politicians choose their policy vectors according to α∗ jt = ⎧ ⎨ ⎩ 2 √ ¯c (φt−γjtw) if j ∈ Γt 0 otherwise c∗ jt = ⎧ ⎨ ⎩ 0 if j ∈ Γt ¯c otherwise Γ∗ = ⎧ ⎪⎨ ⎪⎩ arg max Γ R ((1 − Γ) ¯c) + ¡1 2 − ηpU∆ (δ | d) σ (L (1) − L (· | δ)) ¢ R (¯c) if t = 1 ∅ if t = 2 iii) Voters vote to reelect the incumbent iff bi ≥ ηpU∆ (δ | d) − z if informed bi ≥ −z if uninformed iv) The voters update their beliefs according to ˜p = ⎧ ⎨ ⎩ 0 if L (·) 6= L (λ = 1) is observed p otherwise To see why this is an equilibrium, we solve the model by backward induction. The purpose of the influence contracts is to boost employment prior to elections. There are no elections in period 2, so irrespective of the type of government, the share of firms offered influence contracts (Γ) is set to zero, and c∗ j2 = ¯c and α∗ j2 = 0 ∀ j. The firms’ cost functions are given by wγjtyjt + cjt + kj, (8) 10
  • 11. where kj = 0 if γj = 1. A firm’s optimal quantity and labour input are therefore given by the following maximization Max yjt (φt − yjt) yjt − wγjtyjt − cjt − kj. (9) This yields the following results for period 2 y∗ j2 = (φ2−γj2w) 2 , l∗ j2 = γj2(φ2−γj2w) 2 π∗ j2 = (φ2−γj2w)2 4 − ¯c − kj . (10) What can be noted from these results are that the expected quantities produced as well as the expected level of employment, and thereby consumer utility, de- pend on the type of the politician through its impact on φ. This is what drives forward-looking voters in period 1 to condition their voting behavior on their perceptions of the type of the period 1 incumbent. A firm will choose to invest in period 2 if the productivity gains from doing so exceed the direct costs. This condition is given by (φ2 − ˜γw) 2 4 − ¯c − kj ≥ (φt − w) 2 4 − ¯c. (11) Solving for kj and using the definition in equation (6) yields kj ≤ ˜k (λ) = π∆ (˜γ, ψ, λ) (12) There are two groups of voters in period 1, informed and uninformed. In- formed voters observe the actual employment level and realize that any L (·) 6= L (λ = 1) implies that the incumbent must be less competent, so updated be- liefs are given by ˜p = 0. Based on these beliefs, the informed voters will vote on the candidate that yields them the highest expected utility in period 2. An informed voter will vote to reelect the current incumbent if and only if (1 − η) u (L (D)) + ηu (L (d, δ)) + bi + z (13) ≥ (1 − η) u (L (D)) + η (pu (L (d, 1)) + (1 − p) u (L (d, δ))) . This can be simplified as bi ≥ ηpU∆ (δ | d) − z, (14) 11
  • 12. where U∆ (δ | d) is defined in equation (7). It follows that the share of informed voters supporting the current incumbent is given by5 1 − ηpU∆ (δ | d) + z 2 (15) Uninformed voters do not have any information on which to update their beliefs about the period 1 incumbent, so the incumbent and the opponent are expected to generate the same level of employment in period 2. The uninformed will thus base their voting only on the valence characteristics. The share of uninformed voters that support the less competent incumbent is therefore 1 + z 2 . (16) The total support is thus σ (L (λ = 1) − L (·)) 1 − ηpU∆ (δ | d) + z 2 + (1 − σ (L (λ = 1) − L (·))) 1 + z 2 , (17) which can be simplified as 1 + z 2 − σ (L (λ = 1) − L (·)) ηpU∆ (δ | d) 2 . (18) The probability that the incumbent wins the election is then given by the prob- ability that this vote share is greater than 1/2, which is μ (·) = 1 2 − σ (L (λ = 1) − L (·)) ηpU∆ (δ | d) . (19) Note that the probability of winning the election is increasing in L (·). Firms maximize profits based on the constraints they face. Firms that are not bounded by an influence contract will solve the same problem as all firms face in period 2. This yields the same outcomes as shown in equation (10), except that φ2 can be replaced by δd. Firms bounded by an influence contract benefit from zero fixed costs of doing business, but on the other hand have to 5 We do throughout assume that parameter values are such that any expressions of proba- bilities fall within the open set (0, 1), i.e. that ηpU∆ (δ | d) < 1 2 . 12
  • 13. take on a suboptimal number of employees. Profit maximization yields y∗ j1 = (1 + α) (δd−γj1w) 2 , l∗ j1 = (1 + α) γj1(δd−γj1w) 2 π∗ j2 = ³ 1 − (α)2 ´ (δd−γj1w)2 4 − kj , (20) and firm j will invest if kj ≤ ˜k (α, λ) = ³ 1 − (αjt) 2 ´ π∆ (˜γ, d, δ) . (21) Equation (21), in comparison with equation (12) yields the main result of the model: ˜k (α, λ) < ˜k (λ), i.e. a randomly drawn influential firm is less likely to make an investment than a non-influential firm. The period 1 incumbent sets {αj1, cj1, Γ1} to maximize his expected utility, as given by period 1 rents plus the probability that he wins the elections times period 2 rents. The assumption that there is a high cost of writing a contract implies that cj = 0 ∀j ∈ Γ1, whereas cj = ¯c ∀j /∈ Γ1. The incumbent will then set αj for influential firms such that they just accept the contract, i.e. such that they are just as well off with as without a contract. This implies that ³ 1 − (αj) 2 ´ ¡ δd − γj1w ¢2 4 − kj = ¡ δd − γj1w ¢2 4 − kj − ¯c. (22) Solving for αj yields αj1 = ⎧ ⎨ ⎩ 2 √ ¯c (δd−γj1w) ∀j ∈ Γ1 0 ∀j /∈ Γ1 (23) Finally, the incumbent sets Γ to trade off the period 1 losses from a larger share of influential firms against the gains from an increased probability of reelection. arg max Γ R ((1 − Γ) ¯c)+ µ 1 2 − ηpU∆ (δ | d) σ (L (λ = 1) − L (α1j, Γ | λ = δ)) ¶ R (¯c) (24) Following the previous assumptions, what remains to guarantee the existence of a unique max-point is to show that total employment in period 1, L (α1j, Γ | λ = δ), is weakly increasing in Γ and that U∆ (δ | d) > 0. Total employment in period 13
  • 14. 1 is given by L = Γ "˜k(α,λ)R 0 (1 + α) ˜γ (δd − ˜γw) 2 f (k) dk + ¯kR ˜k(α,λ) (1 + α) (δd − w) 2 f (k) dk # + (1 − Γ) "˜k(λ)R 0 ˜γ (δd − ˜γw) 2 f (k) dk + ¯kR ˜k(λ) (δd − w) 2 f (k) dk # (25) This expression is increasing in Γ as long as the first bracket, representing em- ployment within influential firms, is larger than the second bracket, representing employment within non-influential firms. This is not necessarily true, despite the extra employment condition, because fewer influential firms will choose to invest. It follows that if employment is higher in firms choosing not to invest then the overall difference in employment is uncertain. However, a sufficient condition to guarantee that the expression in the first bracket is greater than that in the second bracket is that employment within investing firms is not lower than that in non-investing firms. This condition requires that l∗ (˜γ) = ˜γ (δd − ˜γw) 2 ≥ (δd − w) 2 = l∗ (1) . (26) Note first that l∗ (˜γ) = l∗ (1) when ˜γ = 1. It is straightforward to show that l∗ (˜γ) is concave in γ with a max-point at γ∗ = δd/2w. Thus, l∗ (˜γ) is strictly decreasing as γ is increasing beyond this point. It follows that as long as ˜γ ≥ δd/2w then l∗ (˜γ) > l∗ (1). This is the condition given in Definition 1. Note that this is a sufficient but not a necessary condition. There exists an equilibrium as defined above also when l∗ (˜γ) < l∗ (1) for some parametrizations of the other variables, but not necessarily for all. The condition U∆ (δ | d) > 0 requires that L (d, 1) > L (d, δ), or ˜k(1)R 0 ˜γ (d − ˜γw) 2 f (k) dk + ¯kR ˜k(1) (d − w) 2 f (k) dk > ˜k(δ)R 0 ˜γ (δd − ˜γw) 2 f (k) dk + ¯kR ˜k(δ) (δd − w) 2 f (k) dk. (27) Once again this is not generally true, because more firms will choose to invest with a more competent politician in power. If investing firms hire fewer workers, 14
  • 15. then it is possible that that effect dominates the positive overall effect on hiring from increased demand. However, under the assumption above, investing firms will hire at least as many workers as non-investing, and the inequality above holds. This concludes the proof of the definition above. The game we have presented offers a potential theory of cronyism, built around an elite exchange in which the political incumbent provides favoured firms with a better business environment in exchange for some control rights over employment decisions. The main result of the model is that more influential firms are less likely to invest in a new technology, new plant or production line that increases labour productivity. However, this result obviously relies on the particular structure of the model developed to capture the logic of the elite exchange. To more seriously test our model we therefore bring the following three hypotheses to the data. More influential firms will; i) face a better business environment, ii) enroll an excessive number of employees, iii) invest and innovate less. The first two of these more closely correspond to key assumptions, whereas the third hypotheses is a result. 4 Data and Methodology The preceding section hypothesized that greater political influence among firms should produce three outcomes of interest. First, influential firms are less likely to face the types of constraints to, and costs of, doing business that their less- influential counterparts would normally face. Second, influential firms are more likely to serve as a source of politically valuable benefits, in particular in the form of employment. Third, influential firms are less likely to invest and innovate than non-influential firms. To determine whether these hypotheses are empirically justified we rely on the World Bank’s Enterprise Surveys (formerly the Productivity and Investment Climate Surveys), which in total has collected data from approximately 50,000 manufacturing and service firms in over 60 developing countries conducted since 2000. For our purpose, we focus on 26 countries in the former Soviet Union and 15
  • 16. Central and Eastern Europe. This data set, expansive in its cross-country cov- erage, does not contain the type of information that would allow us to measure actual political connections, namely, detailed information on owners or officers that could be used to assess their political identities. Instead, the Enterprise Surveys contains several perception-based questions about the political influ- ence of firms in shaping national policies affecting their businesses. Moreover, questions on political influence were dropped from the core questionnaire after 2005. The subset of this total sample of firms who have coded responses for questions of political influence, therefore, is smaller–less than 5,000 firms in our set of countries between 2000 and 2005. 4.1 Measuring Firm-Level Characteristics with Subjective Data The problems of comparability when respondents are asked to use ordinal re- sponse categories are well known. Different respondents may interpret concepts such as “influence” in vastly different ways based on unobservable character- istics (“culture,” socialization, etc.). Ordinal scales may mean different things to different respondents based on idiosyncratic factors such as mood or overall optimism. Sometimes referred to in educational testing as “differential item functioning” (DIF), the problem is particularly acute in measurements of po- litical efficacy, where the actual level of efficacy may differ from the reported level due to individual-specific proclivities (King and Wand 2007). Firm-level perceptions of influence would similarly be affected by DIF where identical firms may have unequal probabilities of answering questions about their own political influence in the same way. Explicit “anchoring vignettes” or other hypothetical questions to establish baselines that could normally correct survey responses for inter-firm incompa- rability, however, are not included in the Enterprise Surveys core questionnaire. We rely, then, on two corrections. First, to measure influence we use four related categories to a perception-based question from the core questionnaire: 16
  • 17. How much influence do you think the following groups actually had on recently enacted national laws and regulations that have a substantial impact on your business? A: your firm; B: other domes- tic firms; C: dominant firms or conglomerates in key sectors of the economy; D: individuals or firms with close personal ties to political leaders. Each answer ranges from 0 (no impact) to 4 (decisive influence). We take the sum of the differences between the self-assessment A and the assessments of other groups, i.e., A — (B + C + D)/3, which yields a measure of the perceived influence “gap” between the responding firm and other types of firms.6 Our measure of influence ranges from -4 to +4. As with survey “anchors”, assess- ments of others are subject to less inter-firm variation than self-assessments, and thus we use responses to questions about other groups to subtract off the DIF from the self-assessment question. This is, of course, an imperfect solution to the problem of potential in- comparability when other variables with ordinal-response categories are being regressed on our measure of influence. In cases where our outcome of interest is perception-based, our second solution is to include among the regressors a proxy for firm-specific systematic bias. Previous analyses of business environment con- straints using Enterprise Surveys data have shown that the interpretation of (subjective) outcomes is complicated by the fact that some managers simply tend to have a high propensity to complain, regardless of the actual constraints their businesses may face (Carlin, Shaffer, and Seabright 2006). Inclusion of a variable among regressors that proxies this propensity, then, can correct for in- comparability in perception-based outcomes. For this purpose we use responses by managers to questions about the degree to which their firms’ activity is con- strained by two things: the macroeconomic environment and economic policy uncertainty. We assume that firms within the same country and the same in- 6 We difference firms’ self perceptions with their average perceptions regarding three other groups (other firms, other conglomerates, and other politically-connected firms) rather than simply “other domestic firms” to reduce the effect of biased perceptions towards any particular category of firms. 17
  • 18. dustry are likely to face, objectively, a very similar macroeconomic environment as well as policy uncertainty. The distribution of responses to these questions should therefore closely proxy the distribution of the propensity to complain among the management within our sample. The range for each question is 0 (no obstacle) to 4 (very severe obstacle). Our proxy for firm-specific systemic bias is the sum of these responses. 4.2 Specification and Methods Our basic specifications take the following form: Rj = f (χωωj, χθθj, χxxj) (28) where R is the hypothesized “crony” outcome for firm j specified in the preceding section (firm j faces better business environment; firm j provides po- litically valuable benefits; firm j invest or innovate less), ω is our measure of the relative influence of firm j, θ is the firm-specific systematic bias of firm j as described above, x is a vector of firm-specific control variables, and χ are vectors of coefficients. The firm-specific characteristics we include are: the age of the firm (in years), the number of permanent employees (log scale, lagged one year), dummy variables identifying whether the firm is an exporter, whether the firm is majority owned by a domestic company or individual (vs. a foreign entity), and whether the firm is a state-owned enterprise. In addition, we include the follow- ing sets of dummies in all specifications (though their results are not reported in the tables): a legal-status effect (identifying whether the firm is publicly listed, privately held, a cooperative, sole proprietorship, or partnership), a location effect (identifying whether the firm is located in the capital city, in a city with more than 1 million, 250,000 to 1 million, 50,000 to 250,000, or less than 50,000 in resident population), industry dummies (ISIC 2-digit), survey-year dummies, and country dummies. All estimations also include a trend. Summary statistics for all variables used in our analysis are in table 1.7 7 We have also tested if including a dummy specifying wether the firms have ever been publicly owned makes a difference. The motivation is that newly privatized firms may maintain 18
  • 19. Our basic specifications are estimated using OLS or logit regressions de- pending on whether the outcome of interest is continuous or binary. Estimates of the causal effects of firm-level political influence, however, may be affected by selection bias due to the non-random character of “influential” vs. “non- influential” firms, whereby the distribution of covariates ω, θ, and x, may be very different for firms depending on their level of political influence. We there- fore correct for observable differences between influential/non-influential firms by pre-processing our data with matching methods, then re-running our para- metric analyses on the matched sub-sample of the data as recommended by Ho et al. (2007), and similar to the parametric bias-adjustment for match- ing by Abadie and Imbens (2006). We compute coefficients on all independent variables after matching rather than reporting the simple difference in means without controlling for potential confounding variables. The purpose of match- ing here, of course, is to ensure that influential firms are as close as possible to non-influential firms in terms of relevant covariates, a method analogous to severing the links between explanatory covariates and likelihood of “treatment” in observational data. We rely on exact matching based on the following model Pr (Influence = 1) = Φ ³ ˆβθθj + ˆβxxj + ˆβLLobbyj ´ , (29) where Influence = 1 [Influence = 0] occurs when a firm is [is not] able to influence national policies affecting its business. We designate firms as influential if their influence score as calculated above is greater than zero. Φ is the standard normal distribution function, θ is the firm-specific bias, and x is a vector of firm-specific indicators—age of the firm, number of permanent workers, legal-, location-, sector-, year-, and country-dummies, as well as additional dummies specifying whether the firm is an exporter, domestically-owned, or state-owned. To this we add an additional dummy not used in our other regressions: whether, in the past two years, the firm has sought to lobby the government or otherwise close political connections, while struggling with the legacy of public ownership in terms of bloated payrolls and inefficient business practices. Including this dummy does not change any of our results, though. 19
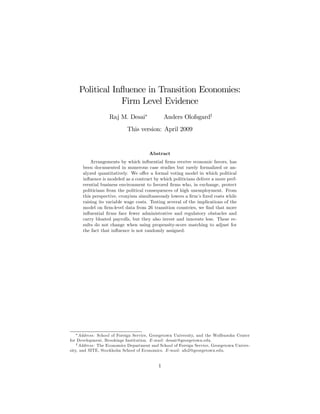
  • 20. influence the content of laws or regulations affecting the firm’s business. Tests of matching balance are shown in table 2. We perform exact matching using a propensity score derived from a logit regression of (29), which generates a conditional “treatment” probability–in this case, the conditional probability of being an influential firm. As mentioned above, propensity score matching adjusts for pre-treatment observable differences between treated and control samples. Without matching, the means of influential and non-influential sam- ples of firms are distinct as seen in T-tests. After matching, however, we can no longer reject the null hypothesis of equality of means between influential and non-influential firms, suggesting that propensity-score matching reduces imbal- ance between these samples. 5 Results Before showing regression results, some summary statistics are given in Ta- ble 1, whereas Figure 1 displays the means and variances of influence across the 26 countries. The most meaningful measure is the variance, a higher vari- ance suggesting that there are more firms perceiving themselves as being very influential/non-influential in relative terms. As shown in Figure 1 there is some variation both in means and in the variance across the sample. We calculated the mean in variance in the group of former Soviet-Union countries and com- pared that to the mean in variance for the other countries, on the assumption that unequal influence is more of an issue in the former. The variance is in- deed slightly higher on average in the former Soviet Union countries, and the difference is statistically significant, but it is quite small. 5.1 Evidence for an elite exchange To look at evidence in favor of the elite exchange we look at benefits to influential firms, and indications that influential firms carry bloated payrolls. There is a certain asymmetry in our results in that we have much more evidence for the 20
  • 21. first part, but this is entirely driven by data availability. Table 3 examines two costs typically imposed on businesses in transition countries: bribes, and theft. Columns (1) to (4) examine bribes, both in total as a percentage of sales, and specifically for government contracts as a percentage of contract value. For each outcome we present, first the results from basic OLS regressions using the full sample, and then using only the matched sample of observations. In each specification, influential firms pay less in bribes both in general and for government contracts. With less consistency, we also find that older firms, state-owned companies, and foreign companies are better protected from bribe- collectors. We also include workers in quadratic form, and find that firms with more employees pay more in bribes (for government contracts) but the effect is diminishing. We include, but do not report legal status, location, industry, time, and country dummies.8 In columns (5) and (6) we examine the effect of political influence on losses from theft, robbery, arson, or vandalism. In this case we find no significant difference, indicating that crime take a toll on the politically-connected and ordinary in roughly similar ways. In table 4 we turn to firms’ subjective rankings of business constraints. Our dependent variables are averages of responses to questions about the severity of five categories of constraints: infrastructure (telecommunications, electricity, and transportation), taxation (both rates and the administration of), regula- tions (including customs, licensing, and permits), finance (cost and access), and the legal system (anti-competitive practices, crime, and the efficacy of the legal system). In each case we coded these variables 1 if the obstacle was considered “major” or “severe,” 0 otherwise. To these five indicators we add a sixth, based on firm responses to a question of how customers would respond were the firm to raise prices of their main product or service by 10%. We code this outcome 1 if firms state that there would be no change in customer behavior, 0 otherwise.9 8 It is always possible that influential firms pay more bribes because they have more ex- tensive dealings with public officials than non-influential firms. We find no evidence for this disparity. We estimated the percentage of "senior management’s time spent in dealing with requirements imposed by government regulations" based on the benchmark specification in table 3, and find that influence has no statistically significant effect. 9 Firms were given four choices of responses: A: customers would continue to buy at the same quantities; B: customers would continue to buy but at slightly lower quantities; C: 21
  • 22. The results of logit regressions are summarized in table 4. For simplicity we only report the coefficient on influence across estimations. All outcomes, how- ever, were estimated using the full specification in (28), including firm-specific systematic bias, on both unmatched and matched samples. We also report pseudo R2 and prob. > χ2 values from the full estimations. Infrastructural constraints actually affect influential firms slightly more, though the results are significant only at the ten percent level. But all other constraints are decid- edly more severe for non-influential firms. Influential firms are also more likely to face a situation where price hikes do not change their customers’ behavior. This suggests that another benefit of influence over laws and regulations is that influential firms get shielded from competition. As mentioned previously, the allocation of credit to privileged firms on “soft” terms is considered one of the central instruments of crony capitalism. In ta- ble 5 we investigate whether influential firms have easier access to credit. As with the previous table, we estimated our full model on both unmatched and matched samples, but we only report the coefficients and standard errors for the influence variable. Here we examine four outcomes: (i) whether collateral was required for the most recent loan (for firms that obtained loans); (ii) the cost of the collateral (as a percentage of loan value); and the percentage of (iii) working capital and (iv) new investments financed by “informal sources” (money-lenders or other informal financial institutions). For the first outcome– the collateral requirement–we use logit regressions, while for all others we rely on OLS. Consistently, influential firms appear to have easier access to credit. Unsurprisingly, influential firms are less likely to be asked to collateralize loans by lenders. Among firms that do provide collateral or a deposit for their financ- ing, the more influential firms typically have to cover less of their loans than less influential firms. And influential firms are less entwined in the informal financial sector. As mentioned in the introduction, an inordinate amount of attention has customers would continue to buy but at much lower quantities; and D: customers would stop buying. 22
  • 23. focused on the benefits of political influence that accrue to the firms them- selves, while far less is understood in terms of the specific types of rents or political rewards politicians can extract from cronyism. In table 6 we exam- ine evidence of the high-employment guarantees implicit in the firm-politician relationship. Recall that in the partially-pooling equilibrium, political leaders who find themselves less able to handle negative economic shocks rely instead on influence contracts, a component of which involves firms keeping excess la- bor in exchange for lowered costs of business. Columns (1) and (2) present logit results for unmatched and matched samples, respectively, of estimating the effect of political influence on excess employment. Firms were asked, if they could change the number of full-time workers without restriction or punishment, whether they would shrink their payrolls. We code responses 1 or 0 depending on whether firms reported they would lay off workers. In columns (1) and (2), in addition to the variables included in the basic specification, we also include firms’ capacity utilization, on the assumption that use of installed productive capacity can affect firm managers’ preferences regarding optimal employment levels. We find that influential firms are more likely to maintain excess labor than non-influential firms. 5.2 Consequences of political connections Our last set of results addresses the question, indirectly, of enterprise dynamism and performance. Rewards in the form of lowered costs of business, monopoly rents, and other benefits are often justified by developing country governments as a de facto form of targeted industrial policy, on the assumption that most politically-connected firms use these benefits to invest and innovate, and that these influential forms are also the most dynamic. However, our model suggests that the opposite may be true; more influential firms are less likely to invest and innovate if the price for influence is to give up control rights over employment decisions. We examine this relationship in table 5. Firms were asked a series of questions on their restructuring activities and 23
  • 24. innovation. Table 7 shows the results of estimations in which the dependent variables are a set of innovation/restructuring outcomes: whether, in the past three years, the firm opened a new plant, introduced a new product line, closed an old plant, or closed an obsolete product line. While there are valid concerns regarding the comparability of "newness" or "obsolescence" across firms in dif- ferent countries and in different industries, the inclusion of industry and country dummies should correct for these differences. As in table 4, we only report co- efficients and standard errors for the influence variable, for estimations using both unmatched and matched samples. Once again, influential firms display a certain consistency: they are less likely to open a new facility, or to introduce or close out product lines. In the regression on the probability of closing an old facility, influence has the expected sign, but is not statistically significant. 6 Conclusions We argue that cronyism in business-government dealings in transition economies takes a specific form: an influence contract between firms and politicians whereby the former relinquish a portion of control rights over employment decisions in ex- change for a more favorable business environment. This exchange affects firms’ costs of doing business as well as certain operating decisions. In particular, we suggest that privileged firms benefit through lower fixed costs, while also facing higher variable costs through increased payrolls. The important consequence of that is that influential firms are less likely to make investments that increase labour productivity because they are unable to reap all the benefits from it. Our model is generally supported by evidence from approximately 5,000 firms in 26 countries in the former Soviet Union and central and Eastern Europe. We find that influential firms pay smaller bribes, enjoy regulatory forbearance, monopoly rights, and preferential access to credit, and face weaker obstacles to doing business than less-influential firms. In return, influential firms provide politicians with political benefits in the form of higher employment, through overstaffing. Finally, and most importantly, the influential firms are less likely 24
  • 25. to open new product lines or production facilities or close obsolete ones, sug- gesting that influence, though beneficial in the short run, may inhibit long run dynamism and productivity. Our results thus refute the claim, occasionally repeated in commercial or eco- nomic development ministries in developing countries, that selective industrial policy typically is an efficient instrument to promote innovation, technological progress and productivity in developing countries (e.g. Khan 2000). In practice, the lack of competitive pressure and the meddling of political considerations in management decisions (in particular employment) create more disincentives, than the otherwise favorable business environment creates incentives, for in- novation and long-term investments. This is important since it suggests that cronyism carries a welfare cost not only by distorting competition and eroding trust in the fairness and honesty of the political system, but also by hampering the long run development even of the firms that stand to gain in the short run. Our results also argue against the view that bribes are an instrument of influence-peddling by private sector elites. Rather, our findings suggest that bribe taxes are used by the public sector to extort payments from weak or vulner- able enterprises. This is consistent with a bargaining framework for bribe-paying in which political connectedness can increase firms’ relative bargaining power in dealing with public officials (Svensson 2003). High-level connections shield firms from predatory behavior by rank and file administrators. These findings suggest a need to make a clear distinction between cronyism and administrative corruption in the literature; they serve different purposes and involve different segments of the public and private sectors. References [1] Abadie, A. and G. W. Imbens (2006), "Large Sample Properties of Match- ing Estimators for Average Treatment Effects" Econometrica 74, 235-67. 25
  • 26. [2] Agrawal, A. and C. R. Knoeber (2001), “Do some outside directors play a political role?” Journal of Law and Economics 44, 179—198. [3] Ang, J. and C. M. Boyer (2000), “Finance and politics: special interest group influence during the nationalization and privatization of Conrail” working paper, Florida State University. [4] Aslund, A., P. Boone, and S. Johnson (2001), “Escaping the Under-Reform Trap”, IMF Staff Papers 48, 88 — 108. [5] Bertrand, M., Kramarz, F., Schoar, A., and D. Thesmar (2004), "Politi- cally Connected CEOs and Corporate Outcomes: Evidence from France", mimeo. [6] Besley, T. and R. Burgess (2002), "The Political Economy of Government Responsiveness: Theory and Evidence from India", Quarterly Journal of Economics 117, 1415-1451. [7] Campos, N. and F.Giovannoni (2006), "Lobbying, Corruption and Political Influence", IZA Discussion Paper 2313. [8] Carlin, W., Schaffer, M. E. and P. Seabright (2006),."Where Are the Real Bottlenecks? Evidence from 20,000 Firms in 60 Countries About the Shadow Costs of Constraints to Firm Performance", CEPR Discussion Pa- pers 5719. [9] Choi, J. P. and M. Thum (2007), "The Economics of Politically Connected Firms", CESifo Working Paper 2025. [10] Chong, A. and M. Gradstein (2007), "On the Determinants and Effects of Political Influence", Inter-American Development Bank Working Paper 616. [11] Claessens, S., Feijen, E. and L. Laeven (2007), "Political Connections and Preferential Access to Finance: The Role of Campaign Contributions", CEPR Working Paper, London. 26
  • 27. [12] Desai, P., and T. Idson (2000), "Work without Wages: Russia’s Nonpay- ment Crisis", MIT Press, Cambridge, Mass. [13] Faccio, M. (2006), "Politically Connected Firms", American Economic Re- view 96, 369-386. [14] Fidrmuc, J. (2000a), "Political Support for Reforms: Economics of Voting in Transition Economies", European Economic Review 44, 1491-1513. [15] Fidrmuc, J. (2000b), "Economics of Voting in Post-Communist Countries", Electoral Studies 19, 199-217. [16] Fisman, R. (2001), "Estimating the Value of Political Connections", Amer- ican Economic Review 91, 1095-1102. [17] Frye, T. (2002), "Capture or Exchange? Business Lobbying in Russia", Europe-Asia Studies 54, 1017-1036. [18] Frye, T. and A. Shleifer (1997), "The Invisible Hand and the Grabbing Hand", American Economic Review 87, 354-358. [19] Gehlbach, S. (2006), "The Consequences of Collective Action: An Incomplete-Contracts Approach", American Journal of Political Science 50, 802-823. [20] Gonzalez, A., J. E. Lopez-Cordova, and E. E. Valladares (2007), "The Incidence of Graft on Developing-Country Firms", working paper, World Bank, Washington DC. [21] Haber, S., ed. (2002), "Crony Capitalism and Economic Growth in Latin America: Theory and Evidence," Hoover Institute Press, Stanford, Calif. [22] Hellman, J., G. Jones, and D. Kaufmann (2003), "Seize the State, Seize the Day: State Capture and Influence in Transition Economies", Journal of Comparative Economics 31, 751-73. [23] Hellman, J. and D Kaufmann (2003), "The Inequality of Influence", mimeo. 27
  • 28. [24] Ho, D. E., Kosuke, I., King, G. and E. A. Stuart (2007), "Matching as Non- parametric Preprocessing for Reducing Model Dependence in Parametric Causal Inference", Political Analysis 10.1093/pan/mpl013. [25] Johnson, S. and T. Mitten (2003), "Cronyism and Capital Controls: Evi- dence from Malaysia", Journal of Financial Economics, 351-382. [26] Khan, M. H. (2000), "Rents, Efficiency and Growth", in Khan, M. H. and K. S. Jomo (eds) rents, Rent-seeking and Economic Development: Theory and Evidence in Asia, Cambridge University Press, Cambridge, Massa- chusetts. [27] Khwaja, A. I. and A. Mian (2005), "Do Lenders Prefer Politically Con- nected Firms? Rent Seeking in an Emerging Financial Market", Quarterly Journal of Economics 120, 1371-1411. [28] King, G. J. Wand (2007), "Comparing Incomparable Survey Responses: Evaluating and Selecting Anchoring Vignettes", Political Analysis 15, 46- 66. [29] Mach, B. W. and J. E. Jackson (2006), "Employment Change, Attitude Evolution and Voting during Poland’s transition: Longitudinal Evidence", European Journal of Political Economy, 22, 472-502. [30] Pinto, B., V. Drebentsov, and A. Morozov (2000), "Dismantling Rus- sia’s Nonpayments System: Creating Conditions for Growth", World Bank Technical Paper 471, World Bank, Washington DC. [31] Roberts, B. (1990), "A Dead Senator Tells no Lies: Seniority and the Distribution of Federal Benefits", American Journal of Political Science 34, 31-58. [32] Robinson, J. and T. Verdier (2002), "The Political Economy of Clien- telism", CEPR Discussion Papers 3205. 28
  • 29. [33] Roland. G. (2000), "Transition and Economics", MIT Press, Cambridge, Massachusetts. [34] Shleifer, A. and R. Vishny (1994), "Politicians and Firms", Quarterly Jour- nal of Economics 109, 995-1026. [35] Shleifer, A. and D. Treisman (2000), "Without a Map", MIT Press, Cam- bridge, Massachusetts. [36] Slinko, I., E. Yakovlev, and E. Zhuravskaya (2005), "Laws for Sale: Evi- dence from Russia", American Law and Economics Review 7, 284-318. [37] Stoner-Weiss, K. (2006), "Resisting the State: Reform and Retrenchment in Post-Soviet Russia", Cambride University Press, New York. [38] Svensson, J. (2003), "Who Payes Bribes and How Much? Evidence from a Cross-Section of Firms", Quarterly Journal of Economics 118, 207-30. 29
  • 30. 30 Figure 1: Variance of influence ‐5 ‐4 ‐3 ‐2 ‐1 0 1 2 3 4 5 Slo vakia Tajikistan C zech Lith u an ia M aced o n ia R o m an ia U krain e A rm en ia Esto n ia Serb ia A lb an ia Slo ven ia C ro atia H u n gary B elaru s M o ld o va B o sn ia U zb ekistan B u lgaria R u ssia G eo rgia Kyrgyzstan K azakh stan P o lan d A zerb aijan K o so vo A ve rage In flu en ce  Sco re Notes: Graph shows countries ordered by dispersion of the average influence score; top and bottom of boxes are means plus and minus one standard deviation, respectively. Top and bottom of lines are country maxima and minima, respectively.
  • 31. 31 Table 1: Summary Statistics Variable Obs Mean Std. Dev. Min Max Influence 4889 -0.95 1.20 -4 4 Age 4889 18.39 18.28 4 206 Exporter 4889 0.19 0.39 0 1 Domestic 4889 0.84 0.37 0 1 State-owned 4889 0.11 0.31 0 1 Bias 4889 3.70 2.00 0 8 Lobby 4877 0.24 0.43 0 1 Workers 4889 3.24 1.74 0.69 9.21 Capacity Utilization 4799 79.37 20.38 3 100 Bribes (% sales) 4516 1.67 3.35 0 50 Bribes for Government Contracts (% of contract value) 4483 1.96 4.66 0 50 Theft Losses (% sales) 4508 1.02 4.41 0 95 Opened New Plans 4857 0.15 0.36 0 1 Opened New Product 4865 0.40 0.49 0 1 Closed Old Plant 4852 0.12 0.32 0 1 Closed Old Product 4858 0.22 0.42 0 1 Excess Labor 3695 0.56 0.50 0 1 Infrastructure 4828 0.04 0.20 0 1 Taxation 4889 0.33 0.47 0 1 Regulation 4551 0.14 0.34 0 1 Finance 4662 0.26 0.44 0 1 Legal System 4555 0.12 0.33 0 1 Monopoly Rights 4850 0.20 0.40 0 1 Collateral 2059 0.81 0.39 0 1 Cost of Collateral (% of loan) 1507 144.74 81.38 1 900 Informal Finance (% of working capital) 4800 1.18 7.48 0 100 Informal Finance (% of new investments) 3487 0.90 6.71 0 100
  • 32. 32 Table 2: Balance Testing for Matched and Unmatched Covariates Variable Sample Influential Non-influential T-test Age Unmatched 23.26 18.57 0.00 Matched 23.07 24.09 0.50 export 0.23 0.18 0.01 0.24 0.25 0.72 domestic 0.83 0.85 0.09 0.82 0.85 0.28 state 0.21 0.10 0.00 0.21 0.20 0.82 bias2 3.24 3.83 0.00 3.22 3.34 0.35 lobby 0.53 0.19 0.00 0.55 0.55 0.95 Notes: Results generated from exact propensity score matching using logit regression with legal-status, location, industry, time, and country dummies (not reported). Figures in italics are for the matched sub-sample. T-tests are of equality of means between non-influential and influential firms.
  • 33. 33 Table 3 (1) (2) (3) (4) (5) (6) Bribes (% of sales) Bribes for government contracts (% of contract value) Theft losses (% sales) Influence -0.205*** (0.042) -0.209*** (0.042) -0.353*** (0.059) -0.355*** (0.059) -0.034 (0.057) -0.038 (0.058) Age (years) -0.001 (0.003) -0.001 (0.003) -0.009** (0.004) -0.009** (0.004) -0.003 (0.004) -0.002 (0.004) Exporter -0.102 (0.136) -0.104 (0.138) 0.071 (0.193) 0.064 (0.195) 0.061 (0.187) 0.095 (0.189) Domestic 0.443*** (0.139) 0.455*** (0.141) 0.299 (0.198) 0.316 (0.199) 0.397** (0.190) 0.411** (0.193) State-owned -0.611** (0.271) -0.619** (0.277) -0.957** (0.385) -1.044*** (0.392) 0.091 (0.374) 0.049 (0.384) Workers -0.016 (0.111) -0.030 (0.113) 0.282* (0.159) 0.278* (0.160) -0.076 (0.152) -0.095 (0.155) Workers2 -0.015 (0.014) -0.013 (0.014) -0.050** (0.020) -0.049** (0.020) 0.001 (0.019) 0.004 (0.020) (Adjusted) R2 0.087 0.101 0.097 0.100 0.030 0.030 Observations 4717 4597 4681 4564 4716 4593 Notes: Results from OLS and 3SLS regressions, with legal-status, location, industry, time, and country dummies (not reported). Columns (1), (3), and (5) are OLS regressions on the unmatched sample. Columns (2), (4), and (6) are OLS regressions on the matched sample of observations. Exact matching is performed using a conditional propensity score. *** p < 0.01 ** p < 0.05 * p < 0.10.
  • 34. 34 Table 4 Dep. variable Coefficient Std. error Observations (1) Infrastructure 0.126* 0.067 4659 (2) 0.120* 0.067 4647 (3) Taxation -0.195*** 0.032 4889 (4) -0.194*** 0.032 4877 (5) Regulations -0.218*** 0.043 4451 (6) -0.215*** 0.044 4439 (7) Finance -0.111*** 0.033 4739 (8) -0.111*** 0.033 4727 (9) Legal -0.155*** 0.047 4545 (10) -0.153*** 0.047 4533 (11) Monopoly 0.146*** 0.033 4926 (12) 0.148*** 0.033 4914 Notes: Coefficients and standard errors on “influence” are reported. All regressions include, in addition to influence, the following variables: age of firm, exporter dummy, domestic dummy, workers (linear and quadratic), firm-specific bias, time trend, legal-status, location, industry, time, and country dummies. Figures in italics are for matched data using propensity-score matching based on logit model. *** p < 0.01 ** p < 0.05 * p < 0.10
  • 35. 35 Table 5 Dep. variable Coefficient Std. error Observations R-squared (1) Collateral required -0.166*** (0.055) 2134 0.164 (2) -0.159*** (0.056) 2082 0.166 (3) Cost of collateral (% of loan value) -3.451* (1.814) 1564 0.160 (4) -3.106* (1.827) 1529 0.160 (5) Informal finance (% of working capital) -0.178* (0.095) 5009 0.024 (6) -0.169* (0.097) 4884 0.025 (7) Informal finance (% of new investments) -0.176* (0.100) 3615 0.020 (8) -0.180* (0.101) 3545 0.020 Notes: Coefficients and standard errors on “influence” are reported. All regressions include, in addition to influence, the following variables: age of firm, exporter dummy, domestic dummy, workers (linear and quadratic), firm-specific bias, time trend, legal-status, location, industry, time, and country dummies. Figures in italics are for matched data using propensity-score matching based on logit model. Equations (1) and (2) show results from logit regressions, all other equations are OLS. *** p < 0.01 ** p < 0.05 * p < 0.10.
  • 36. 36 Table 6: (1) (2) Excess Labor Influence 0.106*** (0.033) 0.107*** (0.033) Age (years) -0.001 (0.003) -0.001 (0.003) Exporter 0.031 (0.105) 0.040 (0.105) Domestic 0.076 (0.103) 0.075 (0.103) State-owned 0.242 (0.229) 0.224 (0.231) Bias 0.033* (0.019) 0.033* (0.019) Workers 0.123 (0.085) 0.118 (0.086) Workers2 -0.021* (0.011) -0.021* (0.011) Capacity Utilization -0.000 (0.002) -0.000 (0.002) Observations 3675 3667 R2 0.067 0.067 Notes: Results from OLS regressions, with legal-status, location, industry, time, and country dummies (not reported). Column (1) is an OLS regression on the unmatched sample, (2) is on the matched sample. Exact matching is performed using a conditional propensity score. *** p < 0.01 ** p < 0.05 * p < 0.10.
  • 37. 37 Table 7 Dep. variable Coefficient Std. error Observations (1) New product -0.059** 0.029 4879 (2) -0.060** 0.029 4867 (3) New plant -0.139*** 0.040 4872 (4) -0.137*** 0.040 4860 (5) Closed product -0.148*** 0.034 4873 (6) -0.145*** 0.034 4861 (7) Closed plant -0.034 0.042 4859 (8) -0.033 0.042 4847 Notes: Coefficients and standard errors on “influence” are reported. All regressions include, in addition to influence, the following variables: age of firm, exporter dummy, domestic dummy, workers (linear and quadratic), time trend, legal-status, location, industry, time, and country dummies. Equations (1) – (8) also include firm-specific systemic bias. Figures in italics are for matched data using propensity-score matching based on a logit model. Estimation is by logit regressions. *** p < 0.01 ** p < 0.05 * p < 0.10.