QNBFS Daily Technical Trader Qatar - September 07, 2023 التحليل الفني اليومي ...
5 February Daily technical trader
1. COPYRIGHT: No part of this document may be reproduced without the explicit written permission of QNBFS Page 1 of 6
Daily Technical Trader – Qatar
Thursday, 05 February 2015
Stocks Covered Today
Ticker Price Target
NLCS 20.45 21.60
BRES 47.90 46.20
QSE Index
Level % Ch. Vol. (mn)
Last 12,415.93 1.1 13.3
Resistance/Support
Levels 1
st
2
nd
3
rd
Resistance 12,600 12,800 13,000
Support 12,350 12,250 12,000
QSE Index Commentary
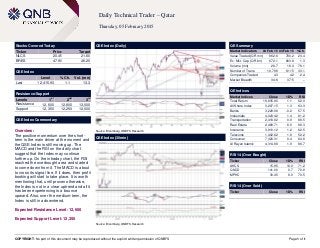
Overview:
The positive momentum over the short-
term is the main driver at the moment and
the QSE Index is still moving up. The
MACD and the RSI on the daily chart
suggest that the Index may continue
further up. On the intraday chart, the RSI
reached the overbought area and started
to come down from it. The MACD is about
to cross its signal line. If it does, then profit
booking will start to take place. It is worth
mentioning that, until proven otherwise,
the Index is not in a clear uptrend and all it
has been experiencing is a bounce
upward. Also, over the medium-term, the
Index is still in a downtrend.
Expected Resistance Level: 12,600
Expected Support Level: 12,350
QSE Index (Daily)
Source: Bloomberg, QNBFS Research
QE Summary
Market Indicators 04 Feb 15 03 Feb 15 %Ch.
Value Traded (QR mn) 962.6 780.2 23.4
Ex. Mkt. Cap. (QR bn) 672.1 663.8 1.3
Volume (mn) 28.7 16.3 76.1
Number of Trans. 10,798 8,115 33.1
Companies Traded 43 42 2.4
Market Breadth 34:6 37:5 –
QE Indices
Market Indices Close 1D% RSI
Total Return 18,635.90 1.1 62.0
All Share Index 3,207.15 1.3 63.3
Banks 3,229.06 -0.2 57.5
Industrials 4,023.42 1.4 61.2
Transportation 2,418.82 0.9 68.5
Real Estate 2,468.71 6.0 68.3
Insurance 3,910.12 1.2 62.5
Telecoms 1,402.62 1.8 52.2
Consumer 7,320.31 0.4 64.8
Al Rayan Islamic 4,314.68 1.9 66.7
RSI 14 (Over Bought)
Ticker Close 1D% RSI
AHCS 15.95 10.0 71.2
QNCD 141.00 0.7 70.8
MPHC 30.45 8.0 70.5
RSI 14 (Over Sold)
Ticker Close 1D% RSI
QSE Index (30min)
Source: Bloomberg, QNBFS Research
2. COPYRIGHT: No part of this document may be reproduced without the explicit written permission of QNBFS Page 2 of 6
NLCS
Price % Ch. Volume
Last 20.45 0.15 659,810
Resistance/Support
Levels (QR) 1
st
2
nd
3
rd
Resistance 20.80 21.60 22.00
Support 20.18 19.05 18.41
Commentary
Overview:
The name stabilized above the QR17.50
level for three months. The price did not
appreciate in tandem with other Qatari
constituents that moved over the past two
weeks. Thus, we expect that this lagger
may start to move when the rest of the
appreciated listed stocks cool down. The
Name made an Ascending Triangle and is
trading inside that triangle. We expect the
price to move up at least to the upper side
of the triangle.
Expected Target Price: QR21.60 –
QR22.00
A break above QR20.80 is needed before
buying the stock.
Suggested Stop-Loss Price: QR20.18
(Daily)
Source: Bloomberg, QNBFS Research
(Hourly)
Source: Bloomberg, QNBFS Research
3. COPYRIGHT: No part of this document may be reproduced without the explicit written permission of QNBFS Page 3 of 6
BRES
Price % Ch. Volume
Last 47.90 1.16 2,283,638
Resistance/Support
Levels (QR) 1
st
2
nd
3
rd
Resistance 48.00 49.00 50.00
Support 46.20 45.20 43.40
Commentary
Overview:
The name created a long-legged Doji
candlestick on the daily chart while a large
number of shares exchanged hands over
the past two sessions. Although technical
indicators are still bullish on the daily
chart, the stock could start correcting
downwards. On the hourly chart, BRES’
price movement created what could
possibly be a Tweezers Top price
formation. That is a bearish formation; its
MACD and the RSI are showing evidence
of weakness in price appreciation.
Expected Price Retreat: QR46.20
A break below QR47.70 could take the
price down further to the QR46.20 level.
(Daily)
Source: Bloomberg, QNBFS Research
(Hourly)
Source: Bloomberg, QNBFS Research
5. COPYRIGHT: No part of this document may be reproduced without the explicit written permission of QNBFS Page 5 of 6
Definitions:
Candlestick: A chart that displays the high, low, opening and closing prices for a security in a single period. The body of the candle is made up by the opening
and the closing prices, i.e., the taller the body the greater the range between these two prices and vice versa. A colored candle denotes a closing price that is
lower than the opening price, while a white candle shows the opposite. The candlestick's shadows or wicks show the period's high and low prices and how they
compare to the opening and closing price. In general, the shape of the candle will vary upon the positions of the period's high, low, opening and closing prices.
Support: A level that could cause more buyers to step in in order to prevent the security from falling or causing the security price to head higher.
Resistance: An inverse of a support level. A resistance area or level could cause more sellers to step in in order to prevent the security from rising or causing the
security price to head lower.
SMA (Simple Moving Average): Is an arithmetic average, which calculates the average price of a security over a defined number of periods and is thus
considered a lagging indicator. SMAs used in our analysis refer to closing prices. In general, SMAs serve many purposes, such as a smoothing tool, an indicative
price direction and potential support/resistance levels.
Market Breadth: Breadth indicates the number of securities that have closed higher vs. the number of decliners in a particular exchange.
MACD (Moving Average Convergence/Divergence): Is a trading indicator, which shows changes in the strength, direction, momentum and duration of a trend in
a stock's price through a collection of three time series calculated from historical closing price data.
RSI (Relative Strength Index): Is a momentum indicator that compares a security’s price gains to its losses for a predetermined number of periods (we generally
use 14 periods). The RSI attempts to point out how a security, in relative terms, is in the overbought/oversold zone. Securities with a RSI above 70 could be
considered as overbought, and below 30 could be considered as oversold.
Pattern/Formation: Is a graphical presentation of a security’s price activity over a certain period of time. Formations come in different shapes (such as, head &
shoulders, triangles, flags, and so on). They can be used to identify potential trends, reversal of trends, price targets, entry and exit points, etc.
Fibonacci Retracements: Are horizontal lines that indicate expected areas of support/resistance for a security based on a predetermined price movement. These
levels are usually indicated by Fibonacci ratios of 23.6%, 38.2%, 50.0%, 61.8% and 100% from that particular movement.
Fibonacci Pivot and Intra-day Support/Resistance: A Pivot Point is generally used to formulate expected future support/resistance levels. From the base Pivot
Point, Fibonacci multiples of the high-low differential are added to form resistance levels and subtracted to form support levels.
6. COPYRIGHT: No part of this document may be reproduced without the explicit written permission of QNBFS Page 6 of 6
Contacts
Saugata Sarkar Abdullah Amin, CFA Shahan Keushgerian
Head of Research Senior Research Analyst Senior Research Analyst
Tel: (+974) 4476 6534 Tel: (+974) 4476 6569 Tel: (+974) 4476 6509
saugata.sarkar@qnbfs.com.qa abdullah.amin@qnbfs.com.qa shahan.keushgerian@qnbfs.com.qa
Sahbi Kasraoui Ahmed Al-Khoudary QNB Financial Services SPC
Manager – HNWI Head of Sales Trading – Institutional Contact Center: (+974) 4476 6666
Tel: (+974) 4476 6544 Tel: (+974) 4476 6548 PO Box 24025
sahbi.alkasraoui@qnbfs.com.qa ahmed.alkhoudary@qnbfs.com.qa Doha, Qatar
Disclaimer and Copyright Notice: This publication has been prepared by QNB Financial Services SPC (“QNBFS”) a wholly-owned subsidiary of QNB SAQ (“QNB”). QNBFS is regulated by the Qatar
Financial Markets Authority and the Qatar Exchange QNB SAQ is regulated by the Qatar Central Bank. This publication expresses the views and opinions of QNBFS at a given time only. It is not an offer,
promotion or recommendation to buy or sell securities or other investments, nor is it intended to constitute legal, tax, accounting, or financial advice. QNBFS accepts no liability whatsoever for any direct or
indirect losses arising from use of this report. Any investment decision should depend on the individual circumstances of the investor and be based on specifically engaged investment advice. We
therefore strongly advise potential investors to seek independent professional advice before making any investment decision. Although the information in this report has been obtained from sources that
QNBFS believes to be reliable, we have not independently verified such information and it may not be accurate or complete. QNBFS does not make any representations or warranties as to the accuracy
and completeness of the information it may contain, and declines any liability in that respect. For reports dealing with Technical Analysis, expressed opinions and/or recommendations may be different or
contrary to the opinions/recommendations of QNBFS Fundamental Research as a result of depending solely on the historical technical data (price and volume). QNBFS reserves the right to amend the
views and opinions expressed in this publication at any time. It may also express viewpoints or make investment decisions that differ significantly from, or even contradict, the views and opinions included
in this report. This report may not be reproduced in whole or in part without permission from QNBFS.